
Biosynthesis, isolation, and structural characterization of ε-poly-L-lysine produced by Streptomyces sp. DES20†
Hongliu Gao and
Shi-Zhong Luo*
Beijing Key Laboratory of Bioprocess, College of Science and Technology, Beijing University of Chemical Technology, Chaoyang, Beijing 100029, P. R. China. E-mail: luosz@mail.buct.edu.cn; Fax: +86-10-6444-8964; Tel: +86-10-6443-8015
First published on 1st June 2016
Abstract
ε-Poly-L-lysine (ε-PL) is an unusual, naturally occurring homo-polyamide made of 25–35 L-lysines with antimicrobial activities. ε-PL is widely used in food and medical fields because of its high levels of safety and biodegradability. In our studies, the effects of different fermentation methods on ε-PL biosynthesis by Streptomyces sp. DES20 were determined. Without any control, 2.637 g L−1 ε-PL was produced in a 5 L fermentation tank in 120 h. When feeding glucose and ammonium sulfate during fermentation, the production yield increased to 6.687 g L−1. After adding 2 g L−1 sodium citrate, the ε-PL yield further increased to 8.351 g L−1 at the end of fermentation. The weak acid anion-exchange resin FPC3500 was used to separate and extract ε-PL from the fermentation liquid. ε-PL was eluted with NH4OH with 85.40% purity at a recovery rate of 80.99%. Whereas through hydrochloric acid elution, the recovery rate of ε-PL increased to 89.23% with 95.26% purity. The degree of polymerization was identified as 26–33 using MALDI-TOF-MS. The ε-PL structure was characterized by ultraviolet spectroscopy, infrared spectroscopy, 1H NMR, 13C NMR, and HMBC. ε-PL exhibits significant antimicrobial activities against four different kinds of bacteria.
1. Introduction
ε-Poly-L-lysine (ε-PL) is a cationic polymer with antimicrobial activity produced by Streptomyces albulus or Kitasatospora strains. ε-PL is composed of L-lysine monomers through α-carboxyl groups and ε-amino groups.1 Based on its biodegradable, nontoxic, and edible character, many experts have shown great interest because of its wide use in many fields, such as a drug delivery carrier, biosensor, endotoxin remover, and antiobesity agent.2–4 ε-PL is safe for consumption and has been approved as generally recognized as safe (GRAS) in the United States for certain food applications (GRAS no. 000135) in 2003.5,6 ε-PL exhibits antimicrobial activity against most Gram-positive and Gram-negative bacteria; many countries, including Japan, Korea, and the United States, have used it as food preservative.7,8S. albulus is the most common ε-PL producing strain. Studies have shown that the decline in pH during fermentation is an important condition for the accumulation of ε-PL. Shima et al. first conducted a two-step cultivation method for S. albulus.9 The mutant strain 346 decreases the pH from 6.8 to 4.2 at 36 h, and slowly decreased to 3.2 at 96 h. The production of ε-PL in the broth increased significantly when the pH was about 4.0. At the end of the fermentation, the accumulation of ε-PL was almost ninefold higher than the previous.10 The airlift bioreactor (ABR) was also widely used in ε-PL fermentation. Kahar et al. reported that the use of ABR is a promising tool for the high purity and low cost production of ε-PL.11 Bioprocess using immobilized cells can increase overall productivity and minimize production costs to some extent.12 Zhang et al. found that loofah sponge could improve ε-PL production significantly in shake flask culture.13 Bankar et al. reported that an agitation speed of 300 rpm and aeration rate of 2.0 vvm support increased yields of ε-PL.14 Shih and Shen also applied response surface methodology for optimization of ε-PL production by S. albulus IFO 14147.15 Anuj H. Chheda et al. proved that addition of citric acid after 24 h and L-aspartate after 36 h of fermentation medium exhibited a significant effect on ε-PL production; moreover, glucose feeding strategy along with metabolic precursors further enhanced ε-PL yield to 565 mg L−1, which was more than sixfold increase in ε-PL yield.16 Studies have also shown that glucose–glycerol co-fermentation coupled with precursor L-lysine feeding could enhance ε-poly-L-lysine production to some extent.17 Liu et al. found that using one-stage pH control fed-batch fermentation coupled with nutrient feeding has an efficient influence on cell growth and ε-PL production.18
ε-PL is a cationic polymer, which can be isolated at neutral pH and purified from the culture broth by ion exchange chromatography.1,19 The culture supernatant can be passed through a column at pH 8.5 then washed with 0.2 N acetic acid and water. The elution can be made with 0.1 N hydrochloric acid then adjust the pH to 6.5. High purity ε-PL can be obtained through CM-cellulose column chromatography.
Our study aims to obtain a high ε-PL production using pH control and a variety of control methods in the fermentation using the strain Streptomyces sp. DES20 bred by ourselves through ultraviolet mutagenesis and diethyl sulfate mutagenesis. Moreover, compared with the traditional methods, we tried to set up a new method to separate ε-PL from fermentation broth with less operational process and impurities. We also tried different representations for structure analysis to prove our product's property. Moreover, our products also showed strong antibacterial activity against four different kinds of bacteria.
2. Materials and methods
2.1 Microorganisms and medium
The ε-PL producing strain was isolated from forest soil samples in accordance with the method described by Nishikawa et al.20 Through ultraviolet mutagenesis and diethyl sulfate mutagenesis we obtain a strain named Streptomyces sp. DES20 and was maintained in our laboratory.The tested bacteria Escherichia coli, Staphylococcus aureus, Pseudomonas aeruginosa, and Proteusbacillus vulgaris were also maintained in our laboratory.
For Streptomyces sp. DES20, M3G medium containing 50.0 g glucose, 10.0 g (NH4)2SO4, 5.0 g yeast extract, 1.36 g KH2PO4, 0.8 g K2HPO4, 0.5 g MgSO4·7H2O, 0.03 g FeSO4·7H2O, and 0.04 g ZnSO4·7H2O per liter of distilled water were used as seed and production medium. The media were autoclaved at 121 °C for 20 min. The pH was adjusted to 6.8 with NH4OH solution (24–28%, w/v). In each case, glucose was autoclaved separately.
All the tested bacteria were cultivated in lysogeny broth medium containing 5 g L−1 yeast extract, 10 g L−1 bacto tryptone, and 10 g L−1 NaCl. The media were autoclaved at 121 °C for 20 min.
2.2 Culture conditions
Loopful spores of Streptomyces sp. DES20 were transferred into a 250 mL flask with 50 mL media and inoculated at 30 °C and 200 rpm for 20 h as seed culture. For fermentation, the medium was inoculated with 8% seed culture in a 5 L jar fermentor (Baoxing Corp., Shanghai, China) at 2.0 L working volume. Agitation was provided by a standard six-blade impeller operated from 200 rpm to 500 rpm to control dissolved oxygen (DO) at about 20%, which was monitored with a DO electrode (Mettler Toledo). Aeration was provided by a ring sparger with 1.5 vvm. The pH was monitored with a pH electrode (Mettler Toledo). To control the pH at a set level, 20% NH4OH was automatically added to the culture broth in the fed-batch fermentation. The fermentation temperature was maintained at 30 °C using a recirculating water bath.Batch fermentation, fed-batch fermentation, and fed-batch fermentation supplemented with 2 g L−1 sodium citrate all lasted for 120 h. The feeding solution, composed of 500 g L−1 glucose and 80 g L−1 ammonium sulfate, was allowed to flow in fed-batch fermentation to maintain the glucose at 10 g L−1.
2.3 Analytical methods
The fermented liquid was centrifuged at 10![[thin space (1/6-em)]](https://www.rsc.org/images/entities/char_2009.gif) 000 rpm for 15 min. ε-PL was measured based on the high-performance liquid chromatography (HPLC) method reported by Kahar et al. and the method of Itzhaki.8,10 A ε-PL standard obtained from Zhejiang Silver-Elephant Bio-engineering Co., Ltd., was used to construct a calibration curve. Glucose was measured by the method of DNS. Biomass accumulation was estimated using dry cell weight analysis. Approximately 10 mL of culture was subjected to centrifugation at 8000 rpm for 10 min, washed twice with distilled water, and then dried until a constant weight was obtained at 70 °C in an oven.
000 rpm for 15 min. ε-PL was measured based on the high-performance liquid chromatography (HPLC) method reported by Kahar et al. and the method of Itzhaki.8,10 A ε-PL standard obtained from Zhejiang Silver-Elephant Bio-engineering Co., Ltd., was used to construct a calibration curve. Glucose was measured by the method of DNS. Biomass accumulation was estimated using dry cell weight analysis. Approximately 10 mL of culture was subjected to centrifugation at 8000 rpm for 10 min, washed twice with distilled water, and then dried until a constant weight was obtained at 70 °C in an oven.
2.4 Purification and structure identification of ε-PL
The culture broth was centrifuged at 8000 rpm for 15 min at 4 °C. The pH of the supernatant was adjusted to 8.5 using 1 M NaOH. After filtration the supernatant was adsorbed to the weak acid anion-exchange resin FPC3500 pretreated previously. Two elutions were carried out, as follows: the traditional one used washing with water, 0.2 N acetic acid, and 0.1 N hydrochloric acid, whereas the innovative one used washing with water and different concentrations of NH4OH. Then, we collected the eluent, adjusted the pH to 6.5, and concentrated to a small volume. The final products were obtained through freeze-drying and were analyzed.The purity was measured by HPLC as mentioned in Section 2.3. Approximately 0.1 mg mL−1 ε-PL was used for UV-VIS adsorption spectroscopy under 200–400 nm. Whereas, infrared spectroscopy was carried out under 4000–400 cm−1 with 4 cm−1 resolution ratio. 1H NMR and 13C NMR were tested by Bruker DRX-400 MHz. HMBC was tested by Bruker DRX-600 MHz. To determine the degree of polymerization, MALDI-TOF-MS was carried out.
2.5 MIC determination
The MIC of antimicrobials was determined using the method reported by Nedorostova.21 All the tested bacteria were incubated at 37 °C for 12 h to approximately 106 CFU mL−1 in lysogeny broth medium. Serial dilutions of ε-PL standard and isolated products were prepared to obtain final concentrations of 1, 2, 4, 8, 16, 32, 64, 128, 256, 512, 1024, and 2048 mg L−1. The plates were incubated for 16–20 h before recording the MICs. Samples without ε-PL were used as controls.3. Results and discussion
3.1 ε-PL fermentation with different controls
As shown in Fig. 1A, the pH of the culture broth rapidly decreased from 6.8 to 4.0 at 48 h. Then, the cells began to synthesize ε-PL with the proper pH. The declining pH likely resulted from glucose consumption. Without any control, the pH of the culture broth continued to decrease to 2.67 and resulted in less ε-PL accumulation in the batch fermentation, whereas the ε-PL remained accumulated in the fed-batch fermentation with a proper pH.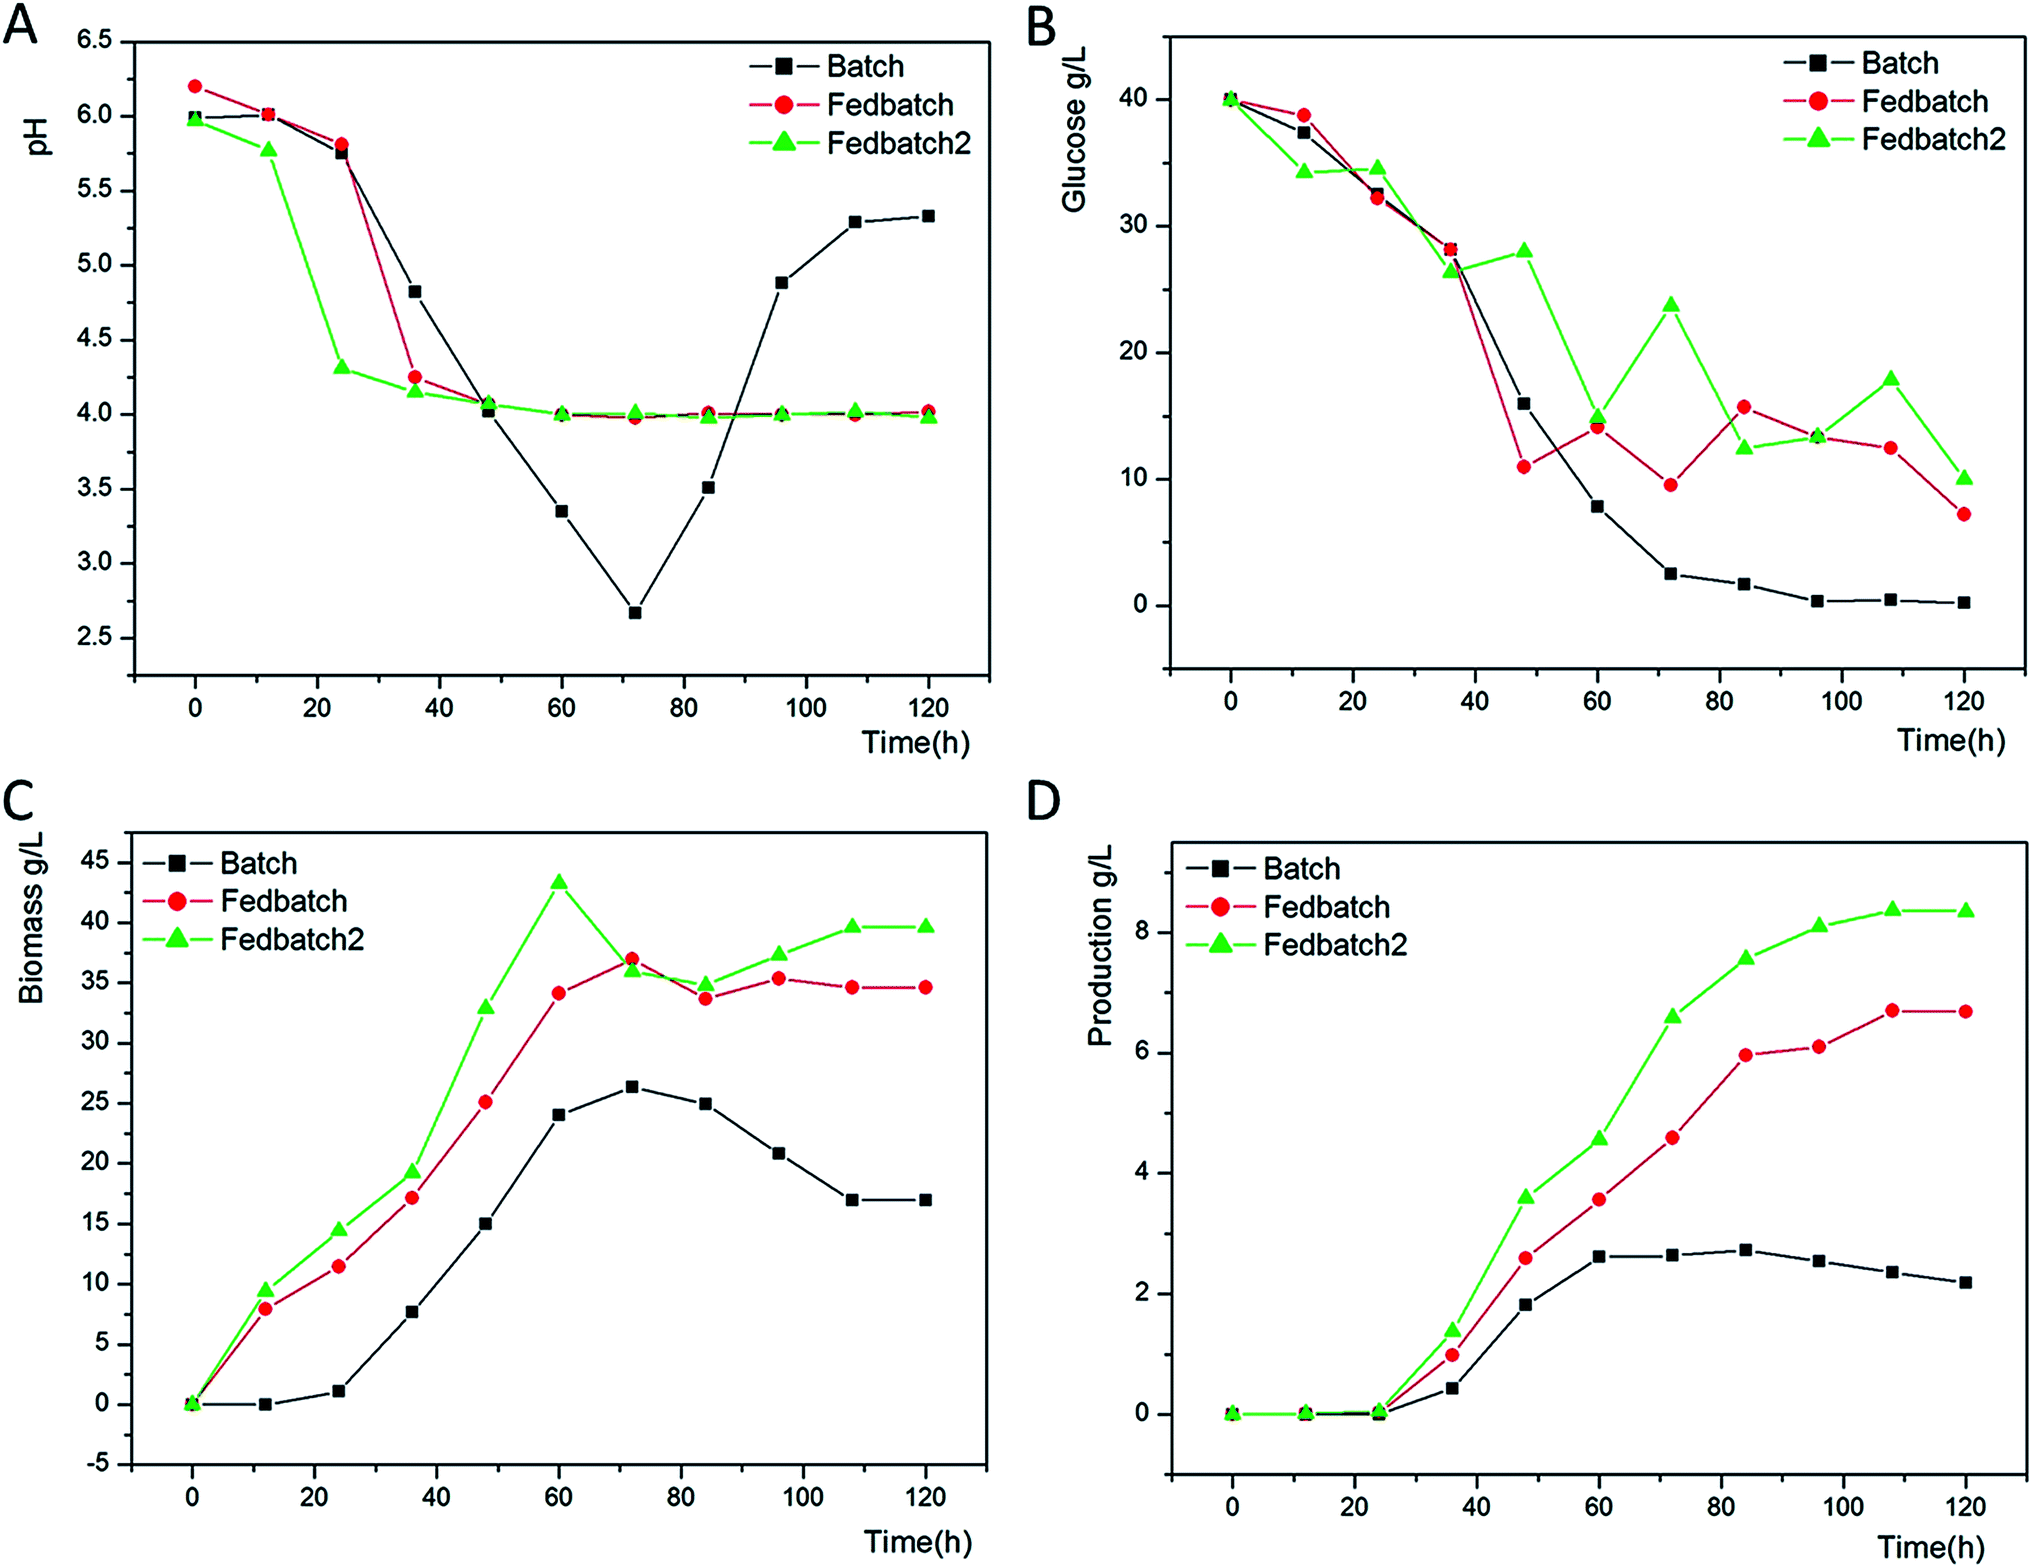 | ||
| Fig. 1 Time profiles of pH (A), glucose (B), biomass (C), and ε-PL (D) of the medium with batch fermentation (filled squares), fed-batch fermentation (filled circles), and fed-batch fermentation supplemented with 2 g L−1 sodium citrate (filled triangles). | ||
As glucose can be carbon and energy sources to a ε-PL producing strain for growing and ε-PL synthesis, keeping the residual glucose at an appropriate level could be important.22 As seen in Fig. 1B, glucose concentration decreased rapidly at 48 h for cell growth. Without utilization for growth and energy, the glucose concentration declined to 0.21 g L−1 in the batch fermentation leading to a low ε-PL production. The advantage of the fed-batch culture is that one can control concentration of fed-substrate in the culture liquid at arbitrarily desired levels.
Herein, the whole fermentation can be divided into two stages. Before 48 h, we obtain a rising biomass of 15.005 g L−1, 25.085 g L−1, and 32.885 g L−1 in three attempts (Fig. 1C). Feeding glucose and ammonium sulfate to the medium at 36 h leads to an increasing biomass of 36.962 g L−1 and 35.962 g L−1 at 72 h as expected in the batch fermentation of 26.368 g L−1. We regarded 72–120 h as the second stage, in which Streptomyces sp. DES20 stopped growing to synthesize ε-PL. In combination with the variation pH, increasing amount of mycelium indicates that appropriate sodium citrate could slightly promote the cell growth.
ε-PL began to accumulate gradually after 36 h as shown in Fig. 1D. As discussed previously, the increase in ε-PL was attributed to the bacteria growth phase before 72 h resulting in ε-PL production of 2.637 g L−1, 4.590 g L−1, and 6.590 g L−1 in three attempts. After 72 h, the bacteria entered into the secondary metabolism stage, which was the ε-PL production phase. Proper concentration of glucose and ammonium sulfate was beneficial for ε-PL accumulation to reach the maximum values of 6.687 g L−1 and 8.351 g L−1 in the fed-batch fermentation and fed-batch fermentation supplemented with 2 g L−1 sodium citrate, respectively. By contrast, we only obtain a production of 2.189 g L−1 in the batch fermentation. Herein, we found that appropriate sodium citrate was not only beneficial for the cell growth but also could promote ε-PL accumulation to some extent.
3.2 Separation of ε-PL with different elution methods
For the hydrochloric acid elution, 1063 mL treated culture broth was adsorbed into 100 mL pretreated cation exchange resin FPC3500 at a flow rate of 2 mL min−1. Up to 100 mL distilled water and 200 mL 0.2 N acetic acid were used to remove most of the impurities after sorption saturation. The elution volume of hydrochloric acid was 1300 mL, concentrated at 179 mL before dialysis with 1 kDa dialysis bag. Purified ε-PL was obtained through freeze-drying with a recovery rate of 89.23%. For the NH4OH elution, 1015 mL culture broth was treated at a flow rate of 2 mL min−1. After removing impurities with 100 mL distilled water and 0.5% NH4OH, 1652 mL of 1% NH4OH was used to washout ε-PL. We obtained purified ε-PL using the same method, and the recovery rate was 80.99%. Besides higher recovery rate, elution with hydrochloric acid also manifested higher purity than that of NH4OH as shown in Table 1. The advantage of elution with hydrochloric acid is that H+ can permutate more ε-PL with less volume than that of NH4+.| Elution method | Recovery rate% | Sample concentration g L−1 | ε-PL g L−1 by Itzhaki | Area reject | Purity% |
|---|---|---|---|---|---|
| Standard substance | — | 5 | 4.877 | 1182168 |
— |
| Hydrochloric acid | 89.23 | 5 | 4.756 | 1126191 |
95.26 |
| NH4OH | 80.99 | 5 | 4.084 | 1009527 |
85.40 |
3.3 Structure identification of ε-PL
As shown in Fig. 2, the maximum absorption appearing at 215 nm proves the presence of peptide bond and the absence of benzene in our sample. To further investigate the structure, infrared spectroscopy experiment was carried out. Many infrared absorption peaks can be seen in Fig. 3: 1670 cm−1, 1561 cm−1, and 1280 cm−1 refer to C![[double bond, length as m-dash]](https://www.rsc.org/images/entities/char_e001.gif) O stretching vibration, N–H flexural vibration, and C–N stretching vibration in the amide group, respectively. Whereas, 3402 cm−1 and 3247 cm−1 refer to N–H asymmetric stretching vibration and symmetrical stretching vibration, respectively. Infrared absorption at 2936 cm−1 and 1398 cm−1 suggested the existence of –CH and –CH2, respectively. Whereas, 1161 cm−1 and 657 cm−1 indicated the existence of –NH2 and –NH, respectively.
O stretching vibration, N–H flexural vibration, and C–N stretching vibration in the amide group, respectively. Whereas, 3402 cm−1 and 3247 cm−1 refer to N–H asymmetric stretching vibration and symmetrical stretching vibration, respectively. Infrared absorption at 2936 cm−1 and 1398 cm−1 suggested the existence of –CH and –CH2, respectively. Whereas, 1161 cm−1 and 657 cm−1 indicated the existence of –NH2 and –NH, respectively.
 | ||
| Fig. 2 UV-Vis scanning spectrum of the product isolated from Streptomyces sp. DES20. | ||
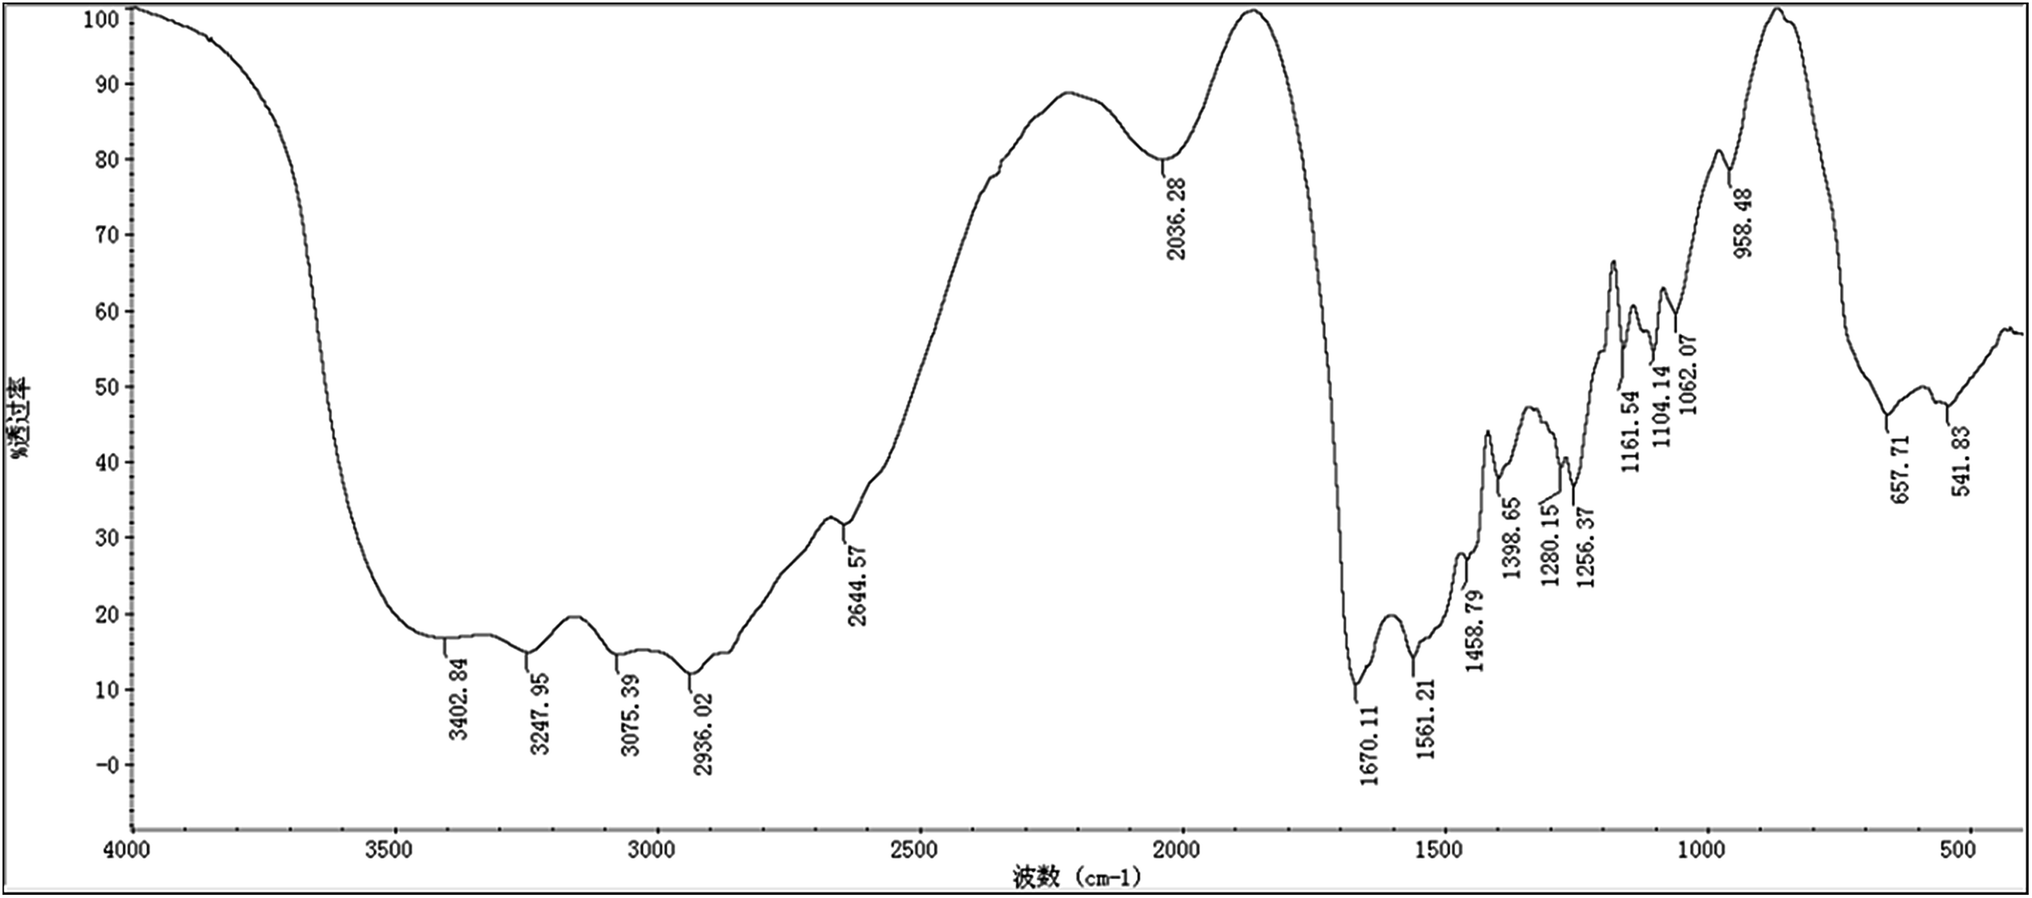 | ||
| Fig. 3 Infrared scanning spectrum of the product isolated from Streptomyces sp. DES20. | ||
Five different chemical shifts of hydrogen atom were observed (Fig. 4) with peak area ratio of 1:2:2:2:2 referring to CHα, CHε, CHβ, CHδ, and CHγ, which was the same as reported.23 Nearly, six different chemical shifts of carbon atoms were observed with 170 ppm, 53 ppm, 39 ppm, 31 ppm, 28 ppm, and 22 ppm on behalf of CO, Cα, Cε, Cβ, Cδ, and Cγ respectively, as shown in Fig. 5. HMBC could close the spectral correlation long-range coupling of carbon and hydrogen atoms. HMBC could connect the carbon and hydrogen atoms across three chemical bonds. Sometimes, carbon and hydrogen atoms across four or two chemical bonds could also be connected. As shown in Fig. 6, a strong combination between CO and Hα was observed. Hε proved that the dehydration condensation reaction was carried out between α-carboxyl and ε-amino. 1H NMR, 13C NMR, and HMBC confirmed that our product is ε-PL and not α-PL.
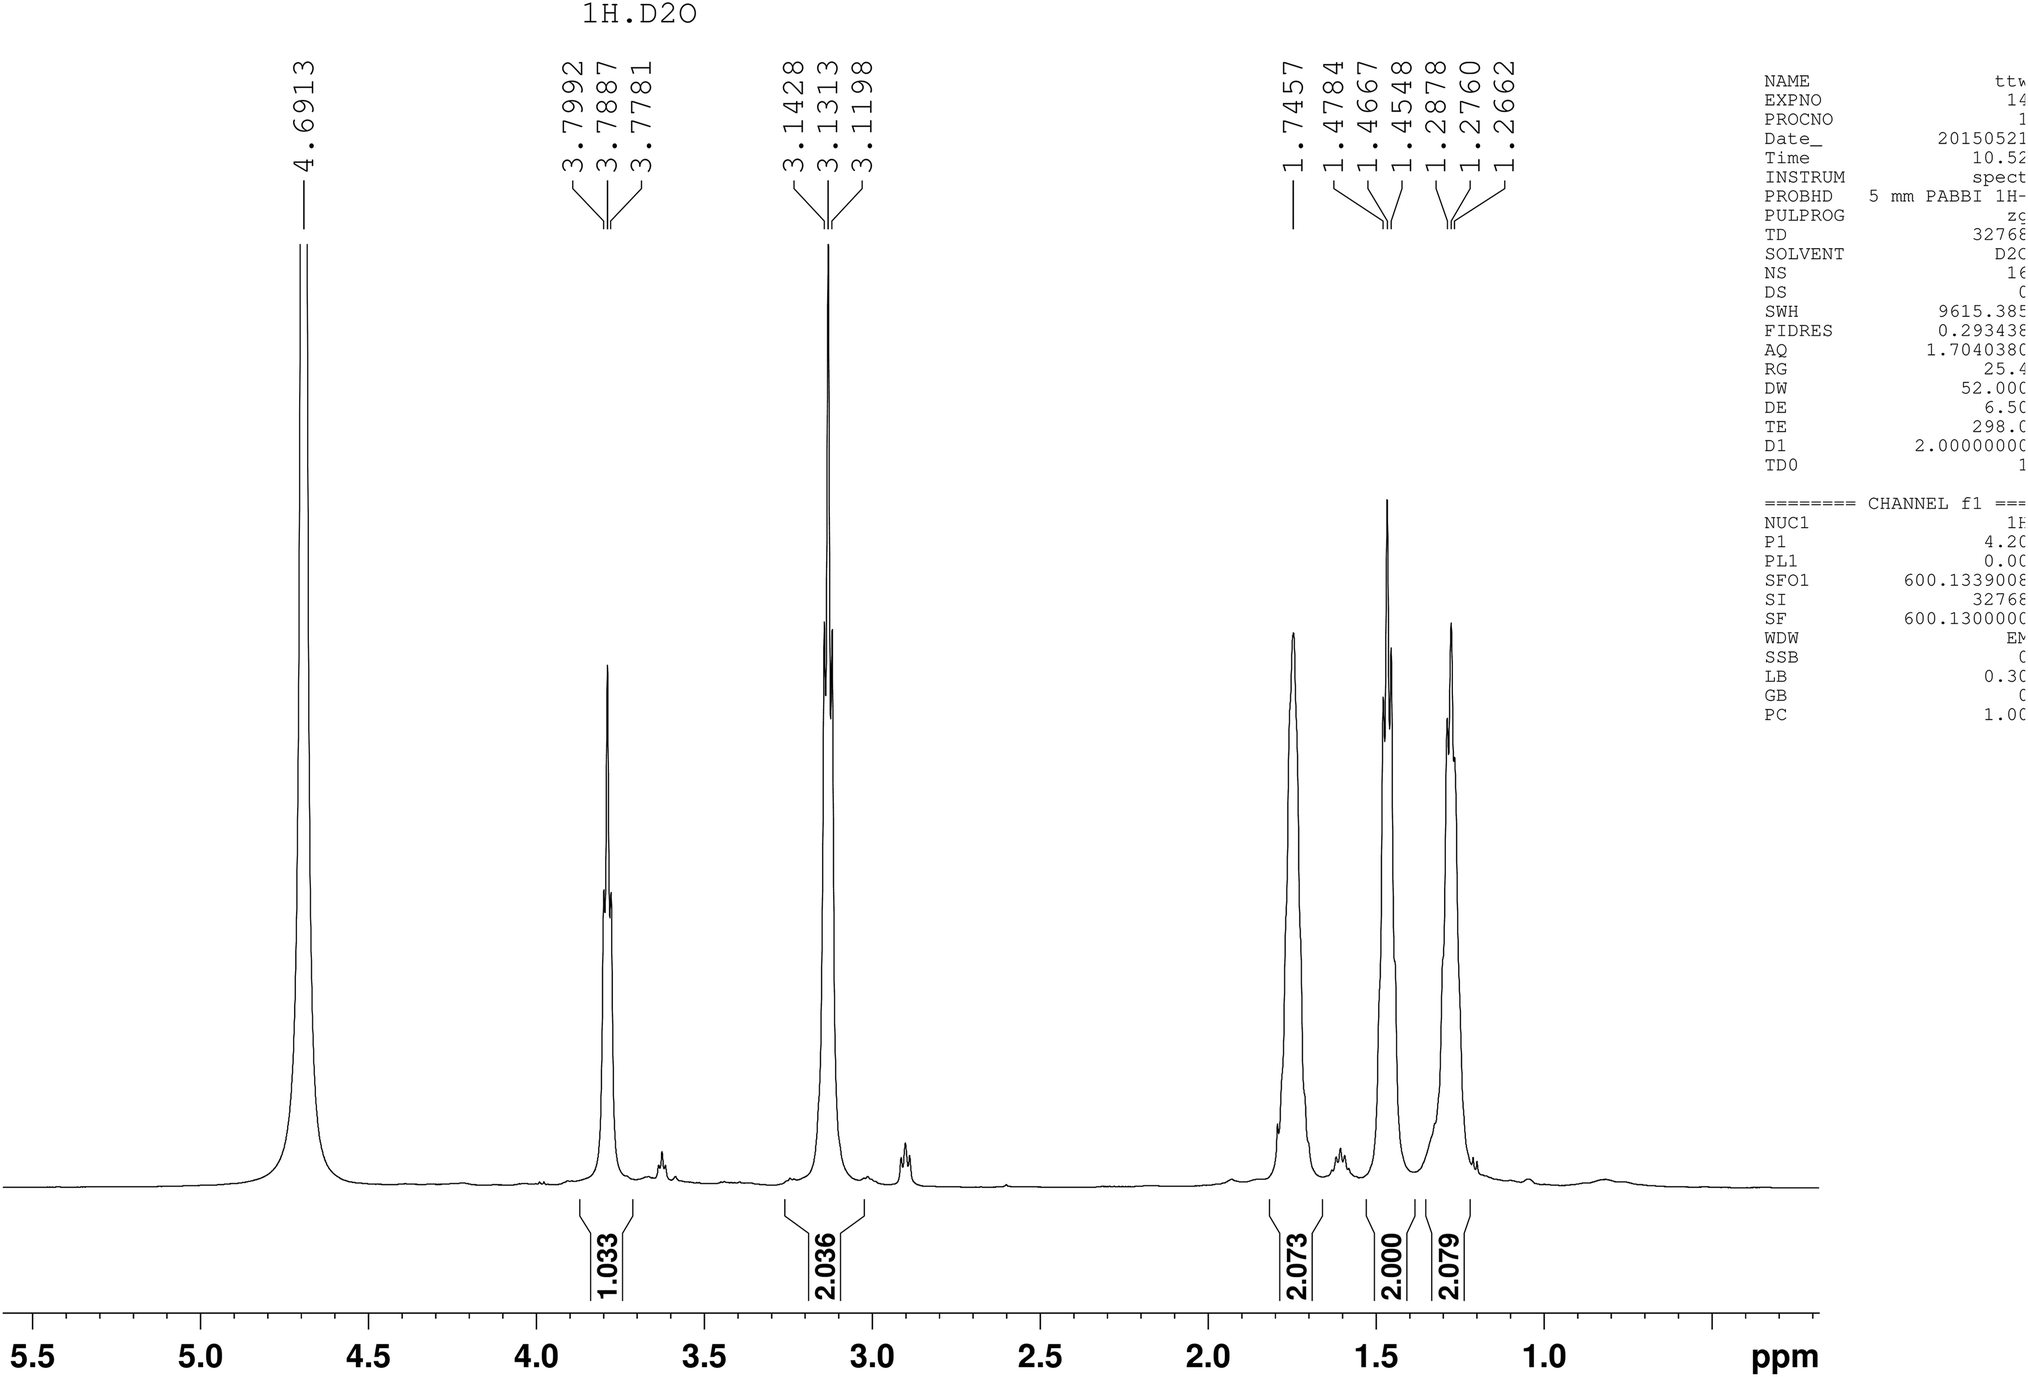 | ||
| Fig. 4 1H-NMR of the product isolated from Streptomyces sp. DES20. | ||
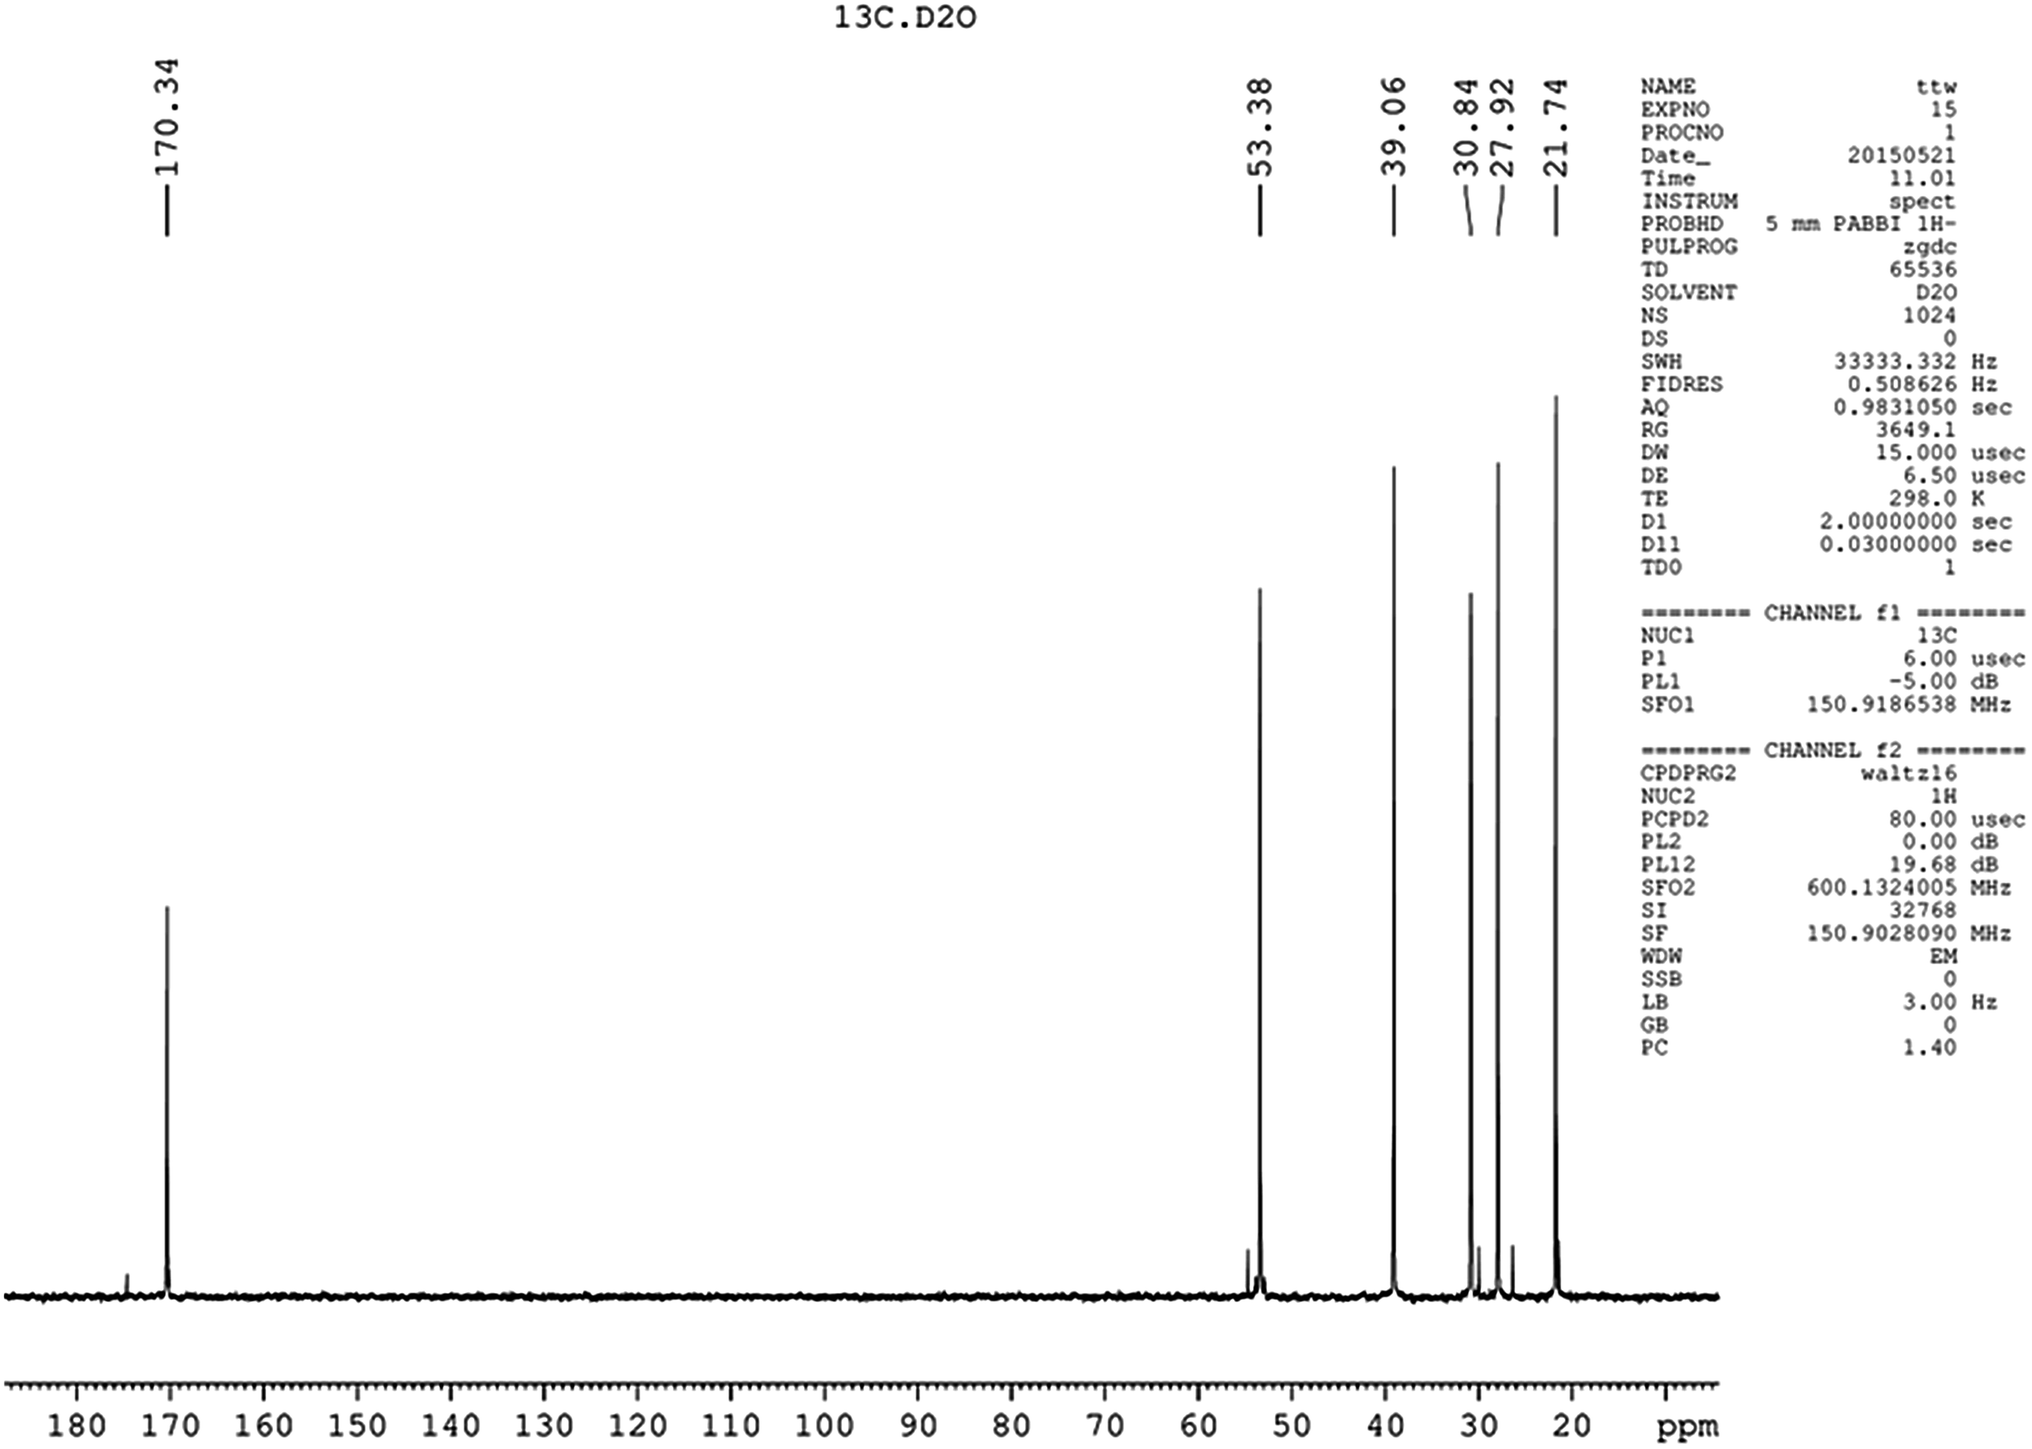 | ||
| Fig. 5 13C NMR of the product isolated from Streptomyces sp. DES20. | ||
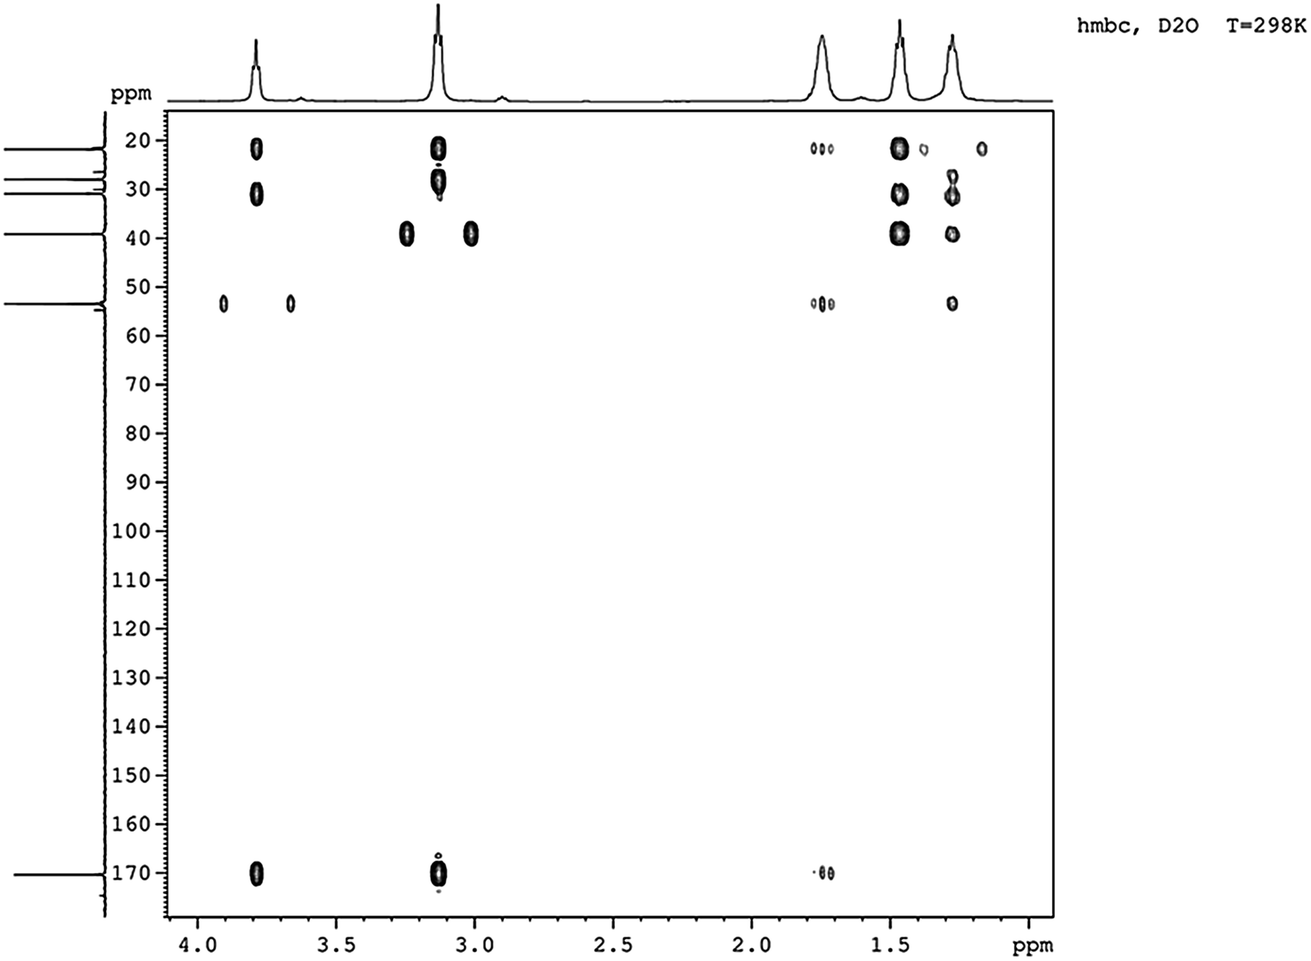 | ||
| Fig. 6 HMBC of the product isolated from Streptomyces sp. DES20. | ||
No antimicrobial activity was observed when the degree of ε-PL was under 9. Thus, to detect the degree of ε-PL is of vital importance. The degree of ε-PL and the relative molecular mass theory formula are as follows:
| MW = 146.19n − 18.02(n − 1). |
MW represents the relative molecular mass of ε-PL, n refers to the degree of polymerization, 146.19 is the relative molecular mass of L-Lys, and 18.02 is the relative molecular mass of H2O. As shown in Fig. 7, the degree of ε-PL is 26–33.
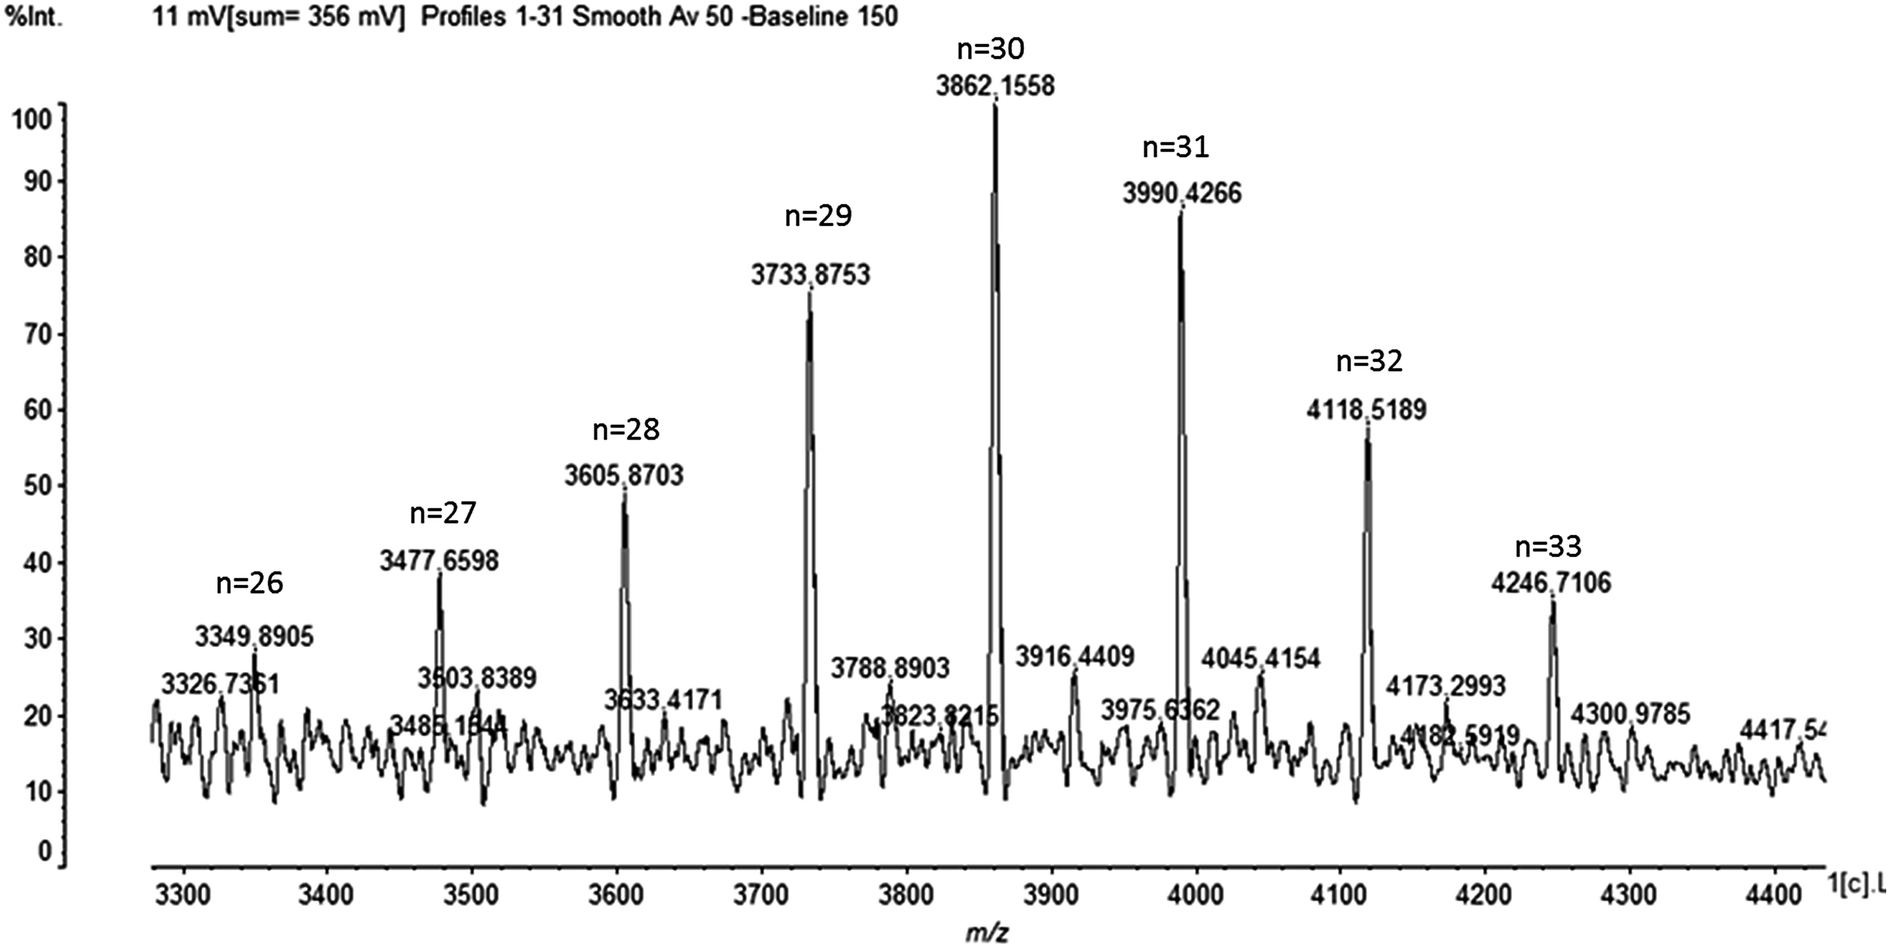 | ||
| Fig. 7 MALDI-TOF-MS spectra of the product isolated from Streptomyces sp. DES20. | ||
3.4 Antimicrobial activities of different bacteria
Antibacterial experiments were carried out on E. coli, S. aureus, P. aeruginosa, and P. vulgaris. As seen in Fig. 8A and B, both our fermentation products and ε-PL standard showed great antibacterial property to Gram-negative bacteria. For the fermentation products, the minimal inhibitory concentration was 4 mg L−1 and 2 mg L−1 to E. coli and S. aureus with a survival rate of 90.10% and 70.64%, respectively. Whereas the minimal inhibitory concentration slightly increased for Gram-positive bacteria, such as P. aeruginosa and P. vulgaris because of their complicated cell wall structure and composition. The minimal inhibitory concentration for P. aeruginosa and P. vulgaris was 64 mg L−1 and 16 mg L−1 with a survival rate of 76.45% and 90.01%, respectively. When the ε-PL concentration was increased to 2048 mg L−1, all the bacteria survival rates were under 20%, thereby indicating that our fermentation products had strong antibacterial activity. | ||
| Fig. 8 Fermentation products and ε-PL standard MIC to Escherichia coli (A), Staphylococcus aureus (B), Pseudomonas aeruginosa (C) and Proteusbacillus vulgaris (D). | ||
4. Conclusions
The productivity of ε-PL has undergone major improvements because of the use of optimized cultivation methods and selection of high yielding mutants.24 In this study, the production increased significantly by the addition of appropriate sodium citrate and fed-batch of glucose and ammonium sulfate. Except for the traditional segregation pattern, we found a new elution mode to separate ε-PL from the fermentation broth, which could assure less impurities and high recovery in the system. MIC experiments indicate that the fermentation products exhibit great antibacterial activity to the common pathogenic bacteria, such as E. coli, S. aureus, P. aeruginosa, and P. vulgaris.Acknowledgements
This work was supported by the National Basic Research Program of China (973 program; 2013CB910700), the National Natural Science Foundation of China (21372026, 21402006), Beijing NOVA Programme (Z131102000413010) and the Fundamental Research Funds for the Central Universities (Grand No. 2050205, JC1502, 20130801, YS1407).References
- S. Shima and H. Sakai, Agric. Biol. Chem., 1977, 41, 1807–1809 CAS.
- I. L. Shih, Y. T. Van and M. H. Shen, Mini-Rev. Med. Chem., 2004, 4, 179–188 CrossRef CAS PubMed.
- I. L. Shih, M. H. Shen and Y. T. Van, Bioresour. Technol., 2006, 97, 1148–1159 CrossRef CAS PubMed.
- A. K. Pandey and A. Kumar, Process Biochem., 2014, 49, 496–505 CrossRef CAS.
- J. Hiraki, T. Ichikawa, S. Ninomiya, H. Seki, K. Uohama, H. Seki, S. Kimura, Y. Yanagimoto and J. W. Barnett, Regul. Toxicol. Pharmacol., 2003, 37, 328–340 CrossRef CAS PubMed.
- FDA, Agency Response Letter GRAS Notice No. GRN 000135, 2004.
- J. Hiraki, Fine Chem., 2000, 29, 18–25 Search PubMed.
- S. Shima, H. Matsuoka, T. Iwamoto and H. Sakai, J. Antibiot., 1984, 37, 1449–1455 CrossRef CAS PubMed.
- S. Shima, S. Oshima and H. Sakai, Journal of the Agricultural Chemical Society of Japan, 1983, 57, 221–226 CrossRef CAS.
- P. Kahar, T. Iwata, J. Hiraki, E. Y. Park and M. Okabe, J. Biosci. Bioeng., 2001, 91, 190–194 CrossRef CAS PubMed.
- P. Kahar, K. Kobayashi, T. Iwata, J. Hiraki, M. Kojima and M. Okabe, J. Biosci. Bioeng., 2002, 93, 274–280 CrossRef CAS PubMed.
- I. R. Pinheiro and M. C. R. Facciotti, Process Biochem., 2008, 43, 661–666 CrossRef CAS.
- Y. Zhang, X. Feng, H. Xu, Z. Yao and P. Ouyang, Bioresour. Technol., 2010, 101, 5523–5527 CrossRef CAS PubMed.
- S. B. Bankar and R. S. Singhal, J. Microbiol. Biotechnol., 2011, 21, 652–658 CAS.
- I. L. Shih and M. H. Shen, Enzyme Microb. Technol., 2006, 39, 15–21 CrossRef CAS.
- A. H. Chheda and M. R. Vernekar, Biotech, 2015, 5, 839–846 Search PubMed.
- X. S. Chen, X. D. Ren, X. Zeng, F. L. Zhao, L. Tang, H. J. Zhang, J. H. Zhang and Z. G. Mao, Bioprocess Biosyst. Eng., 2013, 36, 1843–1849 CrossRef CAS PubMed.
- S. R. Liu, Q. P. Wu, J. M. Zhang and S. P. Mo, J. Microbiol. Biotechnol., 2015, 25, 358–365 CrossRef CAS PubMed.
- H. Lee, K. Oyama, J. Hiraki, M. Hatakeyama, Y. Kurokawa and H. Morita, Chem. Express, 1991, 6, 683–686 CAS.
- M. Nishikawa and K. Ogawa, Appl. Environ. Microbiol., 2002, 68, 3575–3581 CrossRef CAS PubMed.
- L. Nedorostova, P. Kloucek, L. Kokoska, M. Stolcova and J. Pulkrabek, Food Control, 2009, 20, 157–160 CrossRef CAS.
- I. L. Shih and M. H. Shen, Process Biochem., 2006, 41, 1644–1649 CrossRef CAS.
- S. Maeda, K. K. Kunimoto, C. Sasaki, A. Kiwae and K. Hanai, J. Mol. Struct., 2003, 655, 149–155 CrossRef CAS.
- J. Hiraki, M. Hatakeyama, S. Morita and Y. Izumi, Seibutsu Kogaku Kaishi, 1998, 76, 487–493 CAS.
Footnote |
| † Electronic supplementary information (ESI) available. See DOI: 10.1039/c6ra10829f |
| This journal is © The Royal Society of Chemistry 2016 |