 Open Access Article
Creative Commons Attribution 3.0 Unported Licence
Porous MgF2-over-gold nanoparticles (MON) as plasmonic substrate for analytical applications
D. Bartkowiakab,
V. Merkab,
V. Reiter-Schererc,
U. Gernertd,
J. P. Rabec,
J. Kneipp*a and
E. Kemnitz*a
aHumboldt-Universität zu Berlin, Department of Chemistry, Brook-Taylor-Str. 2, 12489 Berlin, Germany. E-mail: janina.kneipp@chemie.hu-berlin.de; erhard.kemnitz@chemie.hu-berlin.de
bHumboldt-Universität zu Berlin, School of Analytical Sciences Adlershof (SALSA), Albert-Einstein-Str. 5-9, 12489 Berlin, Germany
cHumboldt-Universität zu Berlin, Department of Physics & IRIS Adlershof, Newtonstraße 15, 12489 Berlin, Germany
dTechnische Universität Berlin, Center for Electron Microscopy (ZELMI), Straße des 17. Juni 135, D-10623, Berlin, Germany
First published on 21st July 2016
Abstract
Porous MgF2-over-nanoparticles (MON) surfaces are fabricated from immobilized gold nanoparticles of different sizes on a glass surface by coating them with a magnesium fluoride layer. High mechanical stability of the resulting plasmonic surface is obtained, and optical spectroscopy across a very wide optical window is enabled. The nanoscopic characterization by scanning force microscopy and electron microscopy shows a uniform assembly of the gold nanoparticles in monolayers and a complete coating by magnesium fluoride. Surface-enhanced Raman scattering (SERS) experiments provide evidence that organic analyte molecules have free access to the gold surface, and interact with the immobilized nanoparticles in a very similar fashion as with uncoated surfaces. As the spectroscopic results indicate, the coating leads to properties that are favourable for plasmonic enhancement of optical processes excited in the visible and near-infrared. As demonstrated by experiments using SERS, as well as by finite difference time domain (3D-FDTD) simulations, enhancement factors are obtained that allow for analytical applications with optical excitations ranging from the visible to the near infrared.
Introduction
The popularity of optical methods that rely on the local optical fields provided by plasmonic nanostructures has grown exponentially since the discovery of surface enhanced Raman scattering (SERS) in 1977.1 Nowadays, powerful analytical tools that include combinations of different plasmonic sensing approaches require continuous improvements of plasmonic substrates, enabling selectivity, stability of the nanostructures and of the optical signals, biocompatibility, easy and reproducible fabrication, and microscopic homogeneity. Numerous materials, such as electrochemically roughened surfaces, nanoparticles, functionalized nanoparticles, and composite nanostructures have been under discussion2 in order to fulfill as many of these criteria as possible. As has been shown previously, plasmonic nanoparticles can be immobilized on glass surfaces by silane chemistry,3,4 and stable, multifunctional plasmonic surfaces can be generated,5 e.g., for quantitative monitoring of catalytic reactions by SERS.6Noble metal nanostructures have been coated by dielectric materials,7 specifically silica, to modify their selectivity, affinity, and stability,8,9 to use them as carriers of label molecules,10 to increase the sensitivity of plasmonic sensors, and to adjust their optical properties.11–13 Similarly, plasmonic-semiconductor nanostructures employing titania embedding or coating have been synthesized, to exploit plasmon-enhanced catalytic properties14 and to study phosphopeptides sensing.15
Building on the high microscopic homogeneity of silane-immobilized gold nanoparticles on glass surfaces demonstrated previously,5 in this work, we discuss two dimensional nanomaterials made of gold nanoparticles and magnesium fluoride which can be applied as versatile plasmonic substrate. In particular, we decided to combine the favourable properties of immobilized gold nanoparticles with the optical and mechanical properties of nanoscopic magnesium fluoride. Magnesium fluoride, commonly applied in antireflective coating, exhibits a particularly low refractive index (nMgF2 = 1.38, for comparison nSiO2 = 1.50 and nAl2O3 = 1.78)16,17 and shows high transmittance across the UV-Vis to IR range (∼100 nm to ∼8 μm).18,19 Moreover, the properties of magnesium fluoride layers, including porosity, can be controlled by the calcination temperature and the applied magnesium precursor.16 Magnesium fluoride films are mechanically very resistant, e.g., even against steel wool.19 These interesting optical and mechanical properties of magnesium fluoride films lead us to expect that it might be a beneficial compound in a plasmonic substrate. Here, we investigate the structure, composition, nanoscopic morphology and mechanical resistance of MON and discuss the influence of the magnesium fluoride coating on the optical properties of the material. In particular, experimental and theoretical evidence is provided that the field enhancement yielded by the structures enables their use in a wide range of plasmon-enhanced analytical applications, including SERS.
Early attempts of preparation thin-film Au–MgF2 cermets or nanocomposite films e.g., using vacuum deposition methods were taken several decades ago,20,21and more recently, the sol–gel and dip-coating method applying mixed sols of gold nanoparticles and magnesium fluoride have been used.22 Different from previous work, in order to create magnesium fluoride surfaces of homogeneous thickness and controllable porosity over large areas that meet the criteria of plasmonic substrates for spectroanalytical and other optical applications, we aimed at immobilization of gold nanoparticles on glass surfaces in the first step, followed by coating with magnesium fluoride.
Experimental
Synthesis of MgF2 coated gold nanoparticle arrays
Gold nanoparticles in the size between 20 nm and 50 nm in diameter were synthesized according to the citrate reduction procedure described by Bastús et al.22 Briefly: 150 ml of 2.2 mM sodium citrate solution was heated till the boiling point, then 1 ml of 25 mM HAuCl4 solution was injected. The solution was kept at the boiling temperature for 15 min and then cooled down to 90 °C. After 30 min, when the color turned to red, 1 ml of 60 mM sodium citrate was added. After two minutes, 1 ml of 25 mM HAuCl4 was injected. The number of repetitions of the two last steps allowed to control the size of the gold nanoparticles. Before the synthesis, all the glassware was washed with aqua regia. All solutions were prepared using MilliQ water.Magnesium fluoride was synthesized via the fluorolytic sol–gel method.23 Briefly: magnesium turnings were dissolved in dry methanol. Methanolic hydrogen fluoride solution was added to the formed magnesium methoxylate solution under stirring. After 30 min, 10 wt% trifluoroacetic acid (TFA) was added to the sol.
Glass microscope slides with a size of 76 × 24 mm and a thickness of about 1 mm were used as substrate for preparation of MON. The glass slides were cleaned with piranha solution and distilled water. The washed slides were immersed in a mixture of 3-aminopropyltriethoxysilane and water (1/4, v/v) for 30 min. Excess 3-aminopropyltriethoxysilane was removed by washing with distilled water. Afterwards, the glass slides were dried at room temperature for 10 min and at 120 °C for 10 min. The dried modified glass slides were immersed in a solution of gold nanoparticles for 24 hours.
A methanolic solution of magnesium fluoride [0.1–0.2 M] was placed in a Teflon square beaker. Glass slides were mounted in a sample holder, immersed in this solution for 2–60 s, and removed with a speed of 10–20 cm min−1. Afterwards they were dried in air for 10 min at room temperature and then for 10 min in the oven at 120 °C. The samples were calcined in a furnace at 200 °C for 15 min.
Nanoscopic characterization
Results and discussion
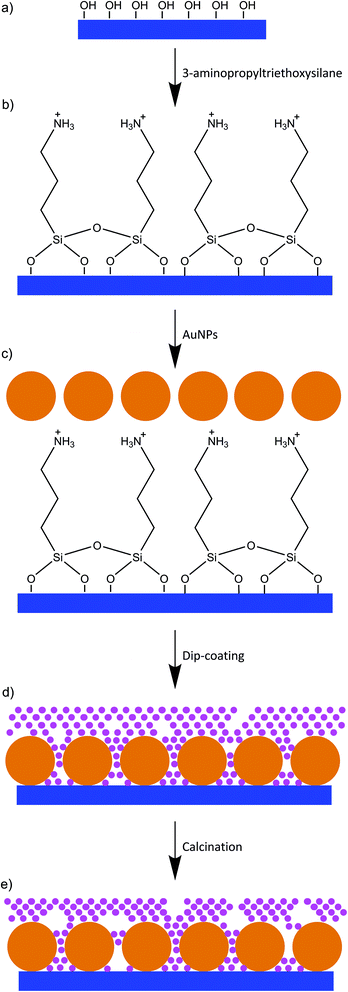
The new nanomaterials built up by gold nanoparticles and magnesium fluoride layers on top were obtained by the approach described in Fig. 1. Citrate stabilized gold nanoparticles in the size between 20 nm and 50 nm in diameter were characterized by UV/Vis absorbance spectroscopy and transmission electron microscopy. The size of the gold nanoparticles was determined from TEM images (Fig. 2) using ImageJ software to be 26 ± 3, 36 ± 4 and 47 ± 5 nm in diameter. Firstly, glass slides were washed with piranha solution in order to increase the number of silanol groups on the glass surface.26 In the second step, the glass slides were functionalized with 3-aminopropyltriethoxysilane (Fig. 1a and b).15 Next, the gold nanoparticles were immobilized on the glass surface due to electrostatic interactions with the amino group of the 3-aminopropyltriethoxysilane, which acts as a linker (Fig. 1c). The last step of the sample preparation is the deposition of a magnesium fluoride layer by dip coating with an alcoholic MgF2-sol (Fig. 1d). By applying different concentrations of the magnesium fluoride sol and different speeds of the dip coating, we were able to control the thickness of the magnesium fluoride layer. A low concentration of magnesium fluoride (0.1 M) and a low speed of dip-coating (10 cm min−1) enable the formation of thin layers of magnesium fluoride. Long immersion times (30 s) provided high homogeneity of the magnesium fluoride layer. The calcination process at relatively low temperatures leads to a thermal decomposition of organic residues, thereby providing pure inorganic films. This is an advantage over titania- or zirconia-based systems which require higher annealing temperatures.16 | ||
| Fig. 2 Transmission electron micrographs of the gold nanoparticles with an average diameter of (a) 26 ± 3 nm, (b) 36 ± 4 nm and (c) 47 ± 5 nm. | ||
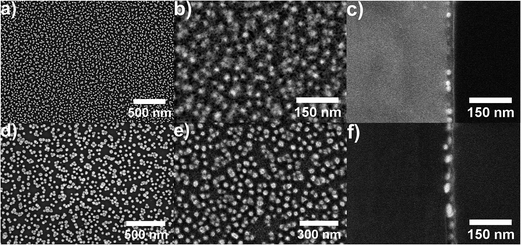
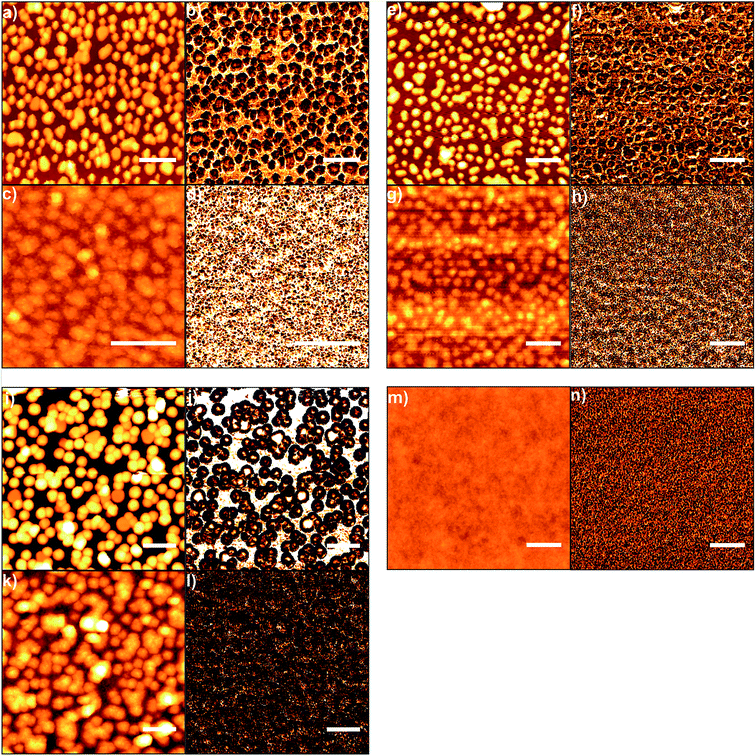
The thickness of the magnesium fluoride layers was estimated from scanning electron microscopic (SEM) cross sectional images; examples are shown in Fig. 3. Using 0.1 M MgF2 solution, 20 cm min−1 speed of dip coating and 30 s of immersion time, a layer of approximately 30 nm magnesium fluoride was formed. The SEM images clearly show that the small gold nanoparticles (26 nm) are completely coated with magnesium fluoride (Fig. 3a–c). However, for the bigger gold nanoparticles (36 nm) we observed some SEM images that did not unambiguously prove full coverage of the gold particles (not shown here). Therefore, quantitative scanning force microscopy (SFM) imaging was utilized to simultaneously determine the topography and the adhesion properties of the samples. In quantitative imaging, the SFM measures a force–distance curve for every point of the image.27 From these force–distance curves the topography is determined by the extension of the piezo controlling the cantilever height when reaching a predefined setpoint. The adhesion refers to the pull-off force occurring when the cantilever is retracted from the sample. Fig. 4 presents SFM images of differently sized gold nanoparticles immobilized on silanized glass, both uncoated and coated with magnesium fluoride (Fig. 4a–l). In the respective left column of each part of the figure, height images are displayed; in the right columns, adhesion images are shown. As a control, silanized glass without gold nanoparticles but coated with magnesium fluoride (Fig. 4m and n) was also investigated. The height images (left columns) show the topography of the samples and the distribution of the particles on the glass surface. The uncoated nanoparticles are clearly visible (Fig. 4a, e and i). The particles of all of the three size classes densely cover the surface and show a tendency to form a monolayer of small aggregates, in accord with our previous observations for silane-immobilized gold nanoparticles of this size range.5 In accord with the observations made in the SEM images (Fig. 3), the SFM images show that the number of immobilized gold nanoparticles per area drops with increasing size of the particles (Table 1). It was observed that, during immobilization the larger gold nanoparticles tend to form more aggregates on the glass surface than the smaller particles. Immobilized nanoparticles with a size of 26 nm in diameter are mostly well separated and stay as single particles, and some small aggregates are found (Fig. 3a and 4a). Gold nanoparticles with a size of 36 nm in diameter create more dimers, trimers and oligomers; however, single nanoparticles are also observed (Fig. 3d and 4e). The nanoparticles with a size of 47 nm in diameter are mostly aggregated; however, some single nanoparticles are also present on the glass surface (Fig. 4i). In the case of MgF2 coating (Fig. 4c, g and k), the particles still appear in the topography, but less clearly, indicating a rather smooth surfaced. In addition, the surface becomes textured due to the presence of the magnesium fluoride nanoparticles in the size of a couple of nanometres. The smoothing of the topography is illustrated in Fig. 5, where a comparison of the height profiles is shown, which were obtained for the uncoated and the coated samples prepared with gold nanoparticles with a size of 36 nm, corresponding to samples shown in Fig. 4e and g. The height profile of the coated sample (blue trace in Fig. 5) clearly shows a decrease in the average height variation compared to the uncoated sample (red trace in Fig. 5). The height difference is reduced when the particles are covered by MgF2, resulting in an overall flatter surface. The adhesion images in the right columns of Fig. 4 show the maximum negative deflection of the cantilever due to adhesive forces between the tip and the sample. Therefore, they allow to distinguish between different materials on the surface. Even though uncalibrated cantilevers were used, and the adhesion can only be compared within one respective image but not between images, several qualitative observations can be made. Specifically, on the adhesion images of the uncoated samples (Fig. 4b, f and j), two materials, silanized glass and gold nanoparticles, can be clearly differentiated. The nanoparticles show up as less adhesive spots that are allocated to the same positions where the height images show particles. In contrast, the adhesion images of the coated samples (Fig. 4d, h and l) are uniform and similar to the adhesion images of the control, magnesium fluoride on the glass (Fig. 4n). This indicates that the gold particles, also the larger ones, are fully covered by magnesium fluoride. In Table 1, the values for the RMS roughness calculated for each sample from the topography SFM images are summarized. The results indicate that the roughness decreases after the coating with magnesium fluoride. This suggests that the magnesium fluoride fills empty spaces around the gold nanoparticles, an observation that is supported by the SEM cross section images (Fig. 3) and the SFM adhesion images (Fig. 4) as well.
| Sample | Au NPs 26 nm | Au NPs 36 nm | Au NPs 47 nm | MgF2 | |||
|---|---|---|---|---|---|---|---|
| Uncoated | Coated | Uncoated | Coated | Uncoated | Coated | On glass | |
| a The amount of MgF2 coated gold nanoparticles was assumed the same as for uncoated particles. | |||||||
| AuNPs per surface area in μm2 | 838 | n.d.a | 345 | n.d.a | 238 | n.d.a | — |
| AuNPs' surface in nm2 per area in μm2 | 1.9 × 10⁶ | n.d.a | 1.4 × 10⁶ | n.d.a | 1.6 × 10⁶ | n.d.a | — |
| RMS roughness in nm | 9 | 3 | 11 | 4 | 18 | 10 | 1.2 |
| Average SERS enhancement | 3.0 × 10⁴ | 1.0 × 10⁴ | 2.0 × 10⁵ | 1.7 × 10⁵ | 7.0 × 10⁵ | 5.3 × 10⁵ | — |
| Maximum SERS enhancement | 6.3 × 10⁴ | 2.8 × 10⁴ | 2.8 × 10⁵ | 3.6 × 10⁵ | 1.2 × 10⁶ | 1.2 × 10⁶ | — |
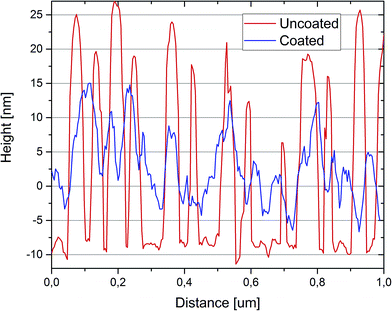 | ||
| Fig. 5 Height profiles of an MgF2 coated (blue trace) and an uncoated sample (red trace) of gold nanoparticles with a nominal height of 36 nm. | ||
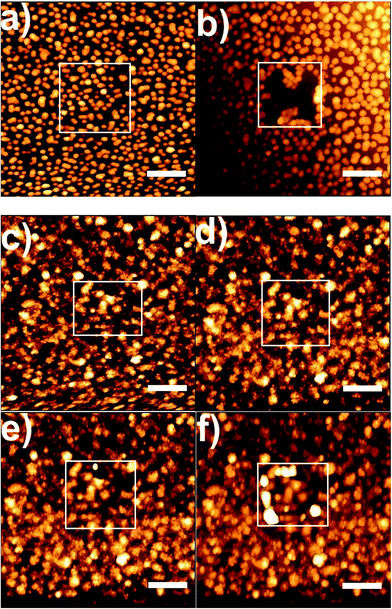
In order to investigate the mechanical stability of uncoated gold nanoparticles and MON, SFM scratch experiments were performed. After imaging the topography in quantitative imaging mode (Fig. 6a), a small area was scratched by imaging this area in contact mode with the feedback controlling the SFM cantilever height reduced to a minimum. The applied force was varied between 5 nN and 100 nN. Further topography images were taken after each scratch in quantitative imaging mode. Fig. 6b shows that applying a 5 nN force is sufficient to remove uncoated immobilized gold nanoparticles from the glass surface. The particles are moved by the SFM tip and pushed to the rim of the scratched area. The same experiment was repeated for a MON sample (Fig. 6c and d) and no changes were observed (Fig. 6d). When the applied force was gradually increased (Fig. 6e and f), damages of the magnesium fluoride layer were observed when a 100 nN force was applied (Fig. 6f). However, also in this case, the gold nanoparticles are still attached to the glass surface. These results provide evidence that the coating with magnesium fluoride significantly increases the mechanical stability of the plasmonic substrate, in accordance with previous observations,19 making it superior to other kinds of gold nanostructures that are immobilized on glass surfaces.5,6
To follow possible changes to the localized surface plasmon resonance(s), absorbance spectra were taken after different steps of the fabrication process. The spectra shown in Fig. 7 provide information about the plasmonic properties of the nanoparticles before and after the immobilization process. Immobilization, as well as the coating procedure have an influence on the optical properties of the nanoparticles of a MON. Based on the UV/Vis spectra, aggregation of the spherical nanoparticles, and also the influence of the magnesium fluoride coating of the gold nanoparticles was studied. Sharp plasmon bands with a single absorbance maximum at 524 nm, 527 nm and 531 nm, respectively for the freshly prepared nanoparticles were observed for the solutions of the different sized nanoparticles (black spectra in Fig. 7). The narrow bands indicate a high monodispersity of the nanoparticles,28 in accord with the TEM measurements (Fig. 2). No absorbance is observed at higher wavelength, therefore one can assume that no aggregates are present in the solution (black traces in Fig. 7). In contrast, all UV-Vis spectra of the immobilized and uncoated samples (red spectra in Fig. 7) display two additional bands at 611 nm and 686 nm, at 624 nm and 729 nm, and at 627 nm and 742 nm, respectively. The two additional bands indicate the presence of different, distinct kinds of nanoparticle aggregates, and a diminished contribution from the band that is caused by the isolated nanoparticles in solution (compare the red and the black traces in all panels of Fig. 7). This is in good agreement with the observations made by SFM (Fig. 4a, e, and i), and with previous work.5 In addition, all immobilized particles exhibit a very wide plasmon band extending far into the NIR range (red spectra in Fig. 7). After coating with magnesium fluoride, the sharp maxima of the plasmon bands are shifted to longer wavelengths due to changes of the refractive index of the surrounding medium of the particles (blue spectra in Fig. 7). Especially in the larger nanoparticles (Fig. 7b and c), the band is much wider. This indicates that the properties of the aggregated particles change, providing high absorbance values in the NIR range. The broadening of the two sharp additional bands of the immobilized nanoparticles upon MgF2 coating, especially in the cases of the larger nanoparticles (Fig. 7b and c, compare red and blue traces) is indicative of the presence of a larger variety of nanoparticle aggregates than in the uncoated samples. The widely extended absorbance makes the MON surfaces favourable plasmonic substrates for applications covering a broad wavelength range from the visible to the NIR.
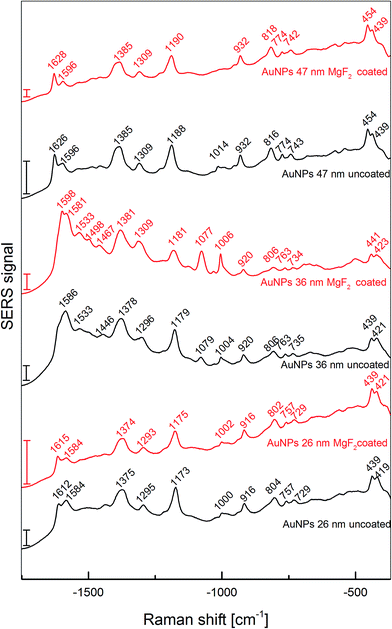
To estimate the enhancement factors of the new substrates and to obtain information on the influence of the different size of the nanoparticles and the magnesium fluoride layer in surface-enhanced Raman scattering (SERS), Raman experiments were carried out using crystal violet as analyte molecule, at an excitation wavelength of 633 nm. Thereby, an enhancement factor can be determined with a reference (pre-resonant) Raman experiment that is performed under identical conditions as the SERS experiment.29 On each sample, two to four different areas were scanned using a Raman microscope, and homogeneity of the enhancement was assessed by analyzing 50–100 individual spectra. In Fig. 8, averaged spectra from all measured spots are displayed. All spectra display signals that are characteristic of crystal violet are found in the spectra, assignments are provided in Table 2. Since the thickness of the MgF2 coating does not enable electromagnetic enhancement of the Raman scattering of molecules on top of the MgF2, it can be concluded that due to the porosity of the magnesium fluoride layer the analyte molecules can diffuse to the surface of the gold nanoparticles. Some small changes can be observed in the SERS spectra of crystal violet measured on the coated particles compared to uncoated ones. Specifically, some bands in the spectrum of the coated nanoparticles 36 nm in diameter are sharper and more pronounced that in the uncoated sample (Fig. 8, red spectrum in the middle), e.g. the ring breathing mode at 1006 cm−1, or the band at 1598 cm−1, assigned to a ring C–C stretching vibration. This might be caused by a slightly changed interaction of the crystal violet molecules with the gold nanoparticle surface, and/or the different possibilities for the molecules to access the gold nanoparticle surface on the coated substrate. Nevertheless, the qualitative differences between the MgF2 coated nanoparticles and the uncoated nanoparticles are much less pronounced than the differences observed for the coated or uncoated nanoparticles of different sizes. The qualitative differences of the spectra obtained with nanoparticles of different sizes can be discussed in the context of the different surface properties of the nanoparticles on the respective substrates (see SFM images in Fig. 4a, e, and i and Table 1), probably caused during the immobilization procedure. As indicated in Table 1, even though the number of nanoparticles per surface area differs, the resulting available surface area of the gold nanoparticles is very similar. Therefore, the differences in the spectra are not caused by different surface concentration of the crystal violet molecules, but due to their different interaction with the gold nanoparticle surface, which is almost not altered by the MgF2 coating.
![[thin space (1/6-em)]](https://www.rsc.org/images/entities/char_2009.gif) a
a
| Au NPs 26 nm | Au NPs 36 nm | Au NPs 47 nm | Tentative assignments | |||
|---|---|---|---|---|---|---|
| Uncoated | Coated | Uncoated | Coated | Uncoated | Coated | |
| a Abbreviations: ν, stretching (s, symmetric; as, asymmetric); δ, bending; γ, out-of-plane deformation (with respect to the benzene ring). | ||||||
| 1612 | 1615 | 1611 | 1598 | 1626 | 1628 | ν(CringC) |
| 1584 | 1584 | 1586 | 1581 | 1596 | 1596 | ν(CringC) |
| 1533 | 1533 | ν(CringN)/δs(CH3) | ||||
| 1500 | 1498 | δas(CH3) | ||||
| 1438 | 1446 | 1467 | δas(CH3) | |||
| 1375 | 1374 | 1378 | 1381 | 1385 | 1385 | δ(CH)/δs(CH3)/δ(CCC)ring |
| 1295 | 1293 | 1296 | 1309 | 1309 | 1309 | νas(CCcenterC)/δ(CCC)ring/δ(CH) |
| 1173 | 1175 | 1179 | 1181 | 1188 | 1190 | νas(CCcenterC) |
| 1079 | 1077 | δ(CCcenterC)/ν(CN) | ||||
| 1000 | 1002 | 1004 | 1006 | 1014 | δ(CCC) | |
| 916 | 916 | 920 | 920 | 932 | 932 | δ(CCcenterC) |
| 804 | 802 | 806 | 806 | 816 | 818 | γ(CringH) |
| 757 | 757 | 763 | 763 | 774 | 774 | νs(CCcenterC)/ν(CN) |
| 729 | 729 | 735 | 734 | 743 | 742 | ν(CN) |
| 439 | 439 | 439 | 441 | 454 | 454 | δ(CNC) |
| 419 | 421 | 421 | 423 | 439 | 439 | δ(CNC)/δ(CCcenterC) |
In order to compare the SERS performance of the different substrates, enhancement factors were estimated according to
 | (1) |
Enhancement factors of 104 for the 26 nm sized particles and up to 7 × 10⁵ for the larger nanoparticles were found (Table 1). These enhancement factors are slightly lower than the enhancement factors previously estimated for gold nanoparticles immobilized on glass using the same linker. As Table 1 shows, coating with magnesium fluoride results only in a slight decrease of the enhancement factor. This supports as well that the molecules have almost free access to the gold surface, and that the coating by magnesium fluoride described here does not significantly change the enhancement in a SERS experiment.
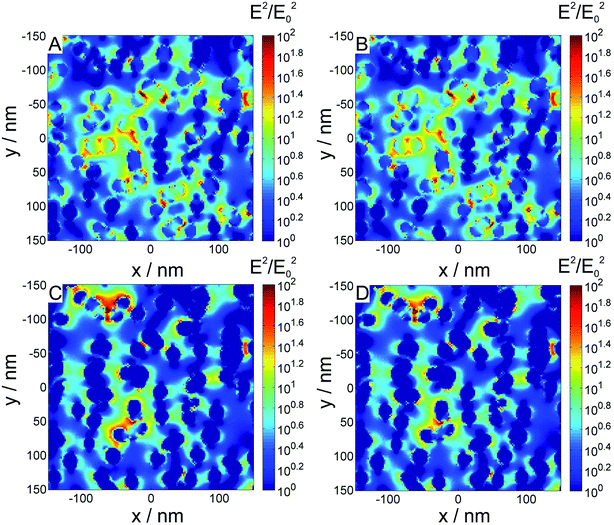
The substrates containing gold nanoparticles of 47 nm in diameter exhibit the highest enhancement factor, however, comparing the maximum enhancement that can be reached with the average enhancement, microscopic homogeneity is smaller than that obtained with the other samples. This was also supported by the comparison of a larger number of AFM images, revealing a slightly uneven distribution of the nanoparticles. On the other hand, the sample, containing the small nanoparticles 26 nm in diameter, displays very homogenous enhancement, however, with smaller enhancement factor (Table 1). With the sample 36 nm gold nanoparticles, high enhancement factors at high homogeneity of the enhancement can be achieved. To obtain more information on the influence of the magnesium fluoride layer on the electric field intensity distribution around the gold nanoparticles, we compared results from 3D finite-difference time domain (FDTD) simulations of characteristic nanoparticle configurations observed in the electron micrographs with and without a magnesium fluoride layer. An example geometry, based on SFM data is shown in Fig. 9. Fig. 9A and B show the electric field intensity distribution of 26 nm sized gold nanoparticles immobilized on glass uncoated and coated with a simulated 30 nm thick magnesium fluoride layer, respectively, excited at 633 nm, the same wavelength that was used as excitation wavelength in the SERS experiments in Fig. 8. The electric field is enhanced by a factor of ∼102. Assuming that the Raman scattered light is enhanced by the same factor, this would result in an enhancement factor of ∼104 in the SERS experiment, which is in good agreement with our experimental results (see Table 1). The comparison of the electric field of the coated and uncoated samples indicates that no differences both in the magnitude and the distribution of the field intensity occur upon magnesium fluoride coating. As discussed above, the gold nanoparticles on the substrates exhibit significant absorbance in the near infrared region. Therefore, we also performed simulations on the same structures with an excitation wavelength of 1064 nm. The results are shown in Fig. 9C and D. With near infrared excitation, enhancement of the electric field of the same order of magnitude can be observed. In the map it can be seen that the distribution of spots of high field enhancement differs from the distribution with excitation at 633 nm, and that different positions on the substrate would lead to high enhancement. Since the usual spot sizes on such a substrate in a typical microscopic application will at best be an average of an area displayed in Fig. 9, the difference in nanoscopic positioning of the high field intensity is not relevant, and the substrate is equally well-suited for SERS experiments in the near infrared. In spite of the low Raman scattering signals at long wavelengths, such experiments can be of particular interest in investigations of biological samples, and in experiments with two-photon excitation.31
Conclusions
A plasmonic substrate consisting of a magnesium fluoride layer-over-gold nanoparticles (MON) was successfully obtained by immobilization of gold nanoparticles on glass surfaces and dip coating with magnesium fluoride. The approach resulted in a high nanoscopic homogeneity of the gold nanoparticle distribution, and high stability of the presented material. SFM based quantitative imaging showed the successful immobilization of gold nanoparticles of different sizes. Nanoparticles tend to pack densely on the surface. Even though the nanoparticles form smaller planar aggregates, stacking of particles to multilayers was almost never observed. The MgF2 is found in between the particles as well as covers them.Applying magnesium fluoride as protective layer increases the mechanical stability of the substrate. Apart from the ease of the preparation procedure, the advantage of magnesium fluoride coating over coating with other metal oxides is its wide optical window, which allows for observations across the UV-Vis and NIR range. In particular, by embedding the gold nanoparticles in the magnesium fluoride layer, their plasmonic properties become more favourable for enhancement of optical processes excited in the near-infrared. As demonstrated by the experimental determination of the local field enhancement in SERS experiments and corresponding theoretical considerations, enhancement factors that allow for analytical applications are obtained. The magnesium fluoride layer has almost no influence on the enhancement nor on the qualitative properties of the spectra, that indicate a direct interaction of the analyte molecules with the gold surfaces. Future applications will benefit from the potential to implement additional selectivity of the protective coating due to our ability to easily control its porosity.16
Acknowledgements
Funding by DFG GSC 1013 SALSA is gratefully acknowledged. V. M. and J. K. acknowledge funding by ERC grant No. 259432 MULTIBIOPHOT. V. R. and J. P. R. acknowledge DFG funding through CRC 765. The authors thank Prof. Nicola Pinna (HU) and Dr Guylhaine Clavel for supporting TEM measurements.Notes and references
- B. Sharma, R. R. Frontiera, A. I. Henry, E. Ringe and R. P. Van Duyne, Mater. Today, 2012, 15, 16–25 CrossRef CAS.
- A. X. Wang and X. M. Kong, Materials, 2015, 8, 3024–3052 CrossRef PubMed.
- G. Chumanov, K. Sokolov, B. W. Gregory and T. M. Cotton, J. Phys. Chem., 1995, 99, 9466–9471 CrossRef CAS.
- K. C. Grabar, R. G. Freeman, M. B. Hommer and M. J. Natan, Anal. Chem., 1995, 67, 735–743 CrossRef CAS.
- V. Joseph, M. Gensler, S. Seifert, U. Gernert, J. P. Rabe and J. Kneipp, J. Phys. Chem. C, 2012, 116, 6859–6865 CAS.
- V. Joseph, C. Engelbrekt, J. D. Zhang, U. Gernert, J. Ulstrup and J. Kneipp, Angew. Chem., Int. Ed., 2012, 51, 7592–7596 CrossRef CAS PubMed.
- L. M. Liz-Marzan and P. Mulvaney, J. Phys. Chem. B, 2003, 107, 7312–7326 CrossRef CAS.
- S. S. Hinman, C. Y. Chen, J. C. Duan and Q. Cheng, Nanoscale, 2016, 8, 1665–1675 RSC.
- A. Ceja-Fdez, T. Lopez-Luke, A. Torres-Castro, D. A. Wheeler, J. Z. Zhang and E. De la Rosa, RSC Adv., 2014, 4, 59233–59241 CAS.
- W. E. Doering and S. M. Nie, Anal. Chem., 2003, 75, 6171–6176 CrossRef CAS PubMed.
- K. Ouhenia-Ouadahi, R. Yasukuni, P. Yu, G. Laurent, C. Pavageau, J. Grand, J. Guerin, A. Leaustic, N. Felidj, J. Aubard, K. Nakatani and R. Metivier, Chem. Commun., 2014, 50, 7299–7302 RSC.
- F. Mazzotta, T. W. Johnson, A. B. Dahlin, J. Shaver, S. H. Oh and F. Hook, ACS Photonics, 2015, 2, 256–262 CrossRef CAS.
- C. J. Wang, P. R. Ohodnicki, X. Su, M. Keller, T. D. Brown and J. P. Baltrus, Nanoscale, 2015, 7, 2527–2535 RSC.
- X. Z. Li, Y. Y. Fang, Y. P. Hu, H. F. Huo, S. L. Zhao, X. F. Long, J. T. Ma and R. Li, RSC Adv., 2015, 5, 69962–69969 RSC.
- H. Y. Lin, C. T. Chen and Y. C. Chen, Anal. Chem., 2006, 78, 6873–6878 CrossRef CAS PubMed.
- K. Scheurell, E. Kemnitz, P. Garcia-Juan, J. Eicher, B. Lintner, J. Hegmann, R. Jahn, T. Hofmann and P. Lobmann, J. Sol-Gel Sci. Technol., 2015, 76, 82–89 CrossRef CAS.
- K. Scheurell, J. Noack, R. Konig, J. Hegmann, R. Jahn, T. Hofmann, P. Lobmann, B. Lintner, P. Garcia-Juan, J. Eicher and E. Kemnitz, Dalton Trans., 2015, 44, 19501–19508 RSC.
- T. Krahl, D. Brosske, K. Scheurell, B. Lintner and E. Kemnitz, J. Mater. Chem. C, 2016, 4, 1454–1466 RSC.
- J. Noack, C. Fritz, C. Flugel, F. Hemmann, H. J. Glasel, O. Kahle, C. Dreyer, M. Bauer and E. Kemnitz, Dalton Trans., 2013, 42, 5706–5710 RSC.
- P. H. Lissberg and R. G. Nelson, Thin Solid Films, 1974, 21, 159–172 CrossRef.
- T. Yamaguchi, R. Chauvaux and V. V. Truong, Phys. Stat. Mech. Appl., 1989, 157, 423–427 CrossRef CAS.
- N. G. Bastús, J. Comenge and V. Puntes, Langmuir, 2011, 27, 11098–11105 CrossRef PubMed.
- J. K. Murthy, U. Gross, S. Rudiger, E. Kemnitz and J. M. Winfield, J. Solid State Chem., 2006, 179, 739–746 CrossRef.
- J. L. Hutter and J. Bechhoefer, Rev. Sci. Instrum., 1993, 64, 1868–1873 CrossRef CAS.
- R. A. Johnson, Phys. Rev. B: Condens. Matter Mater. Phys., 1972, 6, 2094–2100 CrossRef.
- K. J. Seu, A. P. Pandey, F. Haque, E. A. Proctor, A. E. Ribbe and J. S. Hovis, Biophys. J., 2007, 92, 2445–2450 CrossRef CAS PubMed.
- M. Pfreundschuh, D. Martinez-Martin, E. Mulvihill, S. Wegmann and D. J. Muller, Nat. Protoc., 2014, 9, 1113–1130 CrossRef CAS PubMed.
- X. H. Ji, X. N. Song, J. Li, Y. B. Bai, W. S. Yang and X. G. Peng, J. Am. Chem. Soc., 2007, 129, 13939–13948 CrossRef CAS PubMed.
- V. Joseph, A. Matschulat, J. Polte, S. Rolf, F. Emmerling and J. Kneipp, J. Raman Spectrosc., 2011, 42, 1736–1742 CrossRef CAS.
- A. Kudelski, Chem. Phys. Lett., 2005, 414, 271–275 CrossRef CAS.
- M. Guhlke, Z. Heiner and J. Kneipp, Phys. Chem. Chem. Phys., 2015, 17, 26093–26100 RSC.
- M. V. Canamares, C. Chenal, R. L. Birke and J. R. Lombardi, J. Phys. Chem. C, 2008, 112, 20295–20300 Search PubMed.
- E. J. Liang, X. L. Ye and W. Kiefer, J. Phys. Chem. A, 1997, 101, 7330–7335 CrossRef CAS.
| This journal is © The Royal Society of Chemistry 2016 |

