UV-visible and near-infrared active NaGdF4:Yb:Er/Ag/TiO2 nanocomposite for enhanced photocatalytic applications

Natarajan Prakasha, Dheivasigamani Thangarajub, Rajan Karthikeyana, Mukannan Arivanandhanc, Yosuke Shimurab and Yasuhiro Hayakawa*ab
aGraduate School of Science and Technology, Shizuoka University, 3-5-1 Johoku, Naka-ku, Hamamatsu, Shizuoka 432-8011, Japan. E-mail: royhaya@ipc.shizuoka.ac.jp; Fax: +81 53 478 1310; Tel: +81 53 478 1310
bResearch Institute of Electronics, Shizuoka University, 3-5-1 Johoku, Naka-ku, Hamamatsu, Shizuoka 432-8011, Japan
cCenter for Nanoscience and Technology, Anna University, Chennai 600 025, Tamil Nadu, India

Received 20th April 2016 , Accepted 10th August 2016

First published on 10th August 2016


Abstract

A near infra-red (NIR) active NaGdF4:Yb:Er/Ag/TiO2 nanocomposite photocatalyst was successfully synthesized by a one-pot thermal decomposition method. The composite structure, morphology and elemental mapping of the synthesized NaGdF4:Yb:Er/Ag/TiO2 nanocomposite were characterized by X-ray diffraction and transmission electron microscopy analysis. The energy transfer among NaGdF4:Yb:Er, Ag, and TiO2 was revealed by upconversion photoluminescence measurements at 980 nm. The Ag and NaGdF4 nanoparticles enhanced the visible and NIR light absorption property of the NaGdF4:Yb:Er/Ag/TiO2 nanocomposite. The NIR and UV-visible light induced photocatalytic study of the NaGdF4:Yb:Er/Ag/TiO2 composite was examined by rhodamine B degradation. The energy transfer among NaGdF4:Yb:Er, Ag, and TiO2 significantly influenced the photocatalytic activity under NIR irradiation. The catalysts produced oxidative species during NIR irradiation, which are responsible for the photocatalytic degradation of rhodamine B. NaGdF4:Yb:Er/Ag/TiO2 showed photocatalytic activity under NIR and UV-visible radiation (full solar irradiation), which is superior to a UV or visible light active photocatalyst. The study provided a UV-visible and NIR-responsive photocatalyst and its energy transfer mechanism.

1. Introduction

An increasing world population leads to increased environmental pollution and energy deficits. Photocatalysis is a promising technology that can help solve environmental problems since it utilizes abundant and cheap solar energy.1–3 TiO2 is one of the best photocatalysts because of its outstanding physical and chemical properties, such as high oxidative power, chemical and photostability, biocompatible nature and cheap commercial availability.4–7 The UV light active TiO2 (3.2 eV) only utilizes 5% of sunlight. Therefore, there is still a huge amount of energy (visible light 49%, near infra-red (NIR) 46%) available in the sunlight that is not harvested by TiO2.8,9 Numerous strategies have attempted to extend the utilization of sunlight, such as doping,10–12 noble metal deposition,13 dye sensitizing,14 and mixed semiconductor composites.15–17 However, complete absorption of the solar spectrum has not been achieved yet. The modifications for shifting the absorption edge of TiO2 up to the visible light region (up to 725 nm) have been done, but the NIR light is still not used.18,19 Researchers face numerous challenges in developing an ideal catalyst that is active over the entire solar light region without losing its photocatalytic efficiency.

Semiconductor catalysts with upconversion luminescence are paving a path to utilize NIR light for photo-catalytic applications.20,21 The upconversion phosphor emits high energy light (visible and UV light) by NIR light (980 nm) excitation via a nonlinear process.22 The direct doping of upconversion ions (Tm, Er, Yb/Tm, Yb/Er) on semiconductor catalysts has not shown efficient conversion.23–25 Qin et al. initially reported a TiO2 coated YF3:Yb:Tm host for photodegradation of methylene blue under NIR irradiation.26 There are limited papers on upconversion based NIR photocatalysis.27–29 Tang et al. investigated NaYF4:Yb3+,Tm3+@TiO2 core–shell structures for methylene blue degradation and discussed the energy transfer mechanism under NIR irradiation.30 The structure only utilizes the UV and NIR light, and the visible light is unused. The visible light photocatalytic activity of NaYF4:Yb3+,Tm3+/TiO2 was improved by linking CdS nanostructures.31 The selection of the host lattice, upconversion doping ions and photocatalyst are important to design a full solar light spectrum active photocatalyst. Fluoride-based phosphors, such as NaGdF4,32 NaYF4,33 YF3,26 and CaF2,34 are reported to be efficient hosts for upconversion ion doping because of their low phonon energy, high luminous intensity, and excellent chemical stability. NaGdF4-based upconversion phosphors have drawn attention because of their bright upconversion luminescence emissions along with their magnetic property, which allows for separation of the particles magnetically.35,36

The doped Yb absorbs the NIR excitation and transfers the energy non-radioactively to co-dopants such as Er3+, Tm3+ and Ho3+.36,37 The dopants are excited during the two-photon or multi-photon process and de-excite to the ground state with high energy light emission. The photocatalytic reaction could be initiated by absorbing the emitted light from upconversion particles through an appropriate semiconductor composite.31 Yb3+–Tm3+ upconversion ions are mainly used as a dopant in the NIR driven rare earth fluorides/TiO2 composite photocatalysts since they emit UV light under NIR excitation.30 The energy transfer process activates the photocatalytic reaction on the catalyst surface (TiO2). However, visible light conversion from NIR light involves fewer anti-stoke shifts, which is more profitable than UV light conversion from NIR light.29 Yb3+–Er3+ ions are a promising dopant for visible light emission, which emits visible light (650, 540, 520 nm) upon NIR excitation.38,39

On the other hand, nano Ag shows a size dependable surface plasmon resonance (SPR) absorption property in the visible region that presents a new prospect to overcome the limitation of visible light absorption of the photocatalysts.40 A collective oscillation of free electrons in the plasmonic Ag structure produces a strong light absorption, and it can generate strong electric fields near the surface.41 These properties can be useful for photocatalytic reactions. Surface plasmon sensitized Ag photocatalysts showed promising photocatalytic activity in the visible light region.42–46 The absorption range of Ag lies on the emission position of the upconversion phosphor, and it enhances the local field, which results in an enhancement of the energy transfer from Yb3+ to Er3+.47,48 Therefore, Ag can be used to absorb the emitted visible light from the upconversion phosphor and transfer electrons to the semiconductor catalyst. Xu et al. studied plasmonic Au based NaYF4:Yb3+,Tm3+,Er3+/TiO2 NIR photocatalysts for complete solar utilization.49 Ma et al. utilized Ag in a NIR responsive NaYF4:Yb,Tm@TiO2 catalyst to enhance electron–hole pair separation.50 However, plasmonic silver utilization with an upconversion phosphor has not been demonstrated yet. The fabrication of a lanthanide doped upconverting phosphor, Ag and TiO2 in a single system may allow for the effective consumption of UV, visible and NIR light for photocatalytic purposes via plasmonic and upconversion properties.

In this work, an NIR active NaGdF4:Yb:Er/Ag/TiO2 nanocomposite catalyst was synthesized by a one-pot thermal decomposition method. The structural, morphological and energy transfer processes of NaGdF4:Yb:Er/Ag/TiO2 were investigated and compared with the NaGdF4:Yb:Er/Ag, NaGdF4:Yb:Er/TiO2 composites, which were synthesized by a similar procedure. The photocatalytic activities of the synthesized nanocomposite catalysts were evaluated by rhodamine B dye degradation experiments under NIR light (980 nm) and UV-visible light (300–600 nm). The possible photocatalytic reaction pathways were discussed. In this method, the nano-scaled (less than 25 nm) upconversion host (NaGdF4) and Ag particles were synthesized, which increased the surface contact among the NaGdF4, Ag, and TiO2 particles. The upconverting host and Ag nanoparticles were in close contact with each other as well as TiO2, which is the major advantage of this structure. This structure allows for efficient charge and/or energy transfer among NaGdF4:Yb:Er, Ag and TiO2 particles and enhances the plasmonic and upconversion phenomenon in the photocatalytic reaction. The synthesized catalyst would effectively use all the spectrum regions of solar light.

2. Experimental

2.1 Materials

Titanium(IV) isopropoxide (Ti(OCH(CH3)2)4, 95%, Wako), silver nitrate (AgNO3, Wako), oleylamine (C18H35NH2, 70%, Wako), gadolinium oxide (Gd2O3, 99.9%, Wako), ytterbium oxide (Yb2O3, 99.9%, Wako), erbium oxide (Er2O3, 99.9%, Wako), sodium trifluoroacetate (CF3COONa, 98%, Wako), and trifluoro acetic acid (C2HF3O2, 99%, Wako) were used as precursors. All the oxides were dissolved in trifluoro acetic acid to form trifluoroacetate, which was dried at 80 °C and preserved in an airtight glass bottle. Chemicals such as ammonia (28%, Wako), acetone (99.5%, Wako), cyclohexane (99.5%, Wako) and ethanol (99.5%, Wako) were used as purchased. The photocatalytic activity of the catalyst was studied using rhodamine B (C28H31ClN2O3, Wako) as a model pollutant.

2.2 Synthesis of NaGdF4:Yb:Er/Ag/TiO2 composite nanomaterials

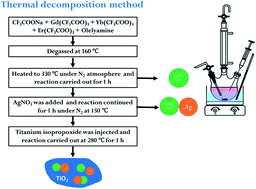
The NaGdF4:Yb:Er/Ag/TiO2 nanocomposite was synthesized by a high-temperature thermal decomposition method. The schematic diagram of the synthesis procedure is shown in Fig. 1. The precursors for NaGdF4, such as CF3COONa (6 mmol), Gd(CF3COO)3 (2.34 mmol), Yb(CF3COO)3 (0.6 mmol) and Er(CF3COO)3 (0.06 mmol), were dissolved in 15 mL of oleylamine solvent in a round bottom (RB) flask (100 mL) attached to a cooling condenser. The RB flask was evacuated with a vacuum pump and the reaction temperature was raised to 160 °C. The reaction was kept at 160 °C for 30 min to remove moisture and O2 in the oleylamine. The reaction solution was raised to 330 °C to initiate the decomposition of the precursors. The reaction was carried out for 1 h at 330 °C under a N2 flow. The resultant product was cooled to 50 °C, and silver nitrate (2 mmol) was added to the NaGdF4:Yb:Er–oleylamine solution. The reaction temperature was increased to 150 °C and kept there for 1 h under a N2 atmosphere to obtain the NaGdF4:Yb:Er/Ag composite. The reaction solution colour turned red, indicating the formation of the Ag particles. To the resultant solution, 3 mL of titanium isopropoxide was added, and the temperature of the solution was raised to 280 °C and kept there for 1 h under air atmosphere. The resulting NaGdF4:Yb:Er/Ag/TiO2 composite solution was cooled to room temperature. The sample was precipitated, centrifuged and thoroughly washed several times with hexane, acetone and ethanol solvents. The NaGdF4:Yb:Er/Ag and NaGdF4:Yb:Er/TiO2 composites were synthesized by the same procedure for the comparison of luminescence and for catalytic activity studies. The synthesized NaGdF4:Yb:Er/Ag/TiO2 catalyst was dissolved in 20 mL of an ammonia and ethanol mixed solution (50 mL/50 mL) and stirred for 30 min to remove the surface oleylamine. The reaction mixture was centrifuged at 6000 rpm, and the sample was re-dispersed in 20 mL of an ammonia/ethanol solution. The procedure was repeated four times, and the obtained product was washed with water until the pH was 7. The sample was dried and used for photocatalytic studies.
image file: c6ra10208e-f1.tif
Fig. 1 Schematic diagram of the synthesis of β-NaGdF4:Yb:Er/Ag/TiO2 nanocomposites.

2.3 Photocatalytic degradation of rhodamine B

The photocatalytic performance of the NaGdF4:Yb:Er/Ag/TiO2 nanocomposite was evaluated by monitoring the degradation of rhodamine B dye molecules under NIR irradiation. The photocatalytic experiment was as follows: 8 mg of synthesized catalyst were suspended in a 5 mL of rhodamine B (5 mg L−1) solution and stirred for 1 h in the dark to reach the adsorption–desorption equilibrium of the dye with the catalyst before irradiation. The rhodamine B solution was irradiated with a 980 nm NIR source (1.5 W), and 1.5 mL of solution were taken out from the reaction mixture at constant time intervals (3 h). The absorbance of rhodamine B was monitored at 554 nm using a UV-vis spectrophotometer, and the solution was put back into the cell. To evaluate UV-visible light driven photocatalytic activity, 40 mg of catalyst were added into a lab-made borosilicate reactor containing 40 mL of a rhodamine B solution (5 mg L−1). The solution was illuminated with a UV-visible light source (500 W, 300–600 nm), and 3 mL samples of the suspension were withdrawn from the reaction mixture at regular irradiation time intervals. The suspension was centrifuged to remove the catalysts, and the absorbance was measured.

2.4 Characterization

The crystal structures of the synthesized composite catalysts were identified by powder X-ray diffraction (XRD) using a Rigaku X-ray diffractometer RINT-2200 (Cu Kα radiation, λ = 1.54178 Å). JEOL JEM 2100F HRTEM (200 kV acceleration voltage) was used for the transmission electron microscope (TEM), energy dispersive X-ray spectroscopy (EDX) and mapping images. The oxidation states of the catalyst were analyzed with X-ray photoelectron spectroscopy (XPS) (ESCA 3100, Shimadzu). Diffuse reflectance spectra (DRS) and ultraviolet-visible absorption spectra were analyzed by a UV-VIS-NIR spectrophotometer (JascoV-670). Photoluminescence (PL) spectra were recorded in the range of 350–850 nm using a fluorescence spectrophotometer (Jasco FP-8600). Photocatalytic measurements were performed using a UV-visible light source (MAX 303, Asahi, Japan) and 980 nm continuous NIR laser from Changchun New Industries Optoelectronics Technology Co., Ltd.

3. Results and discussion

3.1 Structural, morphological and elemental studies

The crystal phases of the synthesized NaGdF4:Yb:Er, NaGdF4:Yb:Er/Ag and NaGdF4:Yb:Er/Ag/TiO2 samples were identified by XRD analysis. The acquired patterns of NaGdF4:Yb:Er, NaGdF4:Yb:Er/Ag and NaGdF4:Yb:Er/Ag/TiO2 are compared in Fig. 2. The recorded reflections of NaGdF4:Yb:Er (Fig. 2a) matched well with the hexagonal crystal structure of NaGdF4 (JCPDS card no. 27-0699). A low intense peak appeared at 28.2° (●) and corresponded to the cubic crystalline nature of NaGdF4 (JCPDS card no. 27-0697), which indicated a small amount of cubic phase was present in the sample. When Ag is added, the characteristic Ag peaks appeared at 38.2°, 44.3°, and 64.4°, which corresponded to the (111), (200), and (220) planes of the face centred-cubic structure of silver particles (JCPDS card no. 01-087-0720), which indicated the presence of metallic silver in the NaGdF4:Yb:Er/Ag composite (Fig. 2b). The XRD pattern of NaGdF4:Yb:Er/TiO2 shows anatase phase TiO2 peaks (JCPDS card no. 21-1272), which are marked by the lattice planes in Fig. 2c along with NaGdF4 reflections. The XRD peaks of NaGdF4, Ag and TiO2 were observed for NaGdF4:Yb:Er/Ag/TiO2, as shown in Fig. 2d, which confirmed the formation of the composites.
image file: c6ra10208e-f2.tif
Fig. 2 XRD patterns of (a) NaGdF4:Yb:Er, (b) NaGdF4:Yb:Er/Ag, (c) NaGdF4:Yb:Er/TiO2 and (d) NaGdF4:Yb:Er/Ag/TiO2.

The morphology and size of the nanocomposite were studied by TEM images and elemental mapping analysis. Fig. 3.1 shows the NaGdF4:Yb:Er particles that were about 10 nm in diameter. The NaGdF4:Yb:Er/Ag (Fig. 3.2) composites exhibited distinct Ag and NaGdF4 particles. TEM images of the NaGdF4:Yb:Er/Ag/TiO2 composite consisted of a foam-like structure with dispersed sphere-like particles (Fig. 3.3). The elemental mapping of individual elements Na, Gd, F, Yb, Ag, Ti, and O (Fig. 3.5b–h) showed the existence of NaGdF4:Yb:Er and Ag particles in the TiO2 foam-like structure. The elements were confirmed by an EDS spectrum, as shown in Fig. 3.5i. The elemental mapping of Gd (Fig. 3.5c) and Ag (Fig. 3.5f) displayed the spherical shaped NaGdF4:Yb:Er and Ag particles with diameters ranging between 8 and 20 nm. They were dispersed on the fine TiO2 grains. The over all sizes of the NaGdF4:Yb:Er/Ag/TiO2 nanocomposite particles were in the range of 100–200 nm. The spacing of the lattice fringes, 0.52, 0.23 and 0.35 nm (Fig. 3.4), indicated the (100), (111) and (101) planes of hexagonal NaGdF4, cubic Ag, and anatase TiO2, respectively. TEM and mapping suggested that NaGdF4 and Ag nanoparticles formed a composite structure with TiO2 particles.


image file: c6ra10208e-f3.tif
Fig. 3 TEM images of (1) NaGdF4:Yb:Er, (2) NaGdF4:Yb:Er/Ag, (3) and (4) NaGdF4:Yb:Er/Ag/TiO2; (5a) STEM image, EDS mappings of (b) Na, (c) Gd, (d) F, (e) Yb (f) Ag, (g) Ti, and (h) O and (i) EDS spectrum of NaGdF4:Yb:Er/Ag/TiO2 composite.

The chemical environment of the elements present in the NaGdF4:Yb:Er/Ag/TiO2 composite were analyzed using XPS analysis. The XPS spectrum of Ti 2p, O 1s, and Ag 3d orbitals are shown in Fig. 4a–c. The two peaks, Ti 2p3/2 and Ti 2p1/2, are positioned at 458.8 eV and 464.5 eV, respectively, and are attributed to the Ti4+ state of anatase TiO2. Surface disorders led to Ti3+ formation, which appeared at 457.3 eV. The asymmetric O 1s peak was deconvoluted into two peaks centered at 530.3 and 532.1 eV and are related to the lattice oxygen of TiO2 and the hydroxyl oxygen present on the surface, respectively. The two peaks, Ag 3d5/2 and Ag 3d3/2, separated by ∼6 eV were located at 367.9 and 373.9 eV and designated the metal state of the Ag particle. A small quantity of silver exists in an oxide form, which is observed around ∼367 eV. The F 1s peak of NaGdF4, NaGdF4:Yb:Er/Ag and NaGdF4:Yb:Er/Ag/TiO2 was studied and compared in Fig. 4d. The F 1s peaks in NaGdF4:Yb:Er/Ag (686.6 eV) and NaGdF4:Yb:Er/Ag/TiO2 (685.1 eV) were shifted from the F 1s peak of NaGdF4:Yb:Er at 686.0 eV. This suggested the chemisorption of the NaGdF4 particle with Ag and TiO2. The Yb 4d and Er 4d peaks (Fig. 4e) were observed at 172.6 eV and 188.4 eV, respectively, and well matched with reported values, confirming the doping on NaGdF4.51


image file: c6ra10208e-f4.tif
Fig. 4 XPS binding energy curves of NaGdF4:Yb:Er/Ag/TiO2, (a) Ti 2p, (b) O 1s, (c) Ag 3d, (d) F 1s, and (e) Yb 4d and Er 4d.

3.2 Optical studies

The optical properties of synthesized composite catalysts were analyzed by UV-visible absorption measurements and upconversion luminescence analysis. The recorded absorption spectra for NaGdF4:Yb:Er, NaGdF4:Yb:Er/Ag and NaGdF4:Yb:Er/Ag/TiO2 are shown in Fig. 5a. The absorption spectrum of NaGdF4:Yb:Er (black curve) showed small absorption peaks for Er3+ (488, 520, 540 and 653 nm). For NaGdF4:Yb:Er/Ag (red curve), a wide absorption peak (350–750 nm) was observed in the visible region, which corresponded to the localized surface plasmon resonance peak delivered by the Ag NPs. The absorption spectrum of NaGdF4:Yb:Er/Ag/TiO2 (blue curve) showed the wide absorption peaks of Ag combined with TiO2 absorption in the UV region.
image file: c6ra10208e-f5.tif
Fig. 5 (a) UV-vis-NIR absorption spectra, (b) upconversion luminescence spectra, (c) visual fluorescence emission images under 980 nm excitation of NaGdF4:Yb:Er, NaGdF4:Yb:Er/Ag and NaGdF4:Yb:Er/Ag/TiO2.

The upconversion luminescence spectra of as-synthesised NaGdF4:Yb:Er, NaGdF4:Yb:Er/Ag, NaGdF4:Yb:Er/TiO2 and NaGdF4:Yb:Er/Ag/TiO2 nanoparticles were studied under an excitation wavelength of 980 nm, as shown in Fig. 5b. The luminescence spectra showed four significant peaks at 523, 542, 656 and ∼800 nm, which corresponded to the transitions of 2H11/2, 4S3/2, 4F9/2 and 4I9/2 levels to the 4I15/2 level of Er3+, respectively.51–53 After addition of TiO2 to NaGdF4, the upconversion emission intensities decreased slightly because the excitation light was shielded by TiO2 particles on the surface of the NaGdF4:Yb:Er. The peak intensities of NaGdF4:Yb:Er/Ag and NaGdF4:Yb:Er/Ag/TiO2 drastically decreased because of silver and TiO2 addition to the NaGdF4:Yb:Er particles. Fig. 5c shows the visual emitting images of NaGdF4:Yb:Er, NaGdF4:Yb:Er/Ag and NaGdF4:Yb:Er/Ag/TiO2 excited by a NIR 980 nm laser. The brightness of the green light of NaGdF4:Yb:Er was reduced and turned to a weak red (4I9/24I15/2) upon the addition of Ag and TiO2. Ag particles induced a larger reduction in the green light emission than red light since the absorption maximum exactly matched the green light region. These observations can be explained by the schematic diagram shown in Fig. 6, which shows the photoluminescence and NIR light influenced photocatalytic reaction mechanism of the NaGdF4:Yb:Er/Ag/TiO2 composite. Upconversion phosphors can convert longer wavelength NIR radiation into shorter wavelength light (UV or visible light) through a two or multiphoton absorption mechanism.39,51 During the excitation of NaGdF4:Yb:Er under 980 nm by a NIR laser, the Yb3+ ion acts as a NIR sensitizer, which absorbs the photons (980 nm) and results in an electron excitation from the 2F7/2 to 2F5/2 level. The excited Yb3+ transports energy to the Er3+ ions during relaxation. The process induced excitation from 4I15/2 to 4I11/2 in the Er3+ ions. Two or more similarly excited photons were populated at higher energy levels of Er3+ (4F9/2, 4S3/2 and 2H11/2).29 The excited electrons of Er3+ relaxed to the ground state with the emission of visible light. The absorption range of the Ag overlaps the emitted visible light of NaGdF4:Yb:Er, which indicated that the emitted light from NaGdF4:Yb:Er could be recaptured by Ag. This reabsorption led to a strong decrease in luminescent intensity. TiO2 encapsulation over NaGdF4:Yb:Er/Ag led to a further decrease in intensity, indicating an energy transfer from the Ag to the TiO2 particles. A similar luminescent intensity reduction was observed and reported for NaGdF4:Yb:Er/Au and NaYF4:Yb:Er/C-doped TiO2 composites.29,48


image file: c6ra10208e-f6.tif
Fig. 6 Schematic diagram of energy transfer and photocatalytic mechanism among Yb, Er, Ag, TiO2 in the NaGdF4:Yb:Er/Ag/TiO2 nanocomposite catalyst.

3.3 Photocatalytic studies

Rhodamine B was utilized as a model pollutant to demonstrate the performance of the prepared catalysts under NIR irradiation (980 nm). Dye degradation (C/C0) was calculated from the initial absorbance (C0) and absorbance values (C) of rhodamine B at different intervals of time. The absorbance of rhodamine B decreased gradually because of the photocatalytic degradation reaction catalyzed by the NaGdF4:Yb:Er/Ag/TiO2 nanocomposites, as shown in Fig. 7. The time-dependent relative concentration ratios (C/C0) of rhodamine B were studied for NaGdF4:Yb:Er/Ag and NaGdF4:Yb:Er/Ag/TiO2, as shown in Fig. 8a. There is no degradation of rhodamine B in the absence of a catalyst with NIR irradiation. The C/C0 value against time revealed that NaGdF4:Yb:Er/Ag/TiO2 degraded 40% of rhodamine B under 18 h of NIR irradiation. However, the NaGdF4:Yb:Er/Ag was only able to degrade 21%. Generally, TiO2 and Ag were inactive in NIR light. In the case of NaGdF4:Yb:Er/Ag, the emitted upconversion light of NaGdF4:Yb:Er was recaptured by Ag particles and generated hot electrons and holes. In NaGdF4:Yb:Er/Ag/TiO2, the electrons of Ag obtained sufficient energy to overcome the Schottky barrier during surface plasmon excitation and transferred to the TiO2 surface by a charge transfer mechanism.54 Hence, the recombination of the photogenerated electron and hole pair was minimized significantly and improved the electron–hole pair separation in the Ag nanoparticles. Photogenerated holes in Ag particles play a vital role in oxidizing rhodamine B into oxidized products (CO2 and H2O). The electrons move to the conduction band of TiO2 and generate ˙O2 radicals, which are in turn converted to ˙OH radicals. The photogenerated ˙OH radicals (and ˙O2) actively oxidize the conjugated chromophore of the dye molecule. The ˙OH formation reactions are shown in eqn (1.1)–(1.5).
 
O2(TiO2) + e → ˙O2(TiO2) (1.1)
 
˙O2(TiO2) + H+ → HO2˙(TiO2) (1.2)
 
HO2˙ + HO2˙ → H2O2 + O2 (1.3)
 
H2O2 + O2˙ → ˙OH + OH + O2 (1.4)
 
h+(Ag) + RB → degraded or mineralized product (1.5)
 
˙OH (or O2˙) + RB → degraded or mineralized product (1.6)

image file: c6ra10208e-f7.tif
Fig. 7 NaGdF4:Yb:Er/Ag/TiO2 catalyzed degradation of rhodamine B at a constant irradiation time (3 h) under NIR irradiation (980 nm).

image file: c6ra10208e-f8.tif
Fig. 8 (a) Relative ratio (C/C0) of rhodamine B at different times catalyzed by NaGdF4:Yb:Er/Ag/TiO2 and NaGdF4:Yb:Er/Ag composites under NIR (980 nm) (b) terephthalic acid fluorescence spectra at different times catalyzed by NaGdF4:Yb:Er/Ag/TiO2 under NIR irradiation.

Fig. 8a shows that NaGdF4:Yb:Er/Ag/TiO2 showed a higher photocatalytic activity than the NaGdF4:Yb:Er/Ag. This confirmed that Ag acts as an intermediate carrier for the keen energy transfer between NaGdF4:Yb:Er and TiO2. For further confirmation, a terephthalic acid fluorescence probe test was carried out to identify the formation of oxidative ˙OH radicals on the surface of the nanocomposite during NIR irradiation.27,30 Fig. 8b shows the fluorescence spectra of hydroxy terephthalic acid monitored at 424 nm under 320 nm excitation. Terephthalic acid did not show any fluorescent emission, but the non-fluorescent terephthalic acid produced a fluorescent emission at 424 nm when it became hydroxyl terephthalic acid. NaGdF4:Yb:Er/Ag/TiO2 catalyzed the terephthalic acid photocatalytic reaction driven by NIR irradiation and produced the hydroxy terephthalic acid intermediate when exposed to 980 nm light. The gradual increment in the intensity over time confirmed the increasing concentration of hydroxy terephthalic acid. The intensity change means ˙OH radicals were generated during the reaction.

For further photocatalytic investigation, the photocatalytic degradation was performed under UV-visible light irradiation, and the results are shown in Fig. 9a–d. The absorption spectra of rhodamine B decreased gradually with NaGdF4:Yb:Er/TiO2 (a), NaGdF4:Yb:Er/Ag (b), and NaGdF4:Yb:Er/Ag/TiO2 (c) catalysts under UV-visible light irradiation. Two different degradation patterns were observed for the composite catalysts. The NaGdF4:Yb:Er/TiO2 catalysed photodegradation curves of rhodamine B hypsochromic shifted to a shorter wavelength (∼498 nm) during a 30 min irradiation; after that the absorption position did not change, but the absorption intensity decreased to nearly zero. The NaGdF4:Yb:Er/Ag and NaGdF4:Yb:Er/Ag/TiO2 catalysed reaction showed a traditional degradation pattern.55 The hypsochromic shift can be explained by the two different cleavage pathways of the rhodamine B molecule under UV-visible irradiation. Generally, rhodamine B adsorbs on the surface of TiO2 via a carboxylic group (COOH).56 The oxidative species of TiO2 actively attack the conjugated chromophore ring, which is identified by the decrease in rhodamine B absorption at 554 nm. On the other hand, few reports suggest that surface fluorination or anionic surfactant modification on TiO2 converts the adsorption modes of TiO2.56 Surface fluorination on TiO2 increases the polarity (negative charge) on the surface. Therefore, rhodamine B tends to adsorb through –NEt2 (cationic group). This type of adsorption led to the cleavage of the amine group initially and produced an intermediate rhodamine (498 nm).57,58 This interpretation is supported by the adsorption of rhodamine B on the catalyst surface. The adsorptions (%) of NaGdF4:Yb:Er/TiO2, NaGdF4:Yb:Er/Ag and NaGdF4:Yb:Er/Ag/TiO2 are 48, 36, and 15% respectively, calculated from the absorbance difference between the fresh dye and before irradiation (0 min). The rhodamine B adsorbed on the NaGdF4:Yb:Er/TiO2 surface was much higher than that on the NaGdF4:Yb:Er/Ag and NaGdF4:Yb:Er/Ag/TiO2 composites. The adsorption behaviour was attributed to the increased surface area and polarity of the composites. In the NaGdF4:Yb:Er/TiO2 composite, NaGdF4 has changed the surface characteristics of NaGdF4:Yb:Er/TiO2 and orients the rhodamine B adsorption through the amine group. The adsorption on TiO2 facilitated the N-de-alkylation of rhodamine B (Fig. 9e) and produced rhodamine, which was observed at 498 nm (Fig. 9a). The resultant intermediate degraded gradually with the irradiation of light. For semiconductor based photocatalysts, the adsorption of the reactants is very important for enhancing photocatalytic activity since it creates a reactant rich environment and reinforces the interaction between the reactant and catalyst surface.59 On the other hand, for silver nanoparticles containing composites of NaGdF4:Yb:Er/Ag and NaGdF4:Yb:Er/Ag/TiO2 (Fig. 9b and c), the absorption intensity of rhodamine B decreased with a slight shift but did not approach 498 nm. This observation suggested that silver addition to the NaGdF4 reduces the surface charge of the catalyst through chemisorption. Therefore, rhodamine B was predominantly decomposed by a typical conjugated chromophore cleavage pathway rather than N-de-alkylation. The nanocomposite catalysts decomposed the rhodamine B by two different pathways. The NaGdF4:Yb:Er/Ag/TiO2 composite took only 30 min for almost a complete degradation. Fig. 9d shows that NaGdF4:Yb:Er/Ag/TiO2 had a higher photocatalytic activity than NaGdF4:Yb:Er/Ag and NaGdF4:Yb:Er/TiO2 because of the enhanced light absorption and efficient generation of photogenerated species. The results concluded that NaGdF4 introduced not only upconversion luminescence emission but also increased the adsorption of dyes (cationic groups) on the surface of the catalysts. The results exhibited the excellent UV-visible light driven photocatalytic ability of the catalyst.


image file: c6ra10208e-f9.tif
Fig. 9 Rhodamine B degradation spectra with different catalysts (a) NaGdF4:Yb:Er/TiO2 (b) NaGdF4:Yb:Er/Ag, (c) NaGdF4:Yb:Er/Ag/TiO2; (d) relative absorbance of rhodamine B with three different catalysts under UV-visible light irradiation; (e) rhodamine B structural changes with NaGdF4:Yb:Er/TiO2 under UV-visible light irradiation.

The reusability of the catalyst was verified under UV-visible irradiation, as shown in Fig. 10. The catalyst showed 97, 95, 92, 94, 80 and 77% of rhodamine B degradation in 30 min. The catalyst exhibited nearly equal values for the first four cycles. After that, it started to decrease. This might be due to aggregation of the particles over prolonged usage.


image file: c6ra10208e-f10.tif
Fig. 10 Rhodamine B degradation with NaGdF4:Yb:Er/Ag/TiO2 under UV-visible light irradiation from the first to sixth cycles.

4. Conclusions

A one-pot thermal decomposition method was developed to synthesize the NaGdF4:Yb:Er/Ag/TiO2 nanocomposite. XRD, TEM, EDS and elemental mapping results confirmed the composite structure of the NaGdF4:Yb:Er, Ag particles, and TiO2 nanostructures. The materials showed excellent luminescent quenching behavior upon 980 nm irradiation by adding Ag and TiO2 with NaGdF4:Yb:Er. The emission region of NaGdF4:Yb:Er overlapped with the absorption range of Ag/TiO2, which was identified by UV-vis absorption spectra. The emitted upconversion light was recaptured by Ag/TiO2, which created a photocatalytic reaction under NIR irradiation. Interestingly, two different fragmentation pathways were identified for rhodamine B with the composites under UV-visible light because of the two different adsorption modes. The promising photocatalytic results of NaGdF4:Yb:Er/Ag/TiO2 under the UV-visible and NIR lights revealed a new pathway to harvest UV-visible and infra-red light from solar light.

Acknowledgements

This research was financially aided by a Grant-in-Aid for JSPS Fellows related to a JSPS Postdoctoral Fellowship for Foreign Researchers (No. 26-04050) from the Ministry of Education, Culture, Sports, Science and Technology of Japan and the cooperative research project of the Research Institute of Electronics, Shizuoka University. We thank Centre for Nano-device Fabrication and Analysis for the use of the Instruments. We sincerely thank Mr Koyama and Mr Tomada for their help to measure various instruments.

References

  1. M. R. Hoffmann, S. T. Martin, W. Choi and D. W. Bahnemannt, Chem. Rev., 1995, 95, 69–96 CrossRef CAS.
  2. K. Hashimoto, H. Irie and A. Fujishima, Jpn. J. Appl. Phys., Part 1, 2005, 44, 8269–8285 CrossRef CAS.
  3. S. Das and W. M. A. Wan Daud, Renewable Sustainable Energy Rev., 2014, 39, 765–805 CrossRef CAS.
  4. A. Fujishima and K. Honda, Nature, 1972, 238, 37–38 CrossRef CAS PubMed.
  5. A. Mills, R. H. Davies and D. Worsley, Chem. Soc. Rev., 1993, 22, 417–425 RSC.
  6. H. Wang, L. Zhang, Z. Chen, J. Hu, S. Li, Z. Wang, J. Liu and X. Wang, Chem. Soc. Rev., 2014, 43, 5234–5244 RSC.
  7. X. Chen and S. S. Mao, Chem. Rev., 2007, 107, 2891–2959 CrossRef CAS PubMed.
  8. S. Huang, N. Zhu, Z. Lou, L. Gu, C. Miao, H. Yuan and A. Shan, Nanoscale, 2014, 6, 1362–1368 RSC.
  9. S. Obregón, A. Kubacka, M. Fernandez-Garcia and G. Colón, J. Catal., 2013, 299, 298–306 CrossRef.
  10. N. Prakash, R. Karthikeyan, D. Thangaraju, M. Navaneethan, M. Arivanandhan, T. Koyama and Y. Hayakawa, ChemPhysChem, 2015, 16, 3084–3092 CrossRef CAS PubMed.
  11. A. S. Weber, A. M. Grady and R. T. Koodali, Catal. Sci. Technol., 2012, 2, 683–693 CAS.
  12. L. G. Devi and R. Kavitha, Appl. Catal., B, 2013, 140–141, 559–587 CrossRef CAS.
  13. M. K. Seery, R. George, P. Floris and S. C. Pillai, J. Photochem. Photobiol., A, 2007, 189, 258–263 CrossRef CAS.
  14. M. Pelaez, N. T. Nolan, S. C. Pillai, M. K. Seery, P. Falaras, A. G. Kontos, P. S. M. Dunlop, J. W. J. Hamilton, J. A. Byrne, K. O'Shea, M. H. Entezari and D. D. Dionysiou, Appl. Catal., B, 2012, 125, 331–349 CrossRef CAS.
  15. W. Hung, T. Chien and C. Tseng, J. Phys. Chem. C, 2014, 118, 12676–12681 CAS.
  16. J. Mu, B. Chen, M. Zhang, Z. Guo, P. Zhang, Z. Zhang, Y. Sun, C. Shao and Y. Liu, ACS Appl. Mater. Interfaces, 2012, 4, 424–430 CAS.
  17. X. Yang, Y. Wang, L. Xu, X. Yu and Y. Guo, J. Phys. Chem. C, 2008, 112, 11481–11489 CAS.
  18. J. Li, S. K. Jiangtian, P. Z. Zheng, T. Senty, F. Meng, A. D. Bristow, A. Manivannan and N. Wu, J. Am. Chem. Soc., 2014, 136, 8438–8449 CrossRef CAS PubMed.
  19. S. J. A. Moniz, S. A. Shevlin, D. J. Martin, Z.-X. Guo and J. Tang, Energy Environ. Sci., 2015, 8, 731–759 CAS.
  20. J. Zhou, Q. Liu, W. Feng, Y. Sun and F. Li, Chem. Rev., 2015, 115, 395–465 CrossRef CAS PubMed.
  21. K. Fu, J. Huang, N. Yao, X. Xu and M. Wei, Ind. Eng. Chem. Res., 2015, 54, 659–665 CrossRef CAS.
  22. G. Chen, H. Qiu, P. N. Prasad and X. Chen, Chem. Rev., 2014, 114, 5161–5214 CrossRef CAS PubMed.
  23. Z.-X. Li, F.-B. Shi, T. Zhang, H.-S. Wu, L.-D. Sun and C.-H. Yan, Chem. Commun., 2011, 47, 8109–8111 RSC.
  24. S. Obregón and G. Colón, Chem. Commun., 2012, 48, 7865–7867 RSC.
  25. J. Reszczyńska, T. Grzyb, J. W. Sobczak, W. Lisowski, M. Gazda, B. Ohtani and A. Zaleska, Appl. Catal., B, 2015, 163, 40–49 CrossRef.
  26. W. Qin, D. Zhang, D. Zhao, L. Wang and K. Zheng, Chem. Commun., 2010, 46, 2304–2306 RSC.
  27. X. Guo, W. Song, C. Chen, W. Di and W. Qin, Phys. Chem. Chem. Phys., 2013, 15, 14681–14688 RSC.
  28. S. Huang, L. Gu, C. Miao, Z. Lou, N. Zhu, H. Yuan and A. Shan, J. Mater. Chem. A, 2013, 1, 7874–7879 CAS.
  29. X. Wu, S. Yin, Q. Dong, B. Liu, Y. Wang, T. Sekino, S. W. Lee and T. Sato, Sci. Rep., 2013, 3, 2918 Search PubMed.
  30. Y. Tang, W. Di, X. Zhai, R. Yang and W. Qin, ACS Catal., 2013, 3, 405–412 CrossRef CAS.
  31. X. Guo, W. Di, C. Chen, C. Liu, X. Wang and W. Qin, Dalton Trans., 2014, 43, 1048–1054 RSC.
  32. Y. Liu, D. Tu, H. Zhu, R. Li, W. Luo and X. Chen, Adv. Mater., 2010, 22, 3266–3271 CrossRef CAS PubMed.
  33. P. Kannan, F. Abdul Rahim, R. Chen, X. Teng, L. Huang, H. Sun and D. H. Kim, ACS Appl. Mater. Interfaces, 2013, 5, 3508–3513 CAS.
  34. M. Pedroni, F. Piccinelli, T. Passuello, M. Giarola, G. Mariotto, S. Polizzi, M. Bettinelli and A. Speghini, Nanoscale, 2011, 3, 1456–1460 RSC.
  35. C. Liu, Z. Gao, J. Zeng, Y. Hou, F. Fang, Y. Li, R. Qiao, L. Shen, H. Lei, W. Yang and M. Gao, ACS Nano, 2013, 7, 7227–7240 CrossRef CAS PubMed.
  36. G. Ren, S. Zeng and J. Hao, J. Phys. Chem. C, 2011, 115, 20141–20147 CAS.
  37. F. He, N. Niu, L. Wang, J. Xu, Y. Wang, G. Yang, S. Gai and P. Yang, Dalton Trans., 2013, 42, 10019–10028 RSC.
  38. Z. Wang, J. H. Hao and H. L. W. Chan, J. Mater. Chem., 2010, 20, 3178–3185 RSC.
  39. M. C. Tan, L. Al-Baroudi and R. E. Riman, ACS Appl. Mater. Interfaces, 2011, 3, 3910–3915 CAS.
  40. C. Wu, X. Zhou and J. Wei, Nanoscale Res. Lett., 2015, 10, 354 CrossRef PubMed.
  41. Z. Lou, Z. Wang, B. Huang and Y. Dai, ChemCatChem, 2014, 6, 2456–2476 CrossRef CAS.
  42. P. Wang, B. Huang, X. Qin, X. Zhang, Y. Dai, J. Wei and M. H. Whangbo, Angew. Chem., Int. Ed., 2008, 47, 7931–7933 CrossRef CAS PubMed.
  43. Y. Bi, H. Hu, S. Ouyang, Z. Jiao, G. Lu and J. Ye, J. Mater. Chem., 2012, 22, 14847–14850 RSC.
  44. J. Jiang, H. Li and L. Zhang, Chem.–Eur. J., 2012, 18, 6360–6369 CrossRef CAS PubMed.
  45. C. Wang and D. Astruc, Chem. Soc. Rev., 2014, 43, 7188–7216 RSC.
  46. X. Wang, G. I. N. Waterhouse, D. R. G. Mitchell, K. Prince and R. A. Caruso, ChemCatChem, 2011, 3, 1763–1771 CrossRef CAS.
  47. Y. Ma, H. Liu, Z. Han, L. Yang, B. Sun and J. Liu, Analyst, 2014, 139, 5983–5988 RSC.
  48. S. Liu, G. Chen, T. Y. Ohulchanskyy, M. T. Swihart and P. N. Prasad, Theranostics, 2013, 3, 275–281 CrossRef CAS PubMed.
  49. Z. Xu, M. Quintanilla, F. Vetrone, A. O. Govorov, M. Chaker and D. Ma, Adv. Funct. Mater., 2015, 25, 2950–2960 CrossRef CAS.
  50. Y. Ma, H. Liu, Z. Han, L. Yang and J. Liu, J. Mater. Chem. A, 2015, 3, 14642–14650 CAS.
  51. P. Ramasamy, P. Chandra, S. W. Rhee and J. Kim, Nanoscale, 2013, 5, 8711–8717 RSC.
  52. L. Lei, D. Chen, P. Huang, J. Xu, R. Zhang and Y. Wang, Nanoscale, 2013, 5, 11298–11305 RSC.
  53. A. Noculak, A. Podhorodecki, G. Pawlik, M. Banski and J. Misiewicz, Nanoscale, 2015, 13784–13792 RSC.
  54. H. Eom, J.-Y. Jung, Y. Shin, S. Kim, J.-H. Choi, E. Lee, J.-H. Jeong and I. Park, Nanoscale, 2014, 6, 226–234 RSC.
  55. S. Rasalingam, C. M. Wu and R. T. Koodali, ACS Appl. Mater. Interfaces, 2015, 7, 4368–4380 CAS.
  56. Q. Wang, C. Chen, D. Zhao, M. Wanhong and J. Zhao, Langmuir, 2008, 24, 7338–7345 CrossRef CAS PubMed.
  57. L. Wang, J. Shang, W. Hao, S. Jiang, S. Huang, T. Wang, Z. Sun, Y. Du, S. Dou, T. Xie, D. Wang and J. Wang, Sci. Rep., 2014, 4, 7384 CrossRef PubMed.
  58. S. Hu, J. Zhu, L. Wu, X. Wang, P. Liu, Y. Zhang and Z. Li, J. Phys. Chem. C, 2011, 460–467 Search PubMed.
  59. X. Li and Y. Jinhua, J. Phys. Chem. C, 2007, 111, 13109–13116 CAS.

This journal is © The Royal Society of Chemistry 2016