Comparative DFT and DFT-D studies on structural, electronic, vibrational and absorption properties of crystalline ammonium perchlorate
Qiong Wu*ab,
Chuanlong Liab,
Linghua Tanab,
Zusheng Hangab and
Weihua Zhuc
aJiangsu Key Laboratory of Advanced Structural Materials and Application Technology, Jiangsu, PR China
bSchool of Materials Science and Engineering, Nanjing Institute of Technology, Jiangsu, PR China. E-mail: qwunjit@163.com
cInstitute for Computation in Molecular and Materials Science and Department of Chemistry, Nanjing University of Science and Technology, Jiangsu, PR China
First published on 9th May 2016
Abstract
We investigated the structural, electronic, vibrational and absorption properties of crystalline ammonium perchlorate (AP) at the pressure of 0–250 GPa by pure density functional theory and vdW-corrected DFT methods. It is found that a vdW correction is very necessary when studying the structure and properties of AP under different ranges of pressure, and the effects of vdW force are more obvious at a lower pressure than at a higher pressure. A structural transformation happens at 60 GPa and makes the positions of the anions and cations in the crystal rearrange. AP is chemically stable at all the investigated pressures and this unbelievable high stability is mainly due to its strong intermolecular hydrogen bonding. AP becomes more insensitive with the increment of pressure from 0 to 50 GPa, while the case is just the opposite when the pressure is increased from 50 to 250 GPa. The effect of the high pressure on the NH4 stretching mode is more pronounced than that on the ClO4 stretching mode, showing that the N–H bonds may be more easily compressed than the Cl–O bonds under compression; thus, N–H bonds are more possible to break under high pressure.
1. Introduction
Ammonium perchlorate (AP, NH4ClO4, Fig. 1),1–4 a cheap energetic oxidizer which contains a large amount of oxygen, has been widely and extensively employed as an ingredient in solid rocket propellants and high explosives. Thus, a great quantity of investigations have been done on its structure and properties under different conditions in the past decades.5–8 Unfortunately, due to the great complexity of chemical behavior and high difficulty of experimental measurement, many fundamental and practical problems of AP are still not well understood. For instance, only a few studies ever reported the structural properties of AP under high pressure, making it be unclear still. It is important to clearly understand the effects of pressure on the structure and properties of AP. This is because that, first, the AP-based solid rocket propellants and explosive formulations are used at extreme conditions usually, such as at high pressure, etc. While these energetic materials including AP are typical organic solids, which are always highly compressible, they may go through conformation transformations, polymerization, phase transitions, or decomposition under compression. These changes will further influence their sensitivity and performance, and finally affect the safety in storing and handling explosives. In addition, these energetic compounds also undergo enormous pressure effects during the detonation process. The structure during the high pressure explosion is one crucial aspect of their decomposition and burning. In all, knowledge of the structure (like the crystal, molecular and electronic structures) and properties (like the vibrational and absorption properties) of AP under high pressure appears to be not only very useful and helpful in understanding its decomposition and burning, but also is momentous for its practical storage, usage and disposal, and for developing new high energy ionic oxidizers. Thus, it is important to investigate the high pressure behavior of AP.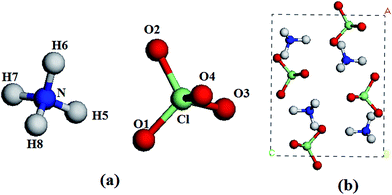 | ||
| Fig. 1 A molecule (a) and a unit cell (b) of AP. Chlorine, nitrogen, oxygen, and hydrogen atoms are represented by green, blue, red, and white spheres, respectively. | ||
Several experiments were carried out to study the structure and properties of AP under high pressure.9–13 However, the few investigations on high pressure behavior of AP seem to contradict each other and the evaluated pressure range is limited. For example, an optical study of the compression of AP presented no evidence of high pressure phase transitions9 while one other study12 reported contrary results. This shows the complexity and incomplete understanding of the structure and properties of AP. Thus, two theoretical studies14,15 were done to further investigate the high pressure behavior of AP using the density functional theory (DFT) method without considering the influence of vdW forces. Since AP is an ionic molecular system, the vdW forces between the cation and anion may play a very important role in its crystal packing. The vdW correction should be considered when studying its structure and properties. Thus, further systematic studies on AP at elevated pressures using the vdW-corrected DFT (DFT-D) method are needed.
In this work, we employed both DFT and DFT-D methods to study the structural, electronic, vibrational and absorption properties of crystalline AP in the pressure of 0–250 GPa. The effects of vdW correction on the results were investigated. Our main purpose here is to examine the effects of different pressures on the microscopic properties of the ionic crystal. The atomic positions and the unit cell parameters were allowed to relax to the minimum energy configuration to investigate the crystal structure at different pressures.
2. Computational method
The calculations performed in this study were done within the framework of DFT based on CASTEP code16 by employing ultra-soft pseudo-potentials17 and a plane wave expansion of the wave functions. The self-consistent ground state of the system was determined using a band-by-band conjugate gradient technique to minimize the total energy of the system with respect to the plane wave coefficients. The electronic wave functions were obtained using a density-mixing minimization method18 for the self-consistent field calculation and the structures were relaxed using the Broyden, Fletcher, Goldfarb, and Shannon (BFGS)19 method. Geometry optimization is based on reducing the magnitude of the calculated forces and stresses until they become smaller than convergence tolerances. Therefore, it is possible to specify an external stress tensor to model the behavior of the system under tension, compression, shear, etc. In these cases the internal stress tensor is iterated until it becomes equal to the applied external stress. The GGA with PBE (Perdew–Burke–Ernzerhof)20 and PW91 (Perdew–Wang 91) functionals21 were employed. To correct DFT for missing vdW interaction, we used the Tkatchenoko and Scheffer (TS)22 and the Grimme (G06)23 corrections to the PBE functional (labelled as PBE-TS and PBE-G06, respectively) and Ortmann, Bechstedt, and Schmidt (OBS)24 to the PW91 functional (labelled as PW91-OBS). The cut-off energy of the plane waves was set to 500 eV. Brillouin zones sampling was performed using the Monkhost–Pack scheme with a k-point grid of 2 × 2 × 2. The values of the kinetic energy cut-off and the k-point grid were determined to ensure the convergence of total energies.AP crystallizes in an orthorhombic lattice with the Pnma space group.13 Fig. 1 displays the crystal structure and atomic numbering of AP. In order to compare with experiments, we used the crystal structure AP at ambient pressure and temperature as the input structure. The experimental crystal structure of AP was first relaxed to allow the atomic configurations, cell shape, and volume to change at ambient pressure. Then from this relaxed structure, we applied hydrostatic compression of 1–250 GPa with a pressure step of approximately 1 GPa to relax the crystal structure without any symmetry constraints and the pressure is applied equally in all directions. All the calculations are based on the same experimental crystal structure of AP. In the geometry relaxation, the total energy of the system was converged to less than 2.0 × 10⁻⁵ eV, the residual force was less than 0.05 eV Å−1, the displacement of atoms was less than 0.002 Å, and the residual bulk stress was less than 0.1 GPa.
3. Results and discussion
As a benchmark, two pure DFT methods (PBE and PW91) and three DFT-D methods (PBE-G06, PBE-TS, and PW91-OBS) were selected to fully relax the AP crystal at ambient pressure without any constraints. Table 1 lists the experimental and relaxed cell parameters of the AP crystal. First, it is found that the calculated lattice parameters by the two pure DFT methods (PBE and PW91) are obviously higher than the experimental results at ambient conditions, especially for the a and b lattice parameters. However, this discrepancy can be corrected when the DFT-D methods are used. The calculated a and b lattice parameters by PBE-G06, PBE-TS and PW91-OBS are very close to the experimental values, especially by the PW91-OBS method, indicating that the lattice parameters a and b may be more sensitive to van der Waals interactions than c. Therefore, a vdW correction is very necessary when studying the structure of the AP crystal. In addition, our calculated results by the PW91-OBS method are more close to the experimental values than previous calculations.13,14 For instance, a and b parameters are only overestimated by 0.1% and 0.9%, respectively, while they are underestimated and overestimated by more than 2.7% and 4.7%, respectively, in one recent study.14| Parameter | a (Å) | b (Å) | c (Å) | α (°) | β (°) | γ (°) | Volume (Å3) |
|---|---|---|---|---|---|---|---|
| a Results from ref. 14. | |||||||
| Expt. | 9.219 | 5.811 | 7.450 | 90.0 | 90.0 | 90.0 | 399.1 |
| PBE | 9.725 (5.5%) | 6.709 (15.5%) | 7.354 (−1.0%) | 90.0 | 90.0 | 90.0 | 479.8 |
| PBE-TS | 9.269 (0.5%) | 6.120 (5.3%) | 7.407 (−0.5%) | 90.0 | 90.0 | 90.0 | 420.1 |
| PBE-G06 | 9.365 (1.6%) | 5.903 (1.6%) | 7.414 (−0.5%) | 90.0 | 90.0 | 90.0 | 409.9 |
| PW91 | 9.675 (4.9%) | 6.007 (3.4%) | 7.360 (0.0%) | 90.0 | 90.0 | 90.0 | 427.7 |
| PW91-OBS | 9.225 (0.1%) | 5.866 (0.9%) | 7.343 (−1.4%) | 90.0 | 90.0 | 90.0 | 397.3 |
| LDAa | 9.344 (1.4%) | 6.309 (−6.0%) | 7.302 (−2.0%) | 90.0 | 90.0 | 90.0 | 430.5 |
In all, the calculated values by the DFT-D method (PW91-OBS) are much more close to the experimental values than those by other methods. Thus, we employed PW91 with the OBS correction to study the structure and properties of AP under high pressure. To further investigate the effects of vdW correction under high pressure, the pure DFT method (PW91) was also employed.
3.1 Crystal and molecular structure
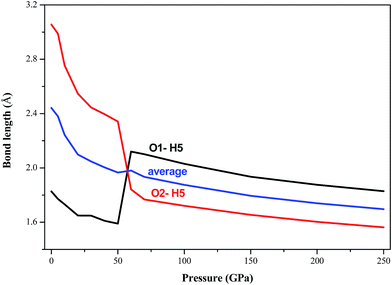
In this section, we turn to study the effects of pressure and vdW correction on the crystal structure of AP. Table 2 lists the bond lengths at ambient conditions of AP calculated by PW91-OBS, PW91, PBE, PBE-TS and PBE-G06, along with the experimental results. It is seen that the calculated results by PW91-OBS are very close to the experimental values, and predicted bond lengths by PW91-OBS are much more close to the experimental values than those by PW91, which further indicates that the vdW correction is very necessary when studying the structure of AP. In addition, the calculated values by PW91-OBS are also more close to the experiments than those by PBE, PBE-TS and PBE-G06. Fig. 2 displays the relaxed lattice constants (a, b, c) of AP by PW91-OBS and PW91 in the pressure range of 0–250 GPa. First, it is seen that in general, the lattice constants decrease gradually with the increment of pressure, indicating that the lattice constants of AP are sensitive to the pressure. Then, the predicted lattice constants by PW91 are higher than those by PW91-OBS generally, especially in the low pressure range of 0–50 GPa. However, the results by these two methods become more and more close with the increasing pressure; this may indicate that the effects of vdW force are obvious at lower pressure, while this would be reduced to some degree at higher pressure. Finally, it is found that the lattice constants change irregularly in the pressure range of 50–70 GPa, suggesting that the crystal structure of AP may undergo big changes. For instance, from the results by PW91-OBS, when the pressure is increased from 50 to 60 GPa, the lattice parameters b and c increase and decrease obviously, respectively, indicating that AP undergoes a structural transformation at 60 GPa and makes the structure of AP at 60 GPa different to that at 50 GPa. This can be seen clearly in Fig. 3. From Fig. 3a, first, it is found that the bond lengths of the H5–O1 bond and H5–O2 bond decrease gradually from 1.828 to 1.590 Å and 3.056 to 2.342 Å with the increment of pressure from 0 to 50 GPa, however, they increase and decrease suddenly, respectively, when the pressure is changed from 50 to 60 GPa, indicating that the relative positions of the anions and cations in the crystal rearrange. A similar phenomenon can be observed from the variation tendency of the relative positions of O5 and H5 atoms. This can be further supported by Fig. 3b.| Bond length | Cl–O1 | Cl–O2 | Cl–O3 | Cl–O4 | N–H5 | N–H6 | N–H7 | N–H8 |
|---|---|---|---|---|---|---|---|---|
| Expt. | 1.442 | 1.434 | 1.434 | 1.442 | 1.027 | 1.028 | 1.028 | 1.029 |
| PW91-OBS | 1.452 | 1.441 | 1.446 | 1.452 | 1.034 | 1.034 | 1.035 | 1.034 |
| PW91 | 1.454 | 1.444 | 1.461 | 1.454 | 1.045 | 1.035 | 1.035 | 1.037 |
| PBE | 1.459 | 1.445 | 1.455 | 1.455 | 1.048 | 1.039 | 1.037 | 1.037 |
| PBE-TS | 1.457 | 1.444 | 1.453 | 1.453 | 1.044 | 1.037 | 1.035 | 1.035 |
| PBE-G06 | 1.458 | 1.444 | 1.453 | 1.453 | 1.043 | 1.038 | 1.035 | 1.035 |
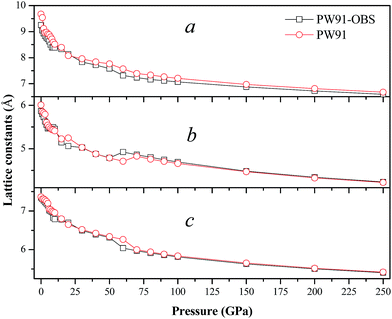 | ||
| Fig. 2 The relaxed lattice constants (a, b, c) of AP by PW91-OBS and PW91 in the pressure range of 0–250 GPa. | ||
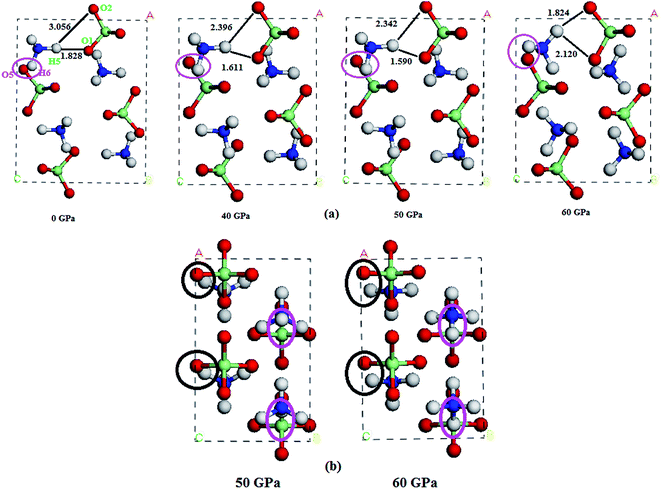 | ||
| Fig. 3 (a) The perspective view of the unit cells of AP at different pressures, and (b) from another viewpoint. | ||
In all the investigated pressures, it is found that AP is chemically stable. This unbelievable high stability of AP is mainly due to its strong inter-hydrogen bonding. Fig. 4 displays the calculated pressure dependence of intermolecular hydrogen bond lengths (O1–H5 and O2–H5 bonds) of AP by PW91-OBS. It is found that the bond lengths of O1–H5 and O2–H5 bonds and their average values decrease with the increment of pressure generally, except for the unusual changes at 60 GPa. This shows that the intermolecular H bonding interaction strengthens with the increasing pressure. This can be further supported by Fig. 5, from which it can be seen that the number of H bonds increases with the increment of pressure. A similar phenomenon was observed in previous experimental25 and DFT-D studies26 on TATB (1,3,5-triamino-2,4,6-trinitrobenzene) under high pressure.
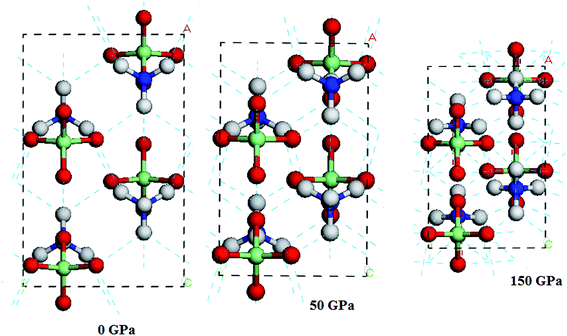 | ||
| Fig. 5 Hydrogen bonding in AP at 0, 50 and 150 GPa by PW91-OBS. The hydrogen bonding is presented by the blue-green dotted lines. | ||
Table 3 lists the deviations of our calculated lattice parameters and cell volumes of AP by PW91-OBS and PW91 at 1 GPa and 4 GPa from experiment results, respectively. It is found that our DFT-D results are very close to the experimental ones, while the DFT results without the vdW correction are obviously different from the experiments, especially for the a lattice parameter, which further shows the importance of vdW correction at lower pressure. In addition, one previous study13 ever reported a phase transition at about 4 GPa. Unfortunately, we did not observe the phase transformation here after carefully checking the changing trend of lattice constants and cell volumes at a pressure of about 4 GPa.
| Method | 1 GPa | 4 GPa | ||||||
|---|---|---|---|---|---|---|---|---|
| a | b | c | V | a | b | c | V | |
| PW91-OBS | −0.03 | −0.07 | −0.01 | −6.50 | −0.54 | −0.12 | −0.01 | −31.4 |
| PW91 | −0.11 | +0.05 | −0.12 | −6.70 | −0.32 | −0.00 | −0.18 | −22.0 |
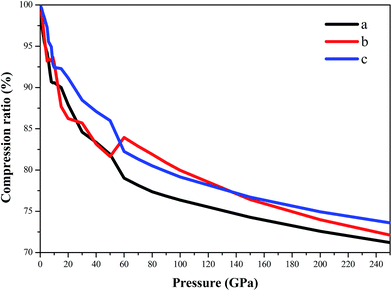
Fig. 6 displays the compression ratio (the ratio of the lattice constant at high pressure to that at constant pressure) of AP by PW91-OBS in the pressure range of 0–250 GPa. First, in the pressure range of 0–60 GPa, the compression ratio decreases with the sequence of c, b, and a, indicating that the structure is much stiffer in the c direction than in the a and b directions with the order of c > b ≈ a. This may be because the intermolecular interactions along the a direction are electrostatic attraction between cations and anions, while those along the b and c directions are vdW forces between different AP molecules. Then, in the pressure range of 60–140 GPa, the compression ratio decreases with the sequence of b, c, and a, indicating that the structure is much stiffer in the b direction than in the c and a directions with the order of b > c > a. Finally, in the pressure range of 140–250 GPa, the compression ratio decreases with the sequence of c, b, and a, indicating that the structure is much stiffer in the c direction than in the b and a directions with the order of c > b > a. In all, in the pressure range of 0–250 GPa, the compression ratio decreases with the sequence of c, b, and a, indicating that the structure is much stiffer in the c direction than in the b and a directions with the order of c > b > a. This shows that the compressibility of AP is anisotropic. As proposed by ref. 27, it may be inferred that AP has different sensitivity in different directions.
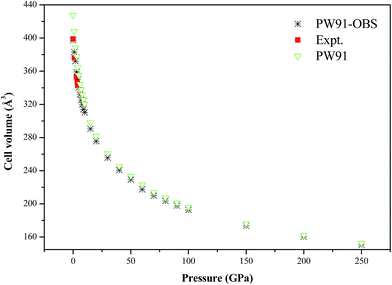
Fig. 7 shows the calculated P–V isotherm of AP along with previous experimental results. It is seen that the DFT-D results are in very good agreement with the experimental values at lower pressure, while the DFT results without the vdW correction are different from the experimental results to some degree. This further confirms the necessity and importance of vdW corrections in studying the structure of AP at lower pressure. In addition, the P–V isotherms by the DFT-D and DFT method tend to coincide with each other under higher pressure. The DFT-D results indicate that AP is compressed by about 62% when the pressure is increased from 0 to 250 GPa.
3.2 Electronic structure
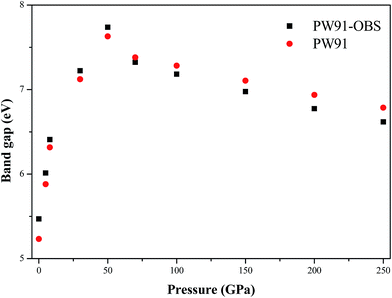
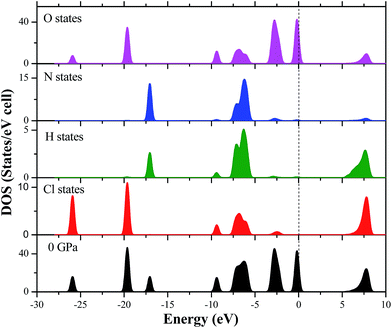
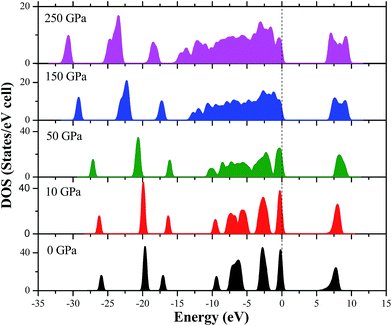
Previous studies reported that the electronic structure of energetic compounds could affects their structure and properties, while the electronic structure would be influenced by external pressure.28–32 Thus, in this section, we turn to investigate the effects of pressure on the electronic structure of AP by analyzing the changing trend of the band structure and density of states (DOS) with the increase of pressure. In comparison with the experiment results, band gaps are underestimated in DFT calculations in general, but these errors are close to being shifts of band energies. Therefore, these band gaps here are regarded as the lower limits. Fig. 8 displays the calculated band gaps of AP by PW91-OBS and PW91 under different pressures. First, it is seen that the band gaps of AP by these two methods are close to each other at all the investigated pressures. Then, as the pressure is increased from 0 to 50 GPa, the band gap of AP increases gradually, and peaks at 50 GPa. However, the band gap decreases monotonously with the increase of pressure from 50 to 250 GPa. This irregularly changing trend at 50 GPa is consistent with the variation trend of lattice constants, which is caused by the structural transformation occurring at 50 GPa. Furthermore, this first increasing and then decreasing tendency with the increment of pressure is different to that of the two famous and widely used energetic compounds TATB26 and RDX (hexahydro-1,3,5-trinitro-1,3,5-triazine),33 whose band gaps decrease with the increment of pressure. This is because AP is an ionic compound while TATB and HMX are two molecular compounds. Thus, at lower pressure, the applied compression significantly influences the molecular spacing of AP but has little effect on its intramolecular geometry, which indicates that the electrostatic interactions play the leading role and the crystal keeps an ionic character. However, the case is quite the contrary at high pressure. The change of intramolecular structure under high pressure leads to an increase of the overlap of different groups of bands and thus to the increase of charge overlap and delocalization in the system. These effects result in the aforementioned variation of the band gap for AP under high pressure. Previous studies34,35 have reported that for organic energetic crystals with a similar structure or with a similar thermal decomposition mechanism, the smaller the band gap is, the more easily the electron transfers from the valence band to the conduction band, and the more they decompose and explode. Thus, as is seen from Fig. 8, the band gap of AP decreases gradually with the increment of pressure from 0 to 50 GPa, suggesting that the AP crystal becomes more and more insensitive under compression. Similarly, the AP crystal becomes more and more sensitive with the increase of pressure from 50 to 250 GPa.In order to clearly understand the bond nature and electronic structure of the AP crystal under high pressure, its total DOS and partial density of states (PDOS) are calculated by PW91-OBS. Fig. 9 displays the partial DOS of the Cl states, N states, H states, and O states of AP at 0 GPa. First, it is found that the PDOS of the O states are far larger those of the Cl states, H states and N states in the upper valence band. It can be expected that the former makes more important contributions to the valence bands than the latter, indicating that O atoms act as active centers and chemical reactions are more possible to happen. Then, some strong peaks occur at the same energy in the PDOS of a particular Cl atom and at a particular O, indicating that the two atoms are bonded strongly. Similarly, a particular H atom at a particular N atom are bonded strongly. Finally, the DOS peaks in the conduction band region are dominated by the Cl states, N states, H states and O states. Fig. 10 displays the DOS of AP at 0, 10, 50, 150, and 250 GPa, respectively. When the pressure is increased from 0 to 50 GPa, it can be seen that the gap between the conduction band and valence band becomes bigger and bigger, showing that it is more difficult for the electron to transfer. Thus, AP becomes less sensitive. This is just in contrast with the increase of pressure from 50 to 250 GPa. Generally, when increasing the pressure from 0 to 250, the DOS peaks become more and more wide and dispersed, and tend to shift to a lower energy, indicating that the band splitting and band dispersion increase accompanied by a broadening of the DOS, which is due to the increasing intermolecular interactions under high pressure. Thus, the electronic delocalization in bulk AP is increased.
3.3 Vibrational properties
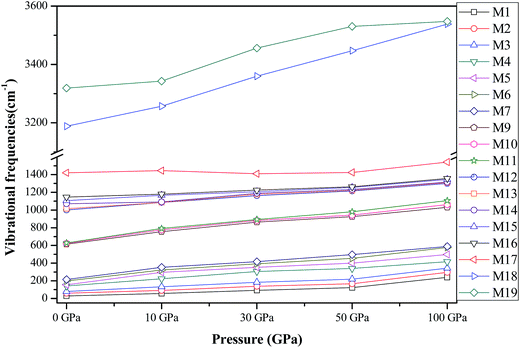
In this section, we turn to investigate the vibrational frequencies of crystal AP under hydrostatic pressure. First, to validate the reliability of our results, we compare our calculated values of the vibrational frequencies for AP by PW91-OBS and PW91 together with available experimental data36 at ambient conditions in Table 4. It is found that the calculated results by the DFT-D method are very much in agreement with the experimental values, while those by the DFT method are either higher or lower than the experimental results to some degree, indicating the necessity of vdW correction when calculating the vibrational frequencies of AP. Thus, the PW91-OBS method was used to calculate the vibrational frequencies of AP under high pressure, and both the lattice modes (M1–M7) due to intermolecular interactions and internal modes (M8–M19) due to intramolecular interactions are considered here, as shown in Fig. 11. It is seen that all 19 modes shift toward higher vibrational frequencies, especially for the lattice modes, showing that the pressure greatly affects the intermolecular interactions like the vdW interaction. Thus, the vdW correction also should be considered when calculating the vibrational frequencies of AP under high pressure. In addition, the linear fitted coefficients for the pressure-induced shift of the frequencies for M16 and M18 are 2.1 and 2.5 cm−1 GPa−1, indicating that the effect of the high pressure on the NH4 stretching mode (M18) is more pronounced than that on the ClO4 stretching mode (M16), which further shows that the N–H bonds may be more easily compressed than the Cl–O bonds under high pressure. In other words, N–H bonds are more sensitive to pressure than Cl–O bonds, thus N–H bonds are weaker than Cl–O bonds under compression.| Mode | PW91-OBS | PW91 | Expt. | Assignment |
|---|---|---|---|---|
| M1 | 29.1 | 29.8 | 28.0 | Lattice vibration |
| M2 | 61.1 | 63.5 | 60.0 | Lattice vibration |
| M3 | 80.2 | 85.2 | 81.0 | Lattice vibration |
| M4 | 141.7 | 144.9 | 140.0 | Lattice vibration |
| M5 | 156.0 | 162.0 | 158.0 | Lattice vibration |
| M6 | 197.7 | 205.3 | 199.0 | Lattice vibration |
| M7 | 216.2 | 211.2 | 220.0 | Lattice vibration |
| M8 | 464.0 | 463.1 | 465.0 | ClO4 symmetric bend |
| M9 | 614.3 | 607.8 | 627.0 | ClO4 asymmetric bend |
| M10 | 623.6 | 619.5 | 632.0 | ClO4 asymmetric bend |
| M11 | 627.4 | 621.1 | 637.0 | ClO4 asymmetric bend |
| M12 | 1001.7 | 1044.9 | 921.5 | ClO4 symmetric stretch |
| M13 | 1016.0 | 1062.0 | 936.5 | ClO4 symmetric stretch |
| M14 | 1071.3 | 1082.1 | 1063.0 | ClO4 asymmetric stretch |
| M15 | 1106.2 | 1111.0 | 1107.0 | ClO4 asymmetric stretch |
| M16 | 1146.0 | 1170.0 | 1133.0 | ClO4 asymmetric stretch |
| M17 | 1421.8 | 1378.0 | 1427.0 | NH4 asymmetric bend |
| M18 | 3187.9 | 3160.3 | 3206.0 | NH4 symmetric stretch |
| M19 | 3318.6 | 3338.9 | 3262.0 | NH4 asymmetric stretch |
3.4 Optical absorption spectra
In this section, we investigate the optical absorption coefficients of AP crystal at different pressures. The interaction of a photon with the electrons in the system can result in transitions between occupied and unoccupied states. The spectra resulting from these excitations can be described as a joint density of states between the valence and conduction bands. The imaginary part ε2(ω) of the dielectric function can be obtained from the momentum matrix elements between the occupied and unoccupied wave functions within the selection rules, and the real part ε1(ω) of the dielectric function can be calculated from the imaginary part ε2(ω) by the Kramer–Kronig relationship. The absorption coefficient α(ω) can be evaluated from ε1(ω) and ε2(ω):37
 | (1) |
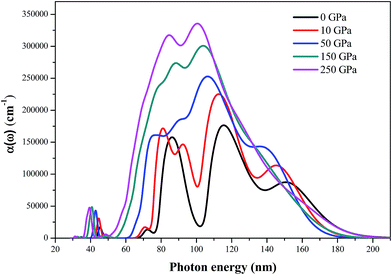
The absorption coefficients α(ω) calculated by the DFT-D method of AP at different pressures are shown in Fig. 12. The absorption spectra are active over various regions corresponding to the ionic or lattice structures of the individual material. The evolution pattern of absorption spectra for AP at different pressures is qualitatively similar. They have an absorption band covering from 30 to 200 nm and stronger optical absorption from 80 to 180 nm. The magnitude of the absorption coefficients of these peaks allows an optical transition due to excitons. At ambient pressure, AP exhibits a relatively high absorption coefficient over a relatively few, closely spaced bands. The strongest peak occurs at 117 nm and two other strong peaks occur at 87 and 151 nm, respectively. At energies below 66 nm or above 200 nm, the absorption coefficients are close to zero, indicating that AP is transparent in the energy range. Generally, the absorption coefficient enhances and the absorption region broadens gradually with the increment of pressure, indicating that AP has a relatively high optical activity at high pressures. When the pressure is increased from 0 to 250 GPa, the absorption coefficient increases significantly in the wavelength range of 30–60 nm, indicating that the optical activity of AP is enhanced at the near ultraviolet region.
4. Conclusions
In this work, both the DFT and DFT-D methods have been employed to investigate the structural, electronic, vibrational and absorption properties of crystalline AP at a pressure of 0–250 GPa. Our results show that the calculated a and b lattice parameters by the DFT method are obviously different from the experimental results, but the results by the DFT-D method are very close to the experimental values, suggesting that a and b are sensitive to van der Waals interactions. The effects of vdW force on the structure of AP are more obvious at lower pressure than at higher pressure. The structure of AP is stiffest in the c direction in the whole pressure range. The structural transformation that happens at 60 GPa makes the positions of the anions and cations in the crystal rearrange. AP is chemically stable at all the investigated pressures and this unbelievable high stability is mainly due to its strong intermolecular hydrogen bonding under high pressure.An analysis of the band gap and density of states of indicates that AP becomes more and more insensitive and sensitive with the increase of pressure from 0 to 50 GPa and 50 to 250 GPa, respectively. The calculated vibrational frequencies by the DFT-D method are in good agreement with the experimental values, while those by the DFT method are either higher or lower than the experimental results to some degree, indicating the necessity of vdW correction when calculating the vibrational frequencies of AP. The effect of the high pressure on the NH4 stretching mode is more pronounced than that on the ClO4 stretching mode, showing that the N–H bonds may be more easily compressed than the Cl–O bonds under compression; thus, N–H bonds are more possible to break under high pressure. The absorption spectra show that AP has a relatively high optical activity with the increasing pressure.
Acknowledgements
The present work was supported by the Introducing Talents Funds of Nanjing Institute of Technology (YKJ201507), Science Innovation Project for Undergraduates of Nanjing Institute of Technology (TB20160222), Science Foundation of Nanjing Institute of Technology (ZKJ201402), the Natural Science Foundation of the Jiangsu Higher Education Institutions of China (14KJD430002), the Jiangsu Key Laboratory Opening Project of Advanced Structural Materials and Application Technology (ASMA201408), and the Youth natural science foundation of Jiangsu Province (BK20130747).References
- P. Politzer and P. Lane, J. Mol. Struct., 1998, 454, 229–235 CrossRef CAS.
- T. B. Brill, P. J. Brush and D. G. Patil, Combust. Flame, 1993, 94, 70–76 CrossRef CAS.
- C. S. Choi, H. L. Prask and E. Prince, J. Chem. Phys., 1974, 61, 3523–3529 CrossRef CAS.
- A. L. Ramaswamy, H. Shin, W. Armstromg, C. H. Lee and J. Sharma, J. Mater. Sci., 1996, 31, 6035–6042 CrossRef CAS.
- P. W. M. Jacobs and H. M. Whitehead, Chem. Rev., 1969, 69, 551–590 CrossRef CAS.
- S. M. Peiris, G. I. Pangilinan and T. P. Russell, J. Phys. Chem. A, 2000, 104, 11188–11193 CrossRef CAS.
- G. Yuan, R. Feng, Y. M. Gupta and K. Zimmerman, J. Appl. Phys., 2000, 88, 2371–2377 CrossRef CAS.
- J. M. Winey, Y. A. Gruzdkov, Z. A. Dreger, B. J. Jensen and Y. M. Gupta, J. Appl. Phys., 2002, 91, 5650–5656 CrossRef CAS.
- F. Foltz and J. L. Maienschein, Mater. Lett., 1995, 24, 407–414 CrossRef.
- F. W. Sandstrom, P. A. Persson and B. Olinger, Tenth International Detonation Symposium, Office of Naval Research, Arlington, 1995, p. 766 Search PubMed.
- W. L. Elban, H. W. Sandusky, B. C. Beard and B. C. Glancy, J. Propul. Power, 1995, 11, 24–31 CrossRef CAS.
- G. I. Pangilinan and T. P. Russell, Shock Compression of Condensed Matter-1997, ed. S. C. Schmidt, D. P. Dandekar and J. W. Forbes, AIP Press, New York, 1998, p. 809 Search PubMed.
- S. Hunter, A. J. Davidon, C. A. Morrison, C. R. Pulham, P. Richardson, M. J. Farrow, W. G. Marshall, A. R. Lennie and P. J. Gould, J. Phys. Chem. B, 2011, 115, 18782–18788 CAS.
- W. H. Zhu, T. Wei, W. Zhu and H. M. Xiao, J. Phys. Chem. A, 2008, 112, 4688–4693 CrossRef CAS PubMed.
- W. H. Zhu, X. W. Zhang, W. Zhu and H. M. Xiao, Phys. Chem. Chem. Phys., 2008, 10, 7318–7323 RSC.
- M. D. Segall, P. J. D. Lindan, M. J. Probert, C. J. Pickard, P. J. Hasnip, S. J. Clark and M. C. Payne, J. Phys.: Condens. Matter, 2002, 14, 2717–2744 CrossRef CAS.
- D. Vanderbilt, Phys. Rev. B: Condens. Matter Mater. Phys., 1990, 41, 7892–7895 CrossRef.
- G. Kresse and J. Furthmüller, Phys. Rev. B: Condens. Matter Mater. Phys., 1996, 54, 11169–11186 CrossRef CAS.
- R. Fletcher, Practical Methods of Optimization, Wiley, New York, 1980, vol. 1 Search PubMed.
- J. P. Perdew and A. Zunger, Phys. Rev. B: Condens. Matter Mater. Phys., 1981, 23, 5048–5079 CrossRef CAS.
- J. P. Perdew, J. A. Chevary, S. H. Vosko, K. A. Jackson, M. R. Pederson, D. J. Singh and C. Fiolhais, Phys. Rev. B: Condens. Matter Mater. Phys., 1992, 46, 6671–6687 CrossRef CAS.
- A. Tkatchenko and M. Scheffler, Phys. Rev. Lett., 2009, 102, 073005 CrossRef PubMed.
- S. Grimme, J. Comput. Chem., 2006, 27, 1787–1799 CrossRef CAS PubMed.
- F. Ortmann, F. Bechstedt and W. G. Schmidt, Phys. Rev. B: Condens. Matter Mater. Phys., 2006, 73, 205101 CrossRef.
- A. J. Davidson, R. P. Dias, D. M. Dattelbaum and C. Yoo, J. Chem. Phys., 2011, 135, 174507 CrossRef PubMed.
- Q. Wu, W. H. Zhu and H. M. Xiao, RSC Adv., 2014, 4, 53149–53156 RSC.
- P. Politzer and J. S. Murray, Struct. Chem., 2014, 20, 2223–2230 Search PubMed.
- Q. Wu, W. H. Zhu and H. M. Xiao, J. Phys. Chem. C, 2013, 117, 16830–16839 CAS.
- W. H. Zhu and H. M. Xiao, J. Phys. Chem. B, 2006, 110, 18196–18203 CrossRef CAS PubMed.
- W. H. Zhu and H. M. Xiao, J. Comput. Chem., 2008, 29, 176–184 CrossRef CAS PubMed.
- W. H. Zhu, X. W. Zhang, T. Wei and H. M. Xiao, Theor. Chem. Acc., 2009, 124, 179–186 CrossRef CAS.
- Q. Wu, W. H. Zhu and H. M. Xiao, RSC Adv., 2014, 4, 15995–16004 RSC.
- Q. Wu, W. H. Zhu and H. M. Xiao, Can. J. Chem., 2013, 91, 968–973 CrossRef CAS.
- M. M. Kuklja, E. V. Stefanovich and A. B. Kunz, J. Chem. Phys., 2000, 112, 3417–3423 CrossRef CAS.
- T. Luty, P. Ordon and C. J. Eckhardt, J. Chem. Phys., 2002, 117, 1775–1785 CrossRef CAS.
- H. J. Prask, C. S. Choi and N. J. Chesser, J. Chem. Phys., 1988, 88, 5106–5122 CrossRef CAS.
- S. Saha, T. P. Sinha and A. Mookerjee, Phys. Rev. B: Condens. Matter Mater. Phys., 2000, 62, 8828–8834 CrossRef CAS.
| This journal is © The Royal Society of Chemistry 2016 |

