Graphene quantum dots from fishbone carbon nanofibers

D. Torres, J. L. Pinilla*, E. M. Gálvez and I. Suelves
Instituto de Carboquímica, CSIC, Miguel Luesma Castán 4, 50018 Zaragoza, Spain. E-mail: jlpinilla@icb.csic.es; Fax: +34 976733318; Tel: +34 976733977

Received 14th April 2016 , Accepted 11th May 2016

First published on 12th May 2016


Abstract

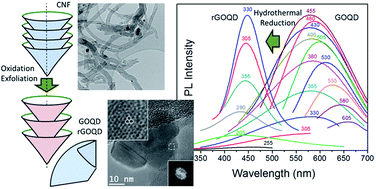
Graphene oxide quantum dots (GOQD) were obtained from fishbone carbon nanofibers (CNF) using a modified Hummers' method followed by ultrasound assisted exfoliation. Owing to its arrangement in accessible small sp2-carbon domains, CNF is a promising precursor for high yield GOQD obtention. The suspension was subjected to further separation by degressive differential centrifugation obtaining fractions of different sizes and oxidation states. The resulting graphene oxide-based products consisted of a mixture of expanded CNF, few-layer graphene oxide sheets and GOQD, the latter accounting for a yield of 42 wt% with respect to the initial CNF weight. The photoluminescence properties were dependent on the size and the oxidation state of each fractionated graphene oxide-based suspension. GOQD showed an excitation-dependent photoluminescent emission with a maximum at 578 nm (yellow) for an excitation of 455 nm. After hydrothermal reduction, reduced GOQD (rGOQD) exhibited bright violet photoluminescence at 448 nm for 330 nm of excitation due to the removal of hydroxyl and epoxide groups from basal planes of the graphene network. Furthermore, the quantum yield of GOQD and rGOQD were measured and reached values of 5.5 and 7%, respectively.

1. Introduction

Graphene is a zero-gap semiconductor and possess some outstanding electronic and optical properties that make it unique in the field of optoelectronics.1–8 In addition, substantial quantum confinement and edge effects make graphene nanoribbons into semiconductors when their width is less than ca. 10 nm.9 In the case of graphene quantum dots (GQD) this confinement comes down to nanometer-sized fragments (sizes less than 100 nm) leading to strong edge effects and quantum confinement.10 In this case, the crystallite size is in the order of the size of its exciton Bohr radius causing the squeezing and confinement of the excitons in all three spatial directions.11 However, since the Bohr radius in graphene is infinite, any size fragments could show quantum confinement effects generating a band gap10,12 and interesting photoluminescence (PL) properties13 for many potential applications including bioimaging, LEDs, biosensors, solar cells or photocatalysis.4,14 Thus, the band gap can be set by modifying the size and surface chemistry of the GQD which alters both the quantum confinement and the edge effects:15,16 these effects are accentuated in smaller samples and with zig-zag edges.13,17

Within the edge effects, functional groups introduce additional absorption features in GQD and affect photoluminescence.18,19 It has been reported that graphene edges containing carboxyl and carbonyl groups are parts of edge states responsible for green PL in GQD.20 Likewise, graphene oxide (GO) with an area as large as 100 μm2 obtained from controlled oxidation of graphene (intrinsically zero-gap semiconductor) generates PL with a low quantum yield.21,22 Hence, oxygen content in graphene oxide quantum dots (GOQD) via oxidation treatment has an effect on PL response and can be tuning by controlling the extent of oxidation. However, this is not a completely reversible oxidation/reduction process due to changes in atomic structure. This would be the main reason why GOQD and reduced GOQD (rGOQD) show different PL response (excitation and emission features).23 Quantum yields of chemically exfoliated GOQD and rGOQD ranged from 0.8 to 4.4%,24–27 and from 6.5 to 11.7%,13,25,28–32 respectively. Specifically, PL mechanisms are attributed to defect state emission for GOQD, involving surface oxygenated groups, and intrinsic state emission for rGOQD, caused by the quantum size effect or by zig-zag sites.33–36 The exhibited PL emission depends on the competition of these emission centers, being both intrinsic and defect states responsible of blue emission in rGOQD, and only the defect states in the GOQD emission.34

Regarding the preparation of GQD there is a wide variety of methods classified as “top-down” and “bottom-up” strategies4 that also influence on its final structure and hence the PL response. Exfoliative methods4 (hydrothermal and solvothermal, acidic oxidation, electrochemical, or sonication and microwave assisted) are top-down strategies and allow the use of diverse bulk graphene sources (mainly GO sheets,13,37 natural or synthetic graphite,38,39 carbon nanotubes,29 carbon nanofibers (CNF),26,30,40 coal41 and carbon black,24 among others), in liquid phase at low cost and easily scalable for large production. GQD thus obtained contain large amounts of oxygenated groups anchored to the edges which allow their solubility, functionalization and passivation. Nevertheless, these methods have some disadvantages such as low mass yields, defective aromatic carbon frameworks and lack of control over the morphology and the size distribution of the products.7,42 In all cases, a final size separation stage with different time consumption such as size-exclusion chromatography,43 centrifugation,26,44,45 dialysis,40 or combination of them,46 is required to size separation of exfoliated products.

Concerning to the weight yield of GQD obtained for top-down strategies, it is closely related to the sizes of graphite crystals and the carbon content in the graphene precursors: GQD yields of 1.6–8 wt% have been reported using GO synthesized from natural graphite by modified Hummers method,13,28,37 whereas 9.9 and 23.0% were obtained from K-intercalated graphite flakes and multi-wall carbon nanotubes (MWCNT), respectively.29 Other carbons as amorphous ones are mainly composed by amorphous carbon trapped in macromolecules of linked small-crystals of graphite and they achieved greater GQD yields, as expenses of a low quantum yield (<4%), ranging from 20.0 for coal to 44.5% for carbon black subjected to chemical oxidation.24,47 On the other hand, some of the disadvantages of exfoliative methods can be overcome using carbon nanofibers as GOQD precursor: starting material with a structure of accessible and small sp2 carbon domains and practically amorphous-free carbon content could ensure a more uniform size distribution and a higher weight yield.48 However, for the best of our knowledge, GQD weight yield obtained from any type of carbon nanofiber have never been reported in the literature.

The novelty of this work lies on the chemical exfoliation and/or size shortening of the sp2-carbon domains in fishbone type carbon nanofibers (CNF) for obtaining fractions based on different graphenic products. For the first time, products of oxidative cutting of CNF are effectively fractionated by degressive differential centrifugation (DDC) in expanded CNF, few-layer graphene oxide sheets (FLGO) and GOQD suspensions. Furthermore, different optical behaviors of graphenic fractions after hydrothermal reduction are studied. Remarkably, a wide range of emissions in the entire visible region from violet to red was observed for rGOQD and GOQD, respectively.

2. Materials and methods

Graphene oxide-based suspension was obtained from chemically oxidized CNF produced by catalytic decomposition of CH4[thin space (1/6-em)]:[thin space (1/6-em)]CO2 mixtures.49 The exfoliative procedure consisted of a chemical oxidation through modified Hummers method50–52 followed by ultrasonic exfoliation. Conditions and procedures for obtaining both CNF and derived graphene oxide-based products can be found in the ESI. Oxidation/exfoliation products were washed and fractionated by size using DDC as shown in Fig. 1. Centrifugation was carried out for successive decreasing rates by step (14[thin space (1/6-em)]800, 9500, 7000, 4500 and 2000 rpm), using the redispersed precipitate collected from the previous step and separating supernatants in order of increasing particle sizes. Centrifugation by degressive rates minimizes the entrainment of small particles by larger ones and maximizes its weight yield after the entire centrifugation process. After centrifugation, fractions with a concentration between 0.1 and 0.6 mg ml−1 were obtained. Finally, fractions were reduced in suspension by the hydrothermal reduction method (HR)53 in autoclave at 180 °C for 6 h.
image file: c6ra09679d-f1.tif
Fig. 1 Scheme of degressive differential centrifugation for fractionation of GO-based suspension.

Fractions consisted of water suspensions of graphene oxide-based materials that are hereafter denoted as “F-X” or “rF-X”, the latter for rGO-based fractions, where X indicates the centrifugation rate in rpm. In case of the last precipitate obtained after centrifugation at 2000 rpm, it is denoted as “F-0” or “rF-0”.

Characterization of raw CNF and GO or rGO-based fractions was carried out by X-ray diffraction (XRD), X-ray photoelectron spectroscopy (XPS), transmission electron microscopy (TEM), atomic force microscopy (AFM), confocal microscopy and UV/Vis and fluorescence spectroscopies. As prepared CNF were used without further treatment. Graphene oxide dispersions were either dried at 60 °C overnight for powder techniques such as XRD or XPS, or directly used with a concentration ca. 0.1–0.6 mg ml−1 for TEM, AFM and spectrochemical analysis. Analysis procedures of the characterization techniques and parameter calculations including structural as interplanar spacing (d002), crystal size (Lc) or number of layers (n), or optical as the PL quantum yield (PLQY or Φ) can be found in the ESI.

3. Results and discussion

3.1 Separation of GO-based materials by degressive differential centrifugation

In Fig. 2(a) and (b) are shown the as-prepared CNF which consisted of tubular structures with a diameter distribution of 38.4 ± 14.5 nm (inset Fig. 2(a)) and a few micrometers long. The graphene cones arrangement forms an angle α of 30.1 ± 6.4 nm along the axis (inset Fig. 2(b)). These morphological characteristics are determined by the size and shape of the nickel particles, respectively. The interlayer spacing in the graphitic domains of the CNF was ca. 0.34 nm (inset in Fig. 2(b)), typical of turbostratic arrangement.54,55
image file: c6ra09679d-f2.tif
Fig. 2 TEM images of as-prepared CNF and histograms of (a) diameter and (b) alpha normal distributions measured from randomly selected TEM images. Inset in (b) detail of the graphene stacking in a CNF structure with an interplanar spacing of 0.34 nm.

TEM images of fractions separated by DDC are shown in Fig. 3. Oxidized fractions obtained from CNF were separated in size during the DDC process at 14[thin space (1/6-em)]800, 9500, 7000, 4500 and 2000 rpm. Graphitic layers in CNF expanded during oxidation and then exfoliated by sonication in different particle types and sizes ranging from (in descending size): expanded CNF (a and b), FLGO sheets (c and d) and GOQD (e, f and i), the latter conforming a membrane-like structure after drying (yellow arrow in f). Expanded fishbone-like CNF maintained their original filamentous structure, with a high aspect ratio but doubles its interlayer spacing (see Fig. 3(g)). FLGO sheets, on the contrary, showed a low aspect ratio (length[thin space (1/6-em)]:[thin space (1/6-em)]width < 10) and were composed by a low number of layers (less than 5)52,56 (see Fig. 3(h)). In the case of GOQD, small sp2 domains act as overlapped grains in a continuous membrane structure as large as the drying area. The weight yield of F-9500 and F-14[thin space (1/6-em)]800, both suspensions mainly composed of GOQD, was 14 and 28 wt% of the starting CNF, respectively, which represents a great improvement in weight yield of GQD obtained for graphite-based top-down strategies, typically below 10 wt%.13,28,29,37


image file: c6ra09679d-f3.tif
Fig. 3 TEM images of fractions of treated CNF after differential centrifugation: (a) F-0, (b) F-2000, (c) F-4500, (d) F-7000, (e) F-9500 and (f) F-14[thin space (1/6-em)]800. Details of an expanded CNF (g), a FLGO sheet (h) and GOQD (i), corresponding to F-0, F-4500 and F-14[thin space (1/6-em)]800, respectively.

Oxidative treatment and subsequent ultrasound exfoliation resulted in the intercalation of oxygenated groups with subsequent separation of the graphitic layers. This can be clearly observed in the XRD patterns shown in Fig. 4 and Table 1, where the diffraction peak of the basal plane (002) of graphite stacking in CNF centred at a scattering angle (2θ) of 26.2° disappears as expenses of the shifted peak of graphite (002)* at 8.9–11.8°. The d spacing of the graphene layers shifted from 0.34 nm in the starting CNF to 0.75–0.99 nm in the fractionated oxygenated products, the latter ranging from expanded CNF (0.75–0.78 nm) to FLGO sheets (0.83–0.88 nm) and GOQD (0.93–0.99 nm). Obviously, this evidences that expanded CNF and FLGO sheets might continue fragmenting into GOQD with further oxidation. The (100) and (101) diffraction intensities at 42.8 and 44.4°, respectively, are related to in-plane structure of hexagonal graphite54 and they decreased after the treatment due to the shortening of the sp2 domains and defect inclusion, in addition to rotation distortions of graphene layers.54 It can also be noted that Ni diffraction peaks disappears after treatment, indicating the removal of Ni particles from as-prepared CNF (Ni and Al2O3 accounted for 12 wt% coming from the catalyst used to grow the CNF). Taking into account the separation by size, the intensity of the (002)* peak decreased as the centrifugation rate increased, having a clear relationship with the crystal size and d*002, as shown in Table 1. Thus, Lc varied from 1.1 nm for F-14[thin space (1/6-em)]800 (mainly GOQD) to 2.6 nm for F-0. These stacks ranged in average from 2.1 to 4.5 layers and interlayer spacing from 0.93 to 0.75 nm, respectively. Thanks to the differential centrifugation, fractions were successfully separated by size after the rupture of the graphitic stack in CNF, which according to XRD consisted of a starting crystal size of 6.45 nm and 20 layers.


image file: c6ra09679d-f4.tif
Fig. 4 (a) XRD patterns of CNF and oxidation fractions after separation by differential centrifugation (intensity of fraction patterns are multiplied by 10 for allowing a better comparison with CNF); (b) magnification of (002)* region in (a).
Table 1 Structural parameters determined by XRD for (002) and (002)* peaks: position (2θ), interplanar distance (d), crystallite size (Lc) and number of layers (n)
  Fraction 2θ (degrees) d (nm) Lc (nm) n
CNF 26.18 0.3402 6.45 20.0
GO-based fractions F-0 11.78 0.7506 2.62 4.5
F-2000 11.33 0.7805 2.17 3.8
F-4500 10.68 0.8277 2.49 4.0
F-7000 10.04 0.8799 1.99 3.3
F-9500 8.94 0.9885 1.53 2.6
F-14[thin space (1/6-em)]800 9.51 0.9289 1.07 2.1
rGO-based fractions rF-0 25.45 0.3497 1.60 5.6
rF-2000 25.40 0.3504 1.40 5.0
rF-4500 25.51 0.3489 1.45 5.2
rF-7000 25.50 0.3490 1.41 5.0
rF-9500 25.19 0.3533 1.27 4.6
rF-14[thin space (1/6-em)]800 25.05 0.3552 1.20 4.4


The oxygen content and the evolution of the oxygenated groups involved in the intercalation of the graphene layers were studied by XPS and collected in Table 2 (deconvoluted XPS spectra can be seen in Fig. S1 in ESI). From C 1s spectra deconvolution, three components were determined: an asymmetric peak combining sp2 graphitic carbon (C[double bond, length as m-dash]C) and sp3 hybridized carbon (C–C) at 284.5 eV,57 C–O bonds in hydroxyls (C–OH) or epoxides (C–O–C) at 286.3–286.9 eV, and C[double bond, length as m-dash]O bonds in carbonyls (C[double bond, length as m-dash]O) or carboxyl (O[double bond, length as m-dash]C–OH) at 288.4–288.9 eV. In some cases, the π–π* shake-up satellite contribution was found at 290.9 eV. GO-based fractions showed a decrease in oxygen content from 26 to 20% in supernatants as the centrifugation rates increased. This loss is mainly attributable to a lower relative contribution of in-plane oxygenated groups (hydroxyls and epoxides) as expense of out-plane groups (carbonyls and carboxyls) in thinner graphene domains. Consequently, there is a slight increase of the C/O ratio from 2 to 3 (see Table 2).

Table 2 XPS surface element analysis parameters of GO and rGO-based fractions
  Fraction C/O ratio O 1s (at%) Carbon components C 1s (at%)
C[double bond, length as m-dash]C/C–C C–O C[double bond, length as m-dash]O π–π*
GO-based fractions F-0 1.9 26.3 50.6 40.1 8.5 0.8
F-2000 2.7 22.1 58.8 33.5 7.4 0.3
F-4500 2.8 21.7 60.4 28.9 10.3 0.4
F-7000 3.1 20.2 62.5 27.5 9.6 0.4
F-9500 3.1 20.6 63.1 25.7 10.8 0.3
F-14[thin space (1/6-em)]800 2.8 22.1 62.0 26.9 10.9 0.2
rGO-based fractions rF-0 6.2 12.4 76.3 10.2 10.9 2.6
rF-2000 5.6 13.4 74.7 12.8 10.2 2.4
rF-4500 4.4 15.8 71.0 16.0 10.4 2.7
rF-7000 4.6 16.7 69.9 18.8 8.8 2.5
rF-9500 5.7 13.1 70.7 18.3 8.5 2.5
rF-14[thin space (1/6-em)]800 7.8 10.1 78.0 11.7 8.1 2.2


The topology of the smaller crystal size fraction (F-14[thin space (1/6-em)]800) was observed by tapping-mode AFM. In Fig. 5 are collected the AFM topographic image and derived height and equivalent diameter distributions of F-14[thin space (1/6-em)]800, which consisted entirely of GOQD with an equivalent diameter of 23.29 ± 6.62 nm (Fig. 5(b)) and 1.84 ± 1.04 nm of height (Fig. 5(c)), i.e., 1–3 layers in accordance with a d*002 of 0.9289 nm measured by XRD. Likewise, the mean surface area of these GOQD calculated from AFM measurements was ca. 700 nm2, which corresponds to an equivalent diameter of ca. 30 nm (see Fig. S2 and Table S1 in ESI). This value is lower than the theoretical lateral area (AL) of a graphene cone in CNF both open (3120 nm2) and unopened (862 nm2) (see ESI). Obviously, this implies the crazing of the graphene cone during the oxidation/exfoliation process resulting in the formation of GOQD. Furthermore, there is also a clear relationship between the area and height of the obtained graphene quantum dots (Fig. S3 in ESI), according to which it would be possible a narrower separation by size of this fraction combining centrifugation with dialysis, ultracentrifugation or size-exclusion chromatography.


image file: c6ra09679d-f5.tif
Fig. 5 AFM measurements of GOQD in the F-14[thin space (1/6-em)]800 fraction; (a) AFM image measured under tapping mode of F-14[thin space (1/6-em)]800 fraction. Inset in (a) height profile along the line in the topographic image; (b) histogram of equivalent diameter normal distribution measured from AFM images; (c) histogram of height normal distribution measured from AFM images.

3.2 Hydrothermal reduction of GO-based fractions

As reported by Zhou et al. on hydrothermal reduction of graphene oxide,53 hydrothermal treatment is an effective, clean and easy method to reduce the DDC fractions in suspension without any additional additive or solvent. XRD patterns of fractions after HR and related structural parameters are summarized in Fig. 6 and Table 1, respectively. After HR, the most significant change is the general recovery of the (002) peak at 25.5° at the expense of shifted (002)* driven by the approach of the graphene layers after removal of intercalated oxygenated groups. d002 decreased from 0.75–0.99 to 0.35 nm while the stack size (Lc) was reduced. However, this reduction caused a slight increase in the number of layers (from 2.1–4.5 to 4.4–5.6). This may be attributed to the graphene restacking due to both strong π–π interactions and van der Waals forces between the basal planes of graphene sheets and presence of intercalated water molecules.58–62 This effect is more pronounced for the fractions obtained at higher centrifugation rate, accounting the smaller graphenic domain sizes.
image file: c6ra09679d-f6.tif
Fig. 6 Normalized diffractograms of the DDC fractions after hydrothermal reduction: rF-0, rF-2000, rF-4500, rF-7000, rF-9500 and rF-14[thin space (1/6-em)]800.

Regarding to XPS spectra (Table 2 and Fig. S1 in ESI), after reduction, C/O ratio increased to 4.4–7.8 due to a loss of oxygen functionalities. These values are within the parameters achieved in hydrothermal reduction.53 The degree of reduction depended on the type of starting oxygenated group and oxygen concentration in each GO-based fraction, as showed in Fig. 7(a). According to Bagri et al.,63 the remaining oxygen in reduced GO depends on the proximity of oxygenated groups in the graphene plane, being more difficult the desorption of hydroxyls and epoxy groups at higher concentrations than the transformation to carbonyls and ether groups, which are thermodynamically very stable. On the other hand, HR resulted in precipitation of GO-based supernatants from 7000 rpm and above (filled circles in Fig. 7(a)), which was attributed to the formation of the large size membrane-like structure as previously seen in Fig. 3. As an example, the photographs of F- and rF-7000 before and after the precipitation due to HR are shown in Fig. 7(b). However, these membranes can be broken by sonication restoring the stable suspension in water. Hence, reduction initially had influence on the stability of some suspensions but it could be restored due to remaining oxygenated groups as hydroxyl, epoxy and carboxyl groups involved in the hydrophobicity of GO-based materials.64,65


image file: c6ra09679d-f7.tif
Fig. 7 (a) Relative concentration of oxygenated groups in rGO-based fractions versus initial oxygen concentration (filled circles indicate rGO-based fractions precipitated after reduction); (b) photographs of F- and rF-7000 before and after hydrothermal reduction, respectively.

The crystallinity of nano-sized FLGO sheets (rF-7000), with lateral dimensions <100 nm,56 and rGOQD (rF-9500 and rF-14[thin space (1/6-em)]800) can be appreciated in TEM images of reduced fractions as shown in Fig. 8: small sp2 domains overlap conforming aggregates. Moreover, fractions with larger particles (rF-0, rF-2000 and rF-4500) showed no significant differences after reduction (figures not shown). rGOQD are well defined sp2 particles of around 25–40 nm in diameter (see Fig. 8(c)–(f)), similar to those previously observed for GOQD by AFM (Fig. 5). Lattice parameter was around 0.24 nm consistent with (1120) lattice fringes of graphene,40 confirming the hexagonal structure and high crystallinity of the graphene framework as shown by HRTEM in Fig. 8(f) and (g) and by the fast Fourier transform (FFT) pattern of GOQD in Fig. 8(f).


image file: c6ra09679d-f8.tif
Fig. 8 TEM images of (a) rF-7000, (b) rF-9500 and (c)–(f) rF-14[thin space (1/6-em)]800 after HR. Insets in (f) HRTEM and FFT pattern of dashed region; (g) HRTEM of the graphene lattice in the dashed region in (f).

3.3 Optical properties

GO and rGO-based fractions exhibited different optical properties as a function of size and oxidation state of its components. UV-Vis absorption and PL spectra for GO-based fractions before and after HR are shown in Fig. 9. GO and rGO-based fractions presented absorbance maxima at 232–245 nm and 254–260 nm, respectively (see Fig. 9(a) and (b)), related to π → π* electronic transition of aromatic sp2 domains.66 This peak blue shifted to 232 nm for decreasing sizes in GO-based fractions (inset in Fig. 9(a)), and red shifted to 254–260 nm after reduction (inset in Fig. 9(b)). rF-14[thin space (1/6-em)]800 fraction was exceptionally red shifted to a greater extent as compared to the other fractions. A shoulder around 300 nm (dashed rectangle) observed for GO-based fractions is attributed to n → π* transitions of C[double bond, length as m-dash]O.15 This shoulder disappears after HR owing to the decrease in carboxyl group concentration.
image file: c6ra09679d-f9.tif
Fig. 9 UV/Vis absorption of (a) GO and (b) rGO-based fractions; the insets are the normalized absorbance maxima; (c) PL spectra of GOQD and rGOQD (F- and rF-14[thin space (1/6-em)]800 fractions) at different excitation wavelengths from 205 to 605 nm; (d) GOQD and rGOQD normalized PL maxima from (c); (e) PL emissions for GO and rGO-based fractions excited at 455 and 330 nm, respectively; (f) quantum yields for GO and rGO-based fractions.

GOQD and rGOQD were subjected to a wide range of excitation wavelengths whose PL emissions are collected in Fig. 9(c) and (d), and mainly correspond to yellow (580–588 nm) and violet lights (443–448 nm) after excitation at 455 and 330 nm, respectively. Maximum emission wavelength of GOQD is dependent on the excitation wavelength, shifting from an excitation-independent PL zone ca. 584 nm (where the emission maximum for an excitation wavelength of 455 nm is located) to 660 nm, when excitation was increased gradually from 480 to 605 nm. Thus, GOQD exhibited different emission colors including yellow (in the excitation-independent PL zone), orange and red when they were excited by different excitation wavelengths. The excitation-dependent PL behavior has been ascribed to optical selection of GQD with size polydispersity, free zig-zag sites or electronic conjugate structures.37,67,68 In addition, earlier studies also indicate that the PL position depends on the size of the sp2 clusters isolated by oxidation or defects,15 generating luminescent properties of GQD and GO.69 The corresponding fluorescence confocal microscopy images of GOQD (Fig. S4 in ESI) demonstrated that green and red emissions are collected at the excitation wavelength of 473 nm. On the contrary, in rGOQD the relative excitation-independent PL blue shifted to ca. 443–448 nm, indicating that both the size and the surface state of sp2 clusters were uniform, as previously observed by TEM in Fig. 8. All rGO-based fractions also exhibited similarities among them regarding crystal size and oxidation state as previously seen by XRD (Fig. 6) and XPS (Fig. 7), respectively. Accordingly, GO- and rGO-based fractions showed PL responses not dependent on the particle size as shown in Fig. 9(e), being centered at close positions but decreasing intensities: photoluminescent products of CNF were composed of sp2 carbon domains with similar crystal sizes and oxygenated groups content. Reduction promoted the appearance of a second emission peak appearing at 370 nm for rF-14[thin space (1/6-em)]800 (Fig. 9(e)) that has been attributed to the σ* → n transition that occurs in alcohols, amines and ethers.70

The PLQY measured by using quinine sulfate as standard (Φr = 0.54) varied depending on the fraction and the reduction state, as shown in Fig. 9(e) and (f). For GO and rGO-based fractions obtained below 9500 rpm, mainly composed for large sp2 clusters, PLQY were below 2.3 and 2.7%, respectively. Supernatants at low centrifugation rates (below 4500 rpm) showed PL responses that are difficult to integrate or with very low PLQY. These values for both GO and rGO-based suspensions are similar to those reported in literature: 0–2.2 and 3.9%, respectively.22,27,68 GOQD and rGOQD (F- and rF-14[thin space (1/6-em)]800 fractions) exhibited a PLQY of 5.5 and 7% when they were excited at 355 and 330 nm, respectively. Note that the maximum of GOQD PL emission occurred for an excitation of 455 nm, but it is out of the excitation range for comparison with quinine sulfate (280–380 nm);71 however, as noted above, measurement was performed in the excitation-independent PL zone (i.e., 355 nm).

According to the different PL behavior observed in the fractions, it can be concluded that there are different luminescence mechanisms or emission centers in GOQD and rGOQD. It has been reported that PL derives from quantum size effect, zig-zag sites and defect effect.13,37,69 Quantum size effect and zig-zag sites have been classified as intrinsic state emission while the defect effect as defect state emission, being the final PL emission a combination of both.33 Defect state emission involves surface oxygenated groups present in both GOQD and rGOQD and they are responsible of the red shift of the PL response. On the contrary, the formation of intrinsic state in rGOQD leads to blue PL emission.33–35 Hence, GOQD and GO-based fractions contain disorder induced defect states within π–π* gap and exhibit a broad PL at longer wavelengths (maxima above 570 nm). After reduction, the number of these defect states decreases and intrinsic states increases by forming isolated sp2 domains that exhibit a narrow blue PL at shorter wavelengths (maxima below 460 nm).

4. Conclusions

GOQD from fishbone carbon nanofibers were obtained by a modified Hummers method and separated by degressive differential centrifugation. A fraction with a yield as high as 42 wt% led to photoluminescence response, including GOQD or GO-based fractions with active sp2 domains. Also other valuable products were effectively separated, namely: expanded CNF and FLGO sheets. GOQD showed an excitation-dependent photoluminescent emission with a maximum at 578 nm (yellow) for an excitation of 455 nm. Hydrothermal reduction blue shifted the PL response to the violet light region (448 nm at an excitation of 330 nm) after partial removal of hydroxyl and epoxide groups from basal planes and recovering of graphene network. The photoluminescence quantum yield was dependent on the size and the oxidation state, being the maxima at 5.5 and 7% for GOQD and rGOQD, respectively, in supernatants at 14[thin space (1/6-em)]800 rpm.

Acknowledgements

This work was funded by FEDER and the Spanish Economy and Competitiveness Ministry (MINECO) (ENE2011-28318-C03-01 and ENE2014-52189-C02-01-R). DT thanks for the award of his PhD under the frame of ENE2011-28318-C03-01 project. JLP thanks MINECO for his Ramon y Cajal research contract (RYC-2013-12494). The microscopy works have been conducted in the “Laboratorio de Microscopías Avanzadas” at “Instituto de Nanociencia de Aragón – Universidad de Zaragoza”. Authors acknowledge the LMA-INA for offering access to their instruments and expertise.

References

  1. K. S. Novoselov, V. I. Fal'ko, L. Colombo, P. R. Gellert, M. G. Schwab and K. Kim, Nature, 2012, 490, 192–200 CrossRef CAS PubMed.
  2. M. Terrones, A. R. Botello-Méndez, J. Campos-Delgado, F. López-Urías, Y. I. Vega-Cantú, F. J. Rodríguez-Macías, A. L. Elías, E. Muñoz-Sandoval, A. G. Cano-Márquez and J.-C. Charlier, Nano Today, 2010, 5, 351–372 CrossRef.
  3. N. Maity, A. Kuila, S. Das, D. Mandal, A. Shit and A. K. Nandi, J. Mater. Chem. A, 2015, 3, 20736–20748 CAS.
  4. L. Li, G. Wu, G. Yang, J. Peng, J. Zhao and J.-J. Zhu, Nanoscale, 2013, 5, 4015–4039 RSC.
  5. X. Li, M. Rui, J. Song, Z. Shen and H. Zeng, Adv. Funct. Mater., 2015, 25, 4929–4947 CrossRef CAS.
  6. K. S. Novoselov, A. K. Geim, S. V. Morozov, D. Jiang, M. I. Katsnelson, I. V. Grigorieva, S. V. Dubonos and A. A. Firsov, Nature, 2005, 438, 197–200 CrossRef CAS PubMed.
  7. J. Shen, Y. Zhu, X. Yang and C. Li, Chem. Commun., 2012, 48, 3686–3699 RSC.
  8. F. Bonaccorso, Z. Sun, T. Hasan and A. C. Ferrari, Nat. Photonics, 2010, 4, 611–622 CrossRef CAS.
  9. X. Li, X. Wang, L. Zhang, S. Lee and H. Dai, Science, 2008, 319, 1229–1232 CrossRef CAS PubMed.
  10. L. A. Ponomarenko, F. Schedin, M. I. Katsnelson, R. Yang, E. W. Hill, K. S. Novoselov and A. K. Geim, Science, 2008, 320, 356–358 CrossRef CAS PubMed.
  11. Y. Wang and N. Herron, J. Phys. Chem., 1991, 95, 525–532 CrossRef CAS.
  12. L.-S. Li and X. Yan, J. Phys. Chem. Lett., 2010, 1, 2572–2576 CrossRef CAS.
  13. D. Pan, J. Zhang, Z. Li and M. Wu, Adv. Mater., 2010, 22, 734–738 CrossRef CAS PubMed.
  14. Z. Zhang, J. Zhang, N. Chen and L. Qu, Energy Environ. Sci., 2012, 5, 8869–8890 CAS.
  15. G. Eda, Y.-Y. Lin, C. Mattevi, H. Yamaguchi, H.-A. Chen, I. S. Chen, C.-W. Chen and M. Chhowalla, Adv. Mater., 2010, 22, 505–509 CrossRef CAS PubMed.
  16. S. Kim, S. W. Hwang, M.-K. Kim, D. Y. Shin, D. H. Shin, C. O. Kim, S. B. Yang, J. H. Park, E. Hwang, S.-H. Choi, G. Ko, S. Sim, C. Sone, H. J. Choi, S. Bae and B. H. Hong, ACS Nano, 2012, 6, 8203–8208 CrossRef CAS PubMed.
  17. A. H. Castro Neto, F. Guinea, N. M. R. Peres, K. S. Novoselov and A. K. Geim, Rev. Mod. Phys., 2009, 81, 109–162 CrossRef CAS.
  18. S. H. Jin, D. H. Kim, G. H. Jun, S. H. Hong and S. Jeon, ACS Nano, 2013, 7, 1239–1245 CrossRef CAS PubMed.
  19. X. Sun, Z. Liu, K. Welsher, J. T. Robinson, A. Goodwin, S. Zaric and H. Dai, Nano Res., 2008, 1, 203–212 CrossRef CAS PubMed.
  20. L. Wang, S.-J. Zhu, H.-Y. Wang, S.-N. Qu, Y.-L. Zhang, J.-H. Zhang, Q.-D. Chen, H.-L. Xu, W. Han, B. Yang and H.-B. Sun, ACS Nano, 2014, 8, 2541–2547 CrossRef CAS PubMed.
  21. Z. Luo, P. M. Vora, E. J. Mele, A. T. C. Johnson and J. M. Kikkawa, Appl. Phys. Lett., 2009, 94, 111909 CrossRef.
  22. Q. Mei, K. Zhang, G. Guan, B. Liu, S. Wang and Z. Zhang, Chem. Commun., 2010, 46, 7319–7321 RSC.
  23. M.-H. Jang, H. D. Ha, E.-S. Lee, F. Liu, Y.-H. Kim, T. S. Seo and Y.-H. Cho, Small, 2015, 11, 3773–3781 CrossRef CAS PubMed.
  24. Y. Dong, C. Chen, X. Zheng, L. Gao, Z. Cui, H. Yang, C. Guo, Y. Chi and C. M. Li, J. Mater. Chem., 2012, 22, 8764–8766 RSC.
  25. H. Sun, L. Wu, N. Gao, J. Ren and X. Qu, ACS Appl. Mater. Interfaces, 2013, 5, 1174–1179 CAS.
  26. J. Wei, J. Qiu, L. Ren, K. Zhang, S. Wang and B. Weeks, Sci. Adv. Mater., 2014, 6, 1052–1059 CrossRef CAS.
  27. F. Jiang, D. Chen, R. Li, Y. Wang, G. Zhang, S. Li, J. Zheng, N. Huang, Y. Gu, C. Wang and C. Shu, Nanoscale, 2013, 5, 1137–1142 RSC.
  28. L.-L. Li, J. Ji, R. Fei, C.-Z. Wang, Q. Lu, J.-R. Zhang, L.-P. Jiang and J.-J. Zhu, Adv. Funct. Mater., 2012, 22, 2971–2979 CrossRef CAS.
  29. L. Lin and S. Zhang, Chem. Commun., 2012, 48, 10177–10179 RSC.
  30. E. Lee, J. Ryu and J. Jang, Chem. Commun., 2013, 49, 9995–9997 RSC.
  31. T. Fan, W. Zeng, W. Tang, C. Yuan, S. Tong, K. Cai, Y. Liu, W. Huang, Y. Min and A. J. Epstein, Nanoscale Res. Lett., 2015, 10, 55 CrossRef PubMed.
  32. J. Shen, Y. Zhu, C. Chen, X. Yang and C. Li, Chem. Commun., 2011, 47, 2580–2582 RSC.
  33. S. Zhu, J. Zhang, S. Tang, C. Qiao, L. Wang, H. Wang, X. Liu, B. Li, Y. Li, W. Yu, X. Wang, H. Sun and B. Yang, Adv. Funct. Mater., 2012, 22, 4732–4740 CrossRef CAS.
  34. F. Liu, M.-H. Jang, H. D. Ha, J.-H. Kim, Y.-H. Cho and T. S. Seo, Adv. Mater., 2013, 25, 3657–3662 CrossRef CAS PubMed.
  35. C.-T. Chien, S.-S. Li, W.-J. Lai, Y.-C. Yeh, H.-A. Chen, I. S. Chen, L.-C. Chen, K.-H. Chen, T. Nemoto, S. Isoda, M. Chen, T. Fujita, G. Eda, H. Yamaguchi, M. Chhowalla and C.-W. Chen, Angew. Chem., Int. Ed., 2012, 51, 6662–6666 CrossRef CAS PubMed.
  36. Z. Wang, H. Zeng and L. Sun, J. Mater. Chem. C, 2015, 3, 1157–1165 RSC.
  37. S. Zhu, J. Zhang, C. Qiao, S. Tang, Y. Li, W. Yuan, B. Li, L. Tian, F. Liu, R. Hu, H. Gao, H. Wei, H. Zhang, H. Sun and B. Yang, Chem. Commun., 2011, 47, 6858–6860 RSC.
  38. Y. Shin, J. Lee, J. Yang, J. Park, K. Lee, S. Kim, Y. Park and H. Lee, Small, 2014, 10, 866–870 CrossRef CAS PubMed.
  39. Y. Sun, S. Wang, C. Li, P. Luo, L. Tao, Y. Wei and G. Shi, Phys. Chem. Chem. Phys., 2013, 15, 9907–9913 RSC.
  40. J. Peng, W. Gao, B. K. Gupta, Z. Liu, R. Romero-Aburto, L. Ge, L. Song, L. B. Alemany, X. Zhan, G. Gao, S. A. Vithayathil, B. A. Kaipparettu, A. A. Marti, T. Hayashi, J.-J. Zhu and P. M. Ajayan, Nano Lett., 2012, 12, 844–849 CrossRef CAS PubMed.
  41. Y. Dong, J. Lin, Y. Chen, F. Fu, Y. Chi and G. Chen, Nanoscale, 2014, 6, 7410–7415 RSC.
  42. X. Zhou, Y. Zhang, C. Wang, X. Wu, Y. Yang, B. Zheng, H. Wu, S. Guo and J. Zhang, ACS Nano, 2012, 6, 6592–6599 CrossRef CAS PubMed.
  43. N. Fuyuno, D. Kozawa, Y. Miyauchi, S. Mouri, R. Kitaura, H. Shinohara, T. Yasuda, N. Komatsu and K. Matsuda, Adv. Opt. Mater., 2014, 2, 983–989 CrossRef CAS.
  44. D. Wang, L. Wang, X. Dong, Z. Shi and J. Jin, Carbon, 2012, 50, 2147–2154 CrossRef CAS.
  45. U. Khan, A. O'Neill, H. Porwal, P. May, K. Nawaz and J. N. Coleman, Carbon, 2012, 50, 470–475 CrossRef CAS.
  46. S. Ciftan Hens, W. G. Lawrence, A. S. Kumbhar and O. Shenderova, J. Phys. Chem. C, 2012, 116, 20015–20022 CAS.
  47. R. Ye, C. Xiang, J. Lin, Z. Peng, K. Huang, Z. Yan, N. P. Cook, E. L. G. Samuel, C.-C. Hwang, G. Ruan, G. Ceriotti, A.-R. O. Raji, A. A. Martí and J. M. Tour, Nat. Commun., 2013, 4, 2943 Search PubMed.
  48. J. Luo, L. J. Cote, V. C. Tung, A. T. L. Tan, P. E. Goins, J. Wu and J. Huang, J. Am. Chem. Soc., 2010, 132, 17667–17669 CrossRef CAS PubMed.
  49. S. De Llobet, J. L. Pinilla, R. Moliner, I. Suelves, J. Arroyo, F. Moreno, M. Muñoz, C. Monné, I. Cameán, A. Ramos, N. Cuesta and A. B. Garcia, Int. J. Hydrogen Energy, 2013, 38, 15084–15091 CrossRef CAS.
  50. W. S. Hummers and R. E. Offeman, J. Am. Chem. Soc., 1958, 80, 1339 CrossRef CAS.
  51. S. Park and R. S. Ruoff, Nat. Nanotechnol., 2009, 4, 217–224 CrossRef CAS PubMed.
  52. D. Torres, J. L. Pinilla, R. Moliner and I. Suelves, Carbon, 2015, 81, 405–417 CrossRef CAS.
  53. Y. Zhou, Q. Bao, L. A. L. Tang, Y. Zhong and K. P. Loh, Chem. Mater., 2009, 21, 2950–2956 CrossRef CAS.
  54. Z. Q. Li, C. J. Lu, Z. P. Xia, Y. Zhou and Z. Luo, Carbon, 2007, 45, 1686–1695 CrossRef CAS.
  55. R. Franklin, Acta Crystallogr., 1951, 4, 253–261 CrossRef CAS.
  56. R. Raccichini, A. Varzi, S. Passerini and B. Scrosati, Nat. Mater., 2015, 14, 271–279 CrossRef CAS PubMed.
  57. H. Estrade-Szwarckopf, Carbon, 2004, 42, 1713–1721 CrossRef CAS.
  58. H.-M. Ju, S. H. Huh, S.-H. Choi and H.-L. Lee, Mater. Lett., 2010, 64, 357–360 CrossRef CAS.
  59. S. Stankovich, D. A. Dikin, R. D. Piner, K. A. Kohlhaas, A. Kleinhammes, Y. Jia, Y. Wu, S. T. Nguyen and R. S. Ruoff, Carbon, 2007, 45, 1558–1565 CrossRef CAS.
  60. D. R. Dreyer, S. Park, C. W. Bielawski and R. S. Ruoff, Chem. Soc. Rev., 2010, 39, 228–240 RSC.
  61. M. Acik, C. Mattevi, C. Gong, G. Lee, K. Cho, M. Chhowalla and Y. J. Chabal, ACS Nano, 2010, 4, 5861–5868 CrossRef CAS PubMed.
  62. J. H. Lee, N. Park, B. G. Kim, D. S. Jung, K. Im, J. Hur and J. W. Choi, ACS Nano, 2013, 7, 9366–9374 CrossRef CAS PubMed.
  63. A. Bagri, C. Mattevi, M. Acik, Y. J. Chabal, M. Chhowalla and V. B. Shenoy, Nat. Chem., 2010, 2, 581–587 CrossRef CAS PubMed.
  64. A. Lerf, H. He, T. Riedl, M. Forster and J. Klinowski, Solid State Ionics, 1997, 101–103(2), 857–862 CrossRef CAS.
  65. J. Kim, L. J. Cote and J. Huang, Acc. Chem. Res., 2012, 45, 1356–1364 CrossRef CAS PubMed.
  66. L. Tang, R. Ji, X. Cao, J. Lin, H. Jiang, X. Li, K. S. Teng, C. M. Luk, S. Zeng, J. Hao and S. P. Lau, ACS Nano, 2012, 6, 5102–5110 CrossRef CAS PubMed.
  67. S. N. Baker and G. A. Baker, Angew. Chem., Int. Ed., 2010, 49, 6726–6744 CrossRef CAS PubMed.
  68. Y. Dong, J. Shao, C. Chen, H. Li, R. Wang, Y. Chi, X. Lin and G. Chen, Carbon, 2012, 50, 4738–4743 CrossRef CAS.
  69. K. P. Loh, Q. Bao, G. Eda and M. Chhowalla, Nat. Chem., 2010, 2, 1015–1024 CrossRef CAS PubMed.
  70. M. Li, S. K. Cushing, X. Zhou, S. Guo and N. Wu, J. Mater. Chem., 2012, 22, 23374–23379 RSC.
  71. A. M. Brouwer, Pure Appl. Chem., 2011, 83, 2213–2228 CrossRef CAS.

Footnote

Electronic supplementary information (ESI) available. See DOI: 10.1039/c6ra09679d

This journal is © The Royal Society of Chemistry 2016