A mild AlCl3-catalyzed ethanol pretreatment and its effects on the structural changes of Eucalyptus wood lignin and the saccharification efficiency

Bing Wang, Xiao-Jun Shen, Jia-Long Wen* and Run-Cang Sun*
Beijing Key Laboratory of Lignocellulosic Chemistry, Beijing Forestry University, Beijing, 100083, China. E-mail: wenjialonghello@126.com; rcsun3@bjfu.edu.cn

Received 14th April 2016 , Accepted 1st June 2016

First published on 2nd June 2016


Abstract

Ethanol organosolv pretreatment of biomass has been deemed as a green and environmentally friendly process. Lewis acid is regarded as a highly efficient catalyst in the pretreatment and conversion of biomass. In this work, Eucalyptus wood was pretreated by an ethanol/water solution (EWS) with or without aluminium chloride (AlCl3) catalyst, and the effects of the catalyst and pretreatment temperature on the structural characteristics of lignin, as well as the enzymatic hydrolysis of the substrates, have been thoroughly investigated. The comprehensive results showed that the lignins collected during the EWS pretreatment with AlCl3 catalyst exhibited smaller molecular weights (Mw), less β-O-4 linkages and more phenolic hydroxyl content, compared to those without AlCl3 catalyst. Additionally, GPC and NMR results revealed that the structural characteristics of the lignin obtained at 130 °C with AlCl3 were similar to those of lignin achieved at 180 °C without AlCl3 catalyst. Moreover, EWS pretreatment with AlCl3 catalyst improved the delignification ratio, degradation of hemicelluloses, and generated a higher crystallinity and surface area of the pretreated substrates compared to without the AlCl3 catalyst. Furthermore, the relatively mild pretreatment process (160 °C, 60 min) remarkably enhanced the enzymatic hydrolysis of substrates to a maximum value of 95.02%. Therefore, the EWS pretreatment with AlCl3 catalyst is an environmentally benign and advantageous scheme for the production of lignin with low Mw and high chemical reactivity, and more easily digestible substrates, which will be further transformed into value-added biomaterials and bioethanol.

1. Introduction

With the increasing depletion of fossil fuels and worsening of the environment worldwide, interest in the search for alternative energy sources has been increasing recently.1,2 Lignocellulosic materials are viewed as sustainable and reproducible resources on earth, providing alternatives for biofuels, biochemical, and biomaterials. Lignocelluloses are primarily composed of cellulose, hemicelluloses, and lignin. Traditionally, cellulose fibres are used for the production of pulp and paper, meanwhile, plentiful amounts of lignin are generated as a by-product in the traditional pulp and paper industry.3 The main purpose of fractionation of biomass based on biorefinery is to achieve the separation of cellulose, hemicelluloses, and lignin through an effective way from lignocelluloses, in which the isolated fractions can be further converted into a wide variety of highly valued products such as ethanol, xylitol, and food additives.4–7

Lignin is the most abundant natural phenolic polymer that accounts for 25–35% of biomass. In generally, the molecular structure of lignin is largely composed of p-coumaryl alcohol (H), coniferyl alcohol (G), and sinapyl alcohol (S).8,9 In detail, lignin is an amorphous polymer that is comprised of different substructures e.g. β-O-4, α-O-4, 4-O-5, β-β, β-1, β-5, and 5-5 linkages, depending both on the biological species and the chemical method used for its extraction.10 In plant cell wall, lignin covalently links to hemicelluloses, and hemicelluloses serve as the chemical cross-linkers between lignin and cellulose fibres. These linkages restrict the understanding of lignin chemistry because of the inability to isolate lignin in its native state from plant fibres.11 In addition, the chemical cross-linking bonds among the components limits the conversion of the three components (lignin, hemicelluloses, and cellulose) into valuable products. Therefore, an efficient pretreatment method must be developed to obtain a high quality of lignin and improve the enzymatic hydrolysis to pretreated substrates.

Traditionally, lignin that is obtained as a by-product of the kraft pulping process has a high content of sulphur and is primarily burned for thermal energy production and sulphur recycling. Despite the major advances that have been achieved in the utilization of lignin, especially kraft lignin and lignosulphonates, there is new interest in the development and utilization of sulfur-free lignin.12 The sulfur-free lignin (also named as “biorefinery lignin”) with high activity could be achieved from lignocelluloses after pretreatment technologies, such as organosolv, steam explosion, alkaline treatment, and ionic liquid pretreatment.13–16 Additionally, pretreatment is also a necessary process to reduce cellulose crystallinity, increasing biomass porosity, thus improving enzymatic accessibility in biorefinery.17 Among the lignocellulosic biomass pretreatments, organic solvent pretreatment is favoured by its inherent advantages, such as low cost and ease of recovery.11,13 In organic solvent pretreatments, ethanol organosolv pretreatment has been recently attracting increasing interest since the main product (ethanol) of the bioprocess is easy to recovery, as well as other benefits such as a lack of toxicity, low solvent price, and full miscibility with water.11,18 However, the use of mineral acid catalyst (H2SO4 and HCl) causes equipment corrosion, transportation difficulties, and even hinders its further utilization such as the degradation of chemicals and the modification of lignin-based materials. In addition, in the ethanol organosolv pretreatment without catalysts, high cooking temperatures (>185 °C) are required to acidify the solvent liquor by acetyl groups released from hemicelluloses hydrolysis, and the delignification and dissociation effects are also related to the feedstock applied.13,19 A decade ago, different Lewis acids (chloride salts) had been initially proposed to improve the methanol/water organosolv fractionation of softwood biomass (spruce wood) at a high temperature (205 °C).20 Subsequently, MgCl2-catalytic organosolv pretreatment of two kinds of biomass (wheat straw and willow wood) for enzymatic saccharification was performed at 190 °C, which improved the performance of selective delignification of willow wood.21 More recently, Lewis acids have been used as catalysts in the organosolv pulping of wheat straw under 160 °C for 2 h, and the chemical structures of the lignin obtained through MgCl2, FeCl2, CuCl2, FeCl3, and ZrCl2-catalyzed organosolv pretreatments have been investigated.22 Alternatively, Lewis acid (AlCl3) assisted ethanol (50%) pulping of beech wood was also performed from 150 °C to 190 °C, and the results showed that the mineral acid catalyst can be completely replaced by Lewis acids if the purpose of the process is to produce furfuralic compounds.23 However, as a frequently used metal chloride, aluminium chloride (AlCl3), the effects of its addition and pretreatment temperature on the structural changes of lignin and subsequent enzymatic saccharification of the pretreated substrates have not been investigated. Therefore, the pretreatment process of ethanol/water solution (EWS) with AlCl3 catalyst needs to be investigated for achieving efficient delignification and obtaining more digestible substrates for glucose production.

Eucalyptus, the first fast-growing hardwood in China, was chosen as a raw material. In the present study, the Eucalyptus was subjected to the EWS process with the addition of AlCl3 under different temperatures to fractionate lignin and pretreated substrates. In addition, the structural characteristics, such as molecular weights, chemical composition (S/G ratio), amount of main linkages (inter-coupling bonds, β-O-4, β-β, β-5, etc.), and hydroxyl groups, were characterized by state-of-the-art techniques, e.g. gel permeation chromatography (GPC), 2D heteronuclear single quantum coherence (2D-HSQC), quantitative 13C, and 31P nuclear magnetic resonance (NMR) techniques. Moreover, the structural and morphological changes of the pretreated substrates obtained during the pretreatment were characterized by X-ray diffraction (XRD), solid-state CP/MAS 13C NMR spectroscopy, scanning electron microscopy (SEM), and high performance anion exchange chromatography (HPAEC). Furthermore, the influence of this pretreatment on the enzymatic hydrolysis efficiency of Eucalyptus was also evaluated. It is believed that these results will facilitate commercial exploitation of Eucalyptus for the production of bioethanol and lignin in the current biorefinery industry.

2. Experimental section

2.1. Materials

Eucalyptus chips were prepared from Eucalyptus grandis × Eucalyptus urophylla wood (5 years old, Guangxi province, China). Eucalyptus chips were shattered into powder (40–60 mesh) using a plant miniature crusher, followed by benzene/ethanol (2[thin space (1/6-em)]:[thin space (1/6-em)]1, v/v) extraction for 8 h, and then dried at 60 °C. The chemical composition (%, w/w) was 44.20% glucan, 16.57% xylan, 1.06% mannan, 0.82% rhamnan, 0.31% arabinan, 25.19% Klason lignin, and 1.73% acid soluble lignin (ASL) according to the NREL standard analytical procedure.24 Solvents and reagents were purchased from Sinopharm Chemical Reagent Beijing Co., Ltd and the analytical chemicals used were purchased from Sigma-Aldrich.

2.2. EWS pretreatment with or without AlCl3 catalyst

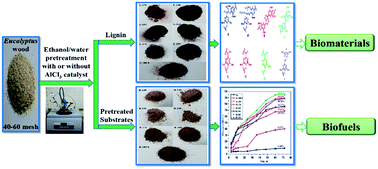
The scheme of EWS pretreatment with or without AlCl3 catalyst is depicted in Fig. S1. The Eucalyptus powder was pretreated by EWS with or without AlCl3 catalyst in a 100 mL stainless steel autoclave (Sen Long Instruments Company, Beijing, China) with magnetic stirring at a solid to liquor ratio of 1[thin space (1/6-em)]:[thin space (1/6-em)]10 (g mL−1). The Eucalyptus power (7 g) was added to 50% EWS (70 mL) with or without AlCl3 catalyst (0.02 M), then the batch reactor was heated to 130, 140, 150, 160, 170, or 180 °C, and the reactor was agitated at 1000 rpm to provide homogenised mixing of the feedstock in the tube reactor. After the setting temperature was achieved, the reaction time was started and the temperature was constantly maintained. After 60 min, the reactor was immediately cooled by passing cold water into the external jacket until ambient temperature was reached. The reaction mixture was filtrated with a Buchner funnel. The filtrate was concentrated to about 5–10 mL at 50 °C under reduced pressure in a rotary evaporator and then poured into 50–100 mL acidic water (pH = 2.0, adjusted by HCl) to precipitate and purify lignin. The lignin fractions were obtained by centrifugation and freeze-dried. The solid residues were washed with distilled water and further freeze-dried. These were named as pretreated substrates such as R-180-0 (without catalyst at 180 °C), R-180, R-170, R-160, R-150, R-140, and R-130 (with catalyst at 180–130 °C).

2.3. Enzymatic saccharification

To investigate the effects of EWS pretreatment on the digestibility of the pretreated substrates, enzymatic digestibility and saccharification was performed under 2% substrate concentration (0.5 g substrates in 25 mL sodium acetate buffer (50 mM, pH = 4.8, adjusted by acetic acid)) in a 50 mL flask at 50 °C in incubators (ZWYR-2102C) (Shanghai, China) at 150 rpm for 72 h. Commercial cellulase (Cellic® CTec2, 100 FPU mL−1) was kindly provided from novozymes (Beijing, China) and employed for all saccharification experiments (15 FPU per g substrate). The hydrolysates were analysed by a HPAEC (Dionex, ICS 3000, U.S.) system equipped with an integral amperometric detector and CarboPac PA 100 (4 × 250 mm, Dionex) analytical column.25

2.4. Characterization of the lignin samples

The molecular weights of the lignin fractions were determined by GPC with an ultraviolet (UV) detector at 240 nm on a PL-gel 10 mm mixed-B 7.5 mm i.d. column based on a previous literature method. The column used was a PL-gel 10 mm mixed-B 7.5 mm i.d. column, which was calibrated with PL polystyrene standards. The lignin samples (2 g) without acetylation were dissolved in 4 mL of tetrahydrofuran (THF), and 20 μL lignin solutions were injected. The column was operated at ambient temperature and eluted with THF at a flow rate of 1.0 mL min−1. NMR spectra of lignins were conducted on a Bruker NMR spectrometer (AVIII, 400 MHz). For the quantitative 13C NMR spectra (C13IG), lignin (140 mg) was dissolved in 0.5 mL of DMSO-d6 and 20 μL relaxation agent (0.01 M chromium(III)acetylacetonate) was added in the sample tube.26 For 2D-HSQC spectra, 60 mg of lignin was dissolved in 0.5 mL of DMSO-d6 and the sequence was conducted according to literature methods.27 Quantitative 31P NMR spectra were conducted according to the literature methods.28 The standard parameters of the 31P NMR experiment are listed as follows: pulse angle 30°, relaxation delay (d1) 2 s, data points 64 K, and scan 1024. Lignin (20 mg) was dissolved in 500 μL anhydrous CDCl3/pyridine (1[thin space (1/6-em)]:[thin space (1/6-em)]1.6, v/v, liquid A). 100 μL cyclohexanol solution (10.85 mg mL−1, in liquid A) and 100 μL chromium(III)acetylacetonate solution (5 mg mL−1, in liquid A) were added. 100 μL phosphorylating agents (2-chloro-4,4,5,5-tetramethyl-1,3,2-dioxaphospholane; TMDP) was added into the above solution and the mixture was kept for 10 min. The final phosphatized sample was transferred into a 5 mm NMR tube for subsequent determination.

2.5. Characterization of raw material and the pretreated substrates

The component analysis of the raw material and the pretreated substrates were performed according to the procedures provided by the NREL.24 Analyses of the carbohydrates in the substrates were accomplished by a HPAEC system (Dionex ICS3000, US), which was equipped with an AS50 autosampler, a pulsed amperometric detector, a Carbopac TM PA-20 column (4 × 250 mm, Dionex), and a guard PA-20 column (3 × 30 mm, Dionex) according to the previous literature method.25 XRD was recorded using an XRD-6000 instrument (Shimadzu, Japan) as previously reported.25 CP/MAS 13C NMR spectra of the substrates were obtained at 100.6 MHz using a Bruker NMR spectrometer (AV-III, 400 M Germany). SEM images were obtained with a Hitachi instrument (S-3400N II) (Hitachi, Japan).

3. Results and discussion

3.1. The delignification effects of the pretreatment process

To evaluate the effects of AlCl3 addition and pretreatment temperatures on the delignification and subsequent enzymatic hydrolysis, Eucalyptus wood was subjected to the EWS pretreatment from 130 °C to 180 °C with the addition of AlCl3. The effects of pretreatment temperatures on the delignification ratios and yields of lignin during the EWS process have been investigated, and the results are given in Table 1. It was found that the delignification ratio increased from 45.55% to 83.26%, and the maximum value was achieved at 150 °C. With further increases of pretreatment temperature, the delignification ratio began to decrease, and finally declined to 64.48% at harsh pretreatment condition (180 °C). The decreased delignification ratio was probably due to the formation of “repolymerised lignin” under acidic conditions at higher temperatures. In fact, the critical role of “depolymerisation/repolymerisation” on the delignification of wood was discussed previously.29
Table 1 Weight-average molecular weight (Mw), number-average (Mn) molecular weight, polydispersity (Mw/Mn), delignification ratio, and yields of the lignin
  L-180-0 L-180 L-170 L-160 L-150 L-140 L-130
a Delignification ratio = [(weight of KL in the raw material − weight of residue after delignification × weight percentage of KL in the residue after delignification)/weight of Klason lignin in the raw material] × 100%.
Delignification ratioa (%) 49.86 64.48 61.70 77.12 83.26 75.31 45.55
Mw 2600 1400 1680 2210 690 1970 2730
Mn 840 500 700 920 250 620 780
Mw/Mn 3.1 2.8 2.4 2.4 2.8 3.2 3.5


3.2. Molecular weight analysis of the lignin fractions

The molecular weight (Mw) changes of lignin can provide important insights into lignin depolymerisation during the EWS pretreatment process. As shown in Table 1, the Mw of lignin obtained during the EWS pretreatment process varied from 690 to 2730 g mol−1, which were lower than that of the original lignin from Eucalyptus chips (5160 g mol−1),33 implying that the EWS pretreatment process facilitates the depolymerisation of lignin. Additionally, the molecular weight of lignin obtained without AlCl3 catalyst at 180 °C was 2600 g mol−1, which was higher than those obtained with AlCl3 at 140–180 °C. The results suggested that addition of AlCl3 significantly degraded the lignin in wood to varying degrees at different temperatures, which was also revealed by the reduced contents of β-O-4 linkages as determined by 2D-HSQC spectra. As the temperature increased from 130 to 150 °C, the molecular weight steady declined from 2730 to 690 g mol−1, while the molecular weight of L-160 began to increase to 2210 g mol−1, suggesting that the depolymerisation and repolymerisation of lignin were competitive reactions under acidic conditions and the repolymerisation reaction was the dominant reaction.29 Interestingly, the molecular weight and polydispersity index (PI = Mw/Mn) of L-130 was similar to those of L-180-0, implying that the chemical structures of L-130 and L-180-0 were possibly similar, which will be verified in the following NMR section.

3.3. Compositional analysis of the raw material and the pretreated substrates

To investigate the effect of EWS pretreatment on the chemical constitution of Eucalyptus wood, the compositional analysis of raw materials and the pretreated substrates were obtained. As shown in Table 2, for the raw material, cellulose (glucan) was the major component accounting for 44.48% based on the dry biomass. Hemicelluloses were measured as xylan, mannan, galactan, arabinan, and rhamnan, accounting for 19.28%, and the content of Klason lignin was 25.19%. After the EWS pretreatment, the contents of hemicelluloses in the pretreated substrates gradually decreased with the increase of reaction temperature. In addition, the content of hemicelluloses in R-180-0 was 12.66%, which were higher than those (from trace amount to 6.37%) catalysed by AlCl3 at different temperatures (R-180 to R-130). The reason for this decrease was mostly attributable to the degradation of hemicelluloses. It was reported that EWS pretreatment with AlCl3 resulted in the degradation of hemicelluloses by selectively hydrolysing glycosidic linkages, liberating O-acetyl groups and other acid moieties to form acetic and uronic acids, which were thought to depolymerize hemicelluloses under higher temperatures (>150 °C).30 By contrast, the content of cellulose in the pretreated substrates first increased from 50.06% in R-130 to 62.93% in R-150, while it was decreased to 62.93%, 56.58%, and 54.49% in R-160, R-170 and R-180, respectively. The reasons for the slight decrease are attributed to the removal of lignin and the degradation of hemicelluloses that associate with cellulose in wood for the protection of cellulose;31 thus, the cellulose in the substrates was probably degraded in the EWS (with AlCl3) pretreatment under a higher temperature. Additionally, the content of lignin in the pretreated substrates decreased from 20.42% to 11.10% with the increase of temperature from 130 °C to 150 °C, while it slightly increased to 13.2% in R-160. With the further increase of pretreatment temperature, the content of Klason lignin sharply increased to 22.46% for R-170 and 25.97% for R-180. Meanwhile, the content of the corresponding ASL varied from 1.10% to 1.80%. In short, the relatively high lignin content observed in the pretreated substrates under high temperature was mainly ascribed to the removal of hemicelluloses. Another explanation for the increase was probably due to the formation of pseudo-lignin.32 Moreover, the lignin and hemicellulose contents in the pretreated substrates (R-130 to R-180) catalysed by AlCl3 were significantly lower than those without AlCl3 (R-180-0), implying that the addition of AlCl3 in EWS could effectively remove lignin and hemicelluloses from the raw feedstocks.
Table 2 Chemical composition of raw material and pretreated substrates
Sample Substrate composition (w/w, %)
Rhamnan Arabinan Galactan Glucan Xylan Mannan KLb ASLc Total (%)
a Tr, trace.b KL, Klason lignin (i.e., acid insoluble lignin).c ASL, acid soluble lignin.
R 0.82 0.31 0.98 44.20 16.57 1.06 25.19 1.73 90.42
R-180-0 Tra Tr Tr 58.06 11.68 0.98 20.17 1.26 92.15
R-180 Tr Tr Tr 54.49 Tr Tr 25.97 1.80 82.26
R-170 Tr Tr Tr 56.58 0.13 Tr 22.46 1.67 80.84
R-160 Tr Tr Tr 62.63 1.09 0.09 13.20 1.51 78.52
R-150 Tr Tr Tr 62.93 2.15 0.59 11.10 1.46 78.23
R-140 Tr Tr Tr 60.30 3.72 0.90 12.19 1.25 78.36
R-130 Tr Tr Tr 58.06 5.43 0.94 20.42 1.10 85.95


3.4. NMR analysis of the lignin fractions

3.4.1. Quantitative 13C NMR analysis. The quantitative 13C NMR technique is constantly used to track changes in the chemical linkages of lignin during pretreatment.34–36 As shown in the aromatic region (153–103 ppm) of L-130, L-150, L-180, and L-180-0 (Fig. S2), the syringyl units were detected by the signals located at 152.3 ppm (etherified S3,5), 147.7 ppm (non-etherified S3,5), 138.2 ppm (etherified S4), 135.0 ppm (etherified S1), and 104.3 ppm (normal S2,6). The guaiacyl units give signals at 149.3 ppm (etherified G3), 146.0 ppm (etherified G4), 135.0 ppm (etherified G1), 119.2 ppm (G6), 115.2 ppm (G5), and 111.6 ppm (G2). The signals aforementioned revealed that the lignin fractions belonged to the typical hardwood lignin family. In addition, the new signal at 126.7 ppm in lignin samples was probably assigned to the C-5 in non-etherified 5-5 linkages as compared to the original EMAL,33 suggesting that the condensed 5-5 linkages were formed after the EWS pretreatment. The methoxy group (OCH3, 58.0–54.0 ppm) regions can be used to evaluate quantitative information on the structural changes of the lignins during the EWS pretreatments (Table 3). Further quantification showed that the contents of aromatic C–C linkages in L-130, L-150, and L-180 were increased with the elevation of temperature, indicating that the C–C linkages were formed under the higher temperatures. The content of OCH3 was also decreased with elevated temperature, implying that the high temperature facilitates demethoxylation. Furthermore, it was worth noting that the values of OCH3, aromatic C–H, and aromatic C–C in L-180-0 were similar to those of L-130, indicating that the structural characteristics of L-180-0 and L-130 were similar.
Table 3 Quantification of the lignin fractions by quantitative 13C NMR method
Assignment L-130 L-150 L-180 L-180-0
a Results expressed per one Ar based on quantitative 13C NMR spectra.
Aromatic C–O 2.07a 2.17 2.11 2.06
Aromatic C–C 1.66 1.87 1.97 1.75
Aromatic C–H 2.27 1.96 1.93 2.20
CH3O 1.67 1.51 1.11 1.62


3.4.2. 2D-HSQC NMR analysis. The 2D-HSQC NMR technique is of vital importance in lignin characterization because it can provide important structural characteristics of substructures and the S/G ratio in lignin.37 To elucidate the structural characteristics of the lignin fractions obtained by the EWS process, the lignin samples were subjected to 2D-HSQC NMR investigations. The side-chain (aliphatic-oxygenated, δC/δH 50.0–90.0/2.50–6.00) and aromatic/olefinic (around δC/δH 100.0–150.0/5.50–8.50) regions of the HSQC spectra, as well as their main structures, are presented in Fig. 1. The detailed assignments of the lignins and the correlated signals in the HSQC spectra are listed in Table S1 (based on previous literature assignments).38–42
image file: c6ra09640a-f1.tif
Fig. 1 2D-HSQC spectra and the main structures of lignin samples isolated from Eucalyptus wood.

In the side-chain region (inter-linkage region) of the lignins, the substructures β-O-4 aryl ethers (A/A′), resinols (B), and phenylcoumarans (C), could be assigned in Fig. 1 and listed in Table S1 according to previously published values.38,39 All spectra showed prominent signals corresponding to β-O-4 ether units. In detail, the Cα–Hα correlated signals in the β-O-4 substructures were found at δC/δH 71.7/4.83, while the Cγ–Hγ correlated signals in the β-O-4 substructures were located at δC/δH 59.4/3.65. The Cβ–Hβ signals at δC/δH 83.5/4.32 and 85.8/4.11 were linked to G and S units in β-O-4 substructures, respectively. Moreover, the Cα–Hα, Cβ–Hβ, and double Cγ–Hγ correlations of resinol (β-β) substructures were found at δC/δH 84.9/4.64, 53.3/3.07, and 71.0/4.17 and 3.80, respectively. Phenylcoumaran (β-5) substructures were also detected, and the signals for their Cα–Hα, Cβ–Hβ, and Cγ–Hγ correlations were observed at δC/δH 87.0/5.55, 52.4/3.51, and 62.3/3.70, respectively. The extraction solvent ethanol could also serve as a reaction reagent, and preferably lead to substitution at the α-carbon, eventually leading to α-ethoxylated β-O-4 (A′), which was located at δC/δH 79.8/4.55. Furthermore, the correlated signal for the methylene in α-ethoxylated β-O-4 (A′) was observed at δC/δH 63.9/3.35, which was also confirmed by the occurrence of α-ethoxylated β-O-4 (A′).

In the aromatic region of the spectra, signals from the G and S units were readily identified by their correlated signals at 110.7/6.93, 114.8/6.92, and 103.6/6.67 ppm, corresponding to G2, G5, G6 and S2,6 positions of the lignin, suggesting that the lignin obtained belonged to the GS type lignin. In addition, the signals for the Cα-oxidized S units (S′) and condensed S units (S2,6) were also observed at 106.2/7.29 ppm and 105.5/6.40 ppm, respectively. Especially, the condensed S units were more likely to occur at the relatively higher temperatures (>130 °C). Interestingly, the G6 signals disappeared in the spectra of lignin when the temperature was higher than 160 °C, implying that some condensation reaction probably occurred at position 6 of G units of the lignin, especially in L-170 and L-180. Moreover, the signal at 125.6/6.97 ppm, which was assigned to the Cαβ–Hαβ correlation of the stilbenes unit (Iαβ), appeared in the spectrum of L-180-0 rather than those of other lignin samples (L130-L180). In general, the presence of stilbene structures is attributed to the cleavage of β-O-4 linkages under acidic conditions,43 while its absence in these lignins was probably related to the addition of AlCl3 (L-180 vs. L-180-0) and the different pretreatment temperatures (L130 to L170 vs. L-180-0).

Quantification of different substructures in lignin by the 2D-HSQC NMR method is an effective method to track the structural changes of the lignin fractions. As shown in Table 4, the content of β-O-4 linkages in the lignin was decreased from 48.47/100Ar to trace amounts with increased temperature from 130 to 180 °C, suggesting that the β-O-4 linkages were degraded to different degrees during the EWS pretreatment. Moreover, most β-O-4 linkages could not be observed as the temperature increased to 160 °C, indicating that the EWS pretreatment catalysed by AlCl3 led to almost complete cleavage of these linkages at a relatively high temperature. In contrast, the carbon–carbon linkages (β-β) seemed to be more steady compared to β-O-4 linkages due to its presence in the lignin samples obtained at relatively high temperatures. Although the β-5 linkage seems to be unstable, and it was not easily detected in the 2D-HSQC spectra of L-160, L-170, and L-180, this linkage is also stable compared to β-O-4 linkages. The reduced signals for carbon–carbon linkages (β-β and β-5) are probably ascribed to the following reasons: (1) some degraded lignin fragments of the lignin would be condensed and redeposited back to the residue during the isolating process. Additionally, these lignin fragments were rich in carbon–carbon linkages, thus some linkage (especially in β-5 linkage) abundances will be reduced in the obtained lignin fraction; (2) the resolution of 2D NMR is largely reduced for condensed lignin so that some linkages (newly formed carbon–carbon linkages) are generally less detectable in 2D-HSQC NMR than e.g. C-13 NMR. As supplementary evidence, the reduced contents of these linkages and increased molecular weights also add some clues for the produced condensed lignin, although they were not directly detected by the 2D-HSQC technique.

Table 4 Quantification of the lignin fractions by the quantitative 2D-HSQC NMR methoda
  β-O-4b β-βc β-5d S/Ge
a Results expressed per 100 Ar based on quantitative 2D-HSQC spectra; I (C9) = 0.5I (S2,6) + I (G2).b β-O-4 = I (β-O-4)/I (C9).c β-β = I (β-β)/I (C9).d β-5 = I (β-5)/I (C9).e S/G = 0.5I (S2,6)/I (G2).f Tr, trace.
L-180-0 33.00 7.64 5.01 1.32
L-180 Trf Tr Tr 1.49
L-170 Tr 0.67 Tr 1.61
L-160 Tr 2.63 Tr 1.51
L-150 13.42 6.49 3.60 1.11
L-140 28.30 6.68 2.78 1.43
L-130 48.47 9.14 5.29 1.05


3.4.3. 31P NMR analysis. To further investigate the changes of functional groups in lignin during the EWS pretreatment, the 31P NMR technique was also applied (Table 5, Fig. S3). The signals of the aliphatic hydroxyl (OH) and carboxyl group (COOH) in lignin corresponded to the regions of 146.0–149.0 and 134.2–135.5 ppm, respectively. The peaks of the guaiacyl phenolic OH and the syringyl phenolic OH were separately located at 138.8–140.2 and 142.2–143 ppm, respectively. The signals of condensed phenolic OH (5-substitued OH) for G-type lignin appeared in the region of 141.4 to 142.2 ppm. As shown in Table 5, the value of aliphatic OH was gradually reduced after the EWS pretreatments, implying that the aliphatic OH groups were chemically modified into α-ethoxylated groups and only oxidized into COOH groups under a higher temperature during the process.33,43 As for the phenolic hydroxyl groups, it was found that their contents in S and G lignin fractions increased with elevating temperatures. Interestingly, the amounts of aliphatic and phenolic hydroxyl groups in L-180-0 were similar to those of L-130, indicating that the effect of EWS pretreatment with AlCl3 at 130 °C was analogous to the pretreatment with 50% aqueous ethanol without AlCl3 at 180 °C. It was obvious that the EWS pretreatment with AlCl3 reduced the pretreatment temperature. Moreover, the content of COOH increased with the elevation of temperature because some aliphatic hydroxyl groups were oxidized into carboxyl groups during the harsh EWS pretreatment conditions. In short, the released lignin fragments were rich in phenolic hydroxyl groups, which were beneficial to their further chemical modifications, such as use for linkers to create lignin-based macromonomers.44
Table 5 Quantification of the lignin fractions by the quantitative 31P NMR method (mmol g−1)
Sample Aliphatic OH Syringyl OH Guaiacyl OH Carboxylic group
Ca NCb
a C, condensed. 5-Substituted lignin.b NC, non-condensed.
L-180-0 4.49 1.18 0.18 0.87 0.11
L-180 0.90 2.57 0.42 1.13 0.16
L-170 0.98 2.68 0.41 1.16 0.15
L-160 1.50 2.59 0.40 1.13 0.12
L-150 2.07 2.38 0.34 1.05 0.06
L-140 3.38 1.90 0.25 0.89 0.06
L-130 4.14 1.17 0.17 0.79 0.06


3.5. Characterization of the pretreated substrates

3.5.1. Morphology characteristics of the pretreated substrates. The EWS pretreatment could observably change the morphologic characteristics of biomass, which also reflects the accessibility of the substrates. The morphological changes of the pretreated substrates were observed by SEM images (Fig. 2). The morphology characteristics demonstrated that the raw material (R0) had an intact and smooth structure, and some knobbly and plate-like particles were adhered to the surface of Eucalyptus wood. By contrast, the surface structures of the pretreated substrates were degraded into different degrees and the fibrous material was loosened, thus leading to the improved enzymatic digestibility rates of the pretreatment substrates, which will be verified in subsequent section. However, some spherical droplets with different sizes appeared on the surface of R-170 and R-180 (Fig. 2), suggesting that lignin, or pseudo-lignin, appeared during harsh pretreatment.46 The deposited lignin, or pseudo-lignin, likely resisted enzymatic attack,32 which was further verified by the slightly reduced glucose yield in enzymatic hydrolysis. Moreover, the surface structure of R-180 was damaged more seriously than that of R-180-0. In view of this, it was demonstrated that the combination of EWS with AlCl3 under a certain condition was a favourable approach to effectively remove hemicelluloses and lignin and hence, increasing the enzymatic hydrolysis efficiency of cellulose in the substrates.
image file: c6ra09640a-f2.tif
Fig. 2 SEM images of the raw material and pretreated substrates at (A) magnification ×1000; (B) magnification ×10[thin space (1/6-em)]000.
3.5.2. Crystallinity of the pretreated substrates. The crystallinity of cellulose is one of the distinct substrate features that influence the yield of glucose in enzymatic hydrolysis.25 To understand the effects of EWS on the crystallinity index (CrI) of the pretreated substrates, the CrI value was obtained from the corresponding XRD patterns. The characteristic peak of crystalline cellulose appeared at 16.5° and 22.5°, and the peak at 18.5° was mostly due to the presence of amorphous cellulose. The XRD patterns and corresponding CrIs are shown in Fig. 3. It was found that the control biomass had a CrI of 39.0%, while the CrI of the pretreated residues increased to 41.2–55.0%, which was attributable to the fact that amorphous hemicelluloses and lignin were removed to different degrees after the EWS process.43 The CrI of R-180 was increased to 55.0%, which was higher than that of R-180-0 (49.1%), implying that AlCl3-catalyzed ethanol pretreatment significantly enhanced the removal of amorphous hemicelluloses and lignin.
image file: c6ra09640a-f3.tif
Fig. 3 XRD characterization of the raw material and pretreated substrates.

The CP-MAS 13C NMR spectra (Fig. S4) were used to investigate the structural features of the substrates after the EWS pretreatment. The signals that appear in the region of 60.0–110.0 ppm primarily originated from the carbons in cellulose and hemicelluloses. The signals between 86.0 and 92.0 ppm are derived from crystalline and para-crystalline cellulose, whereas the signals of amorphous cellulose are distributed in the range of 80.0 to 86.0 ppm. As can be seen, the RCrI of the control sample was 38.61%, and after the EWS pretreatment, the RCrI of the pretreated biomass increased from 43.29% to 49.02% with elevating temperature. This increase in RCrI suggested that the amorphous hemicelluloses were degraded and removed during the EWS process, which was consistent with the aforementioned component analysis. However, the RCrI of the substrate without AlCl3 at 180 °C was 46.30%, which was lower than those catalysed with AlCl3 above 150 °C, suggesting that AlCl3 could facilitate the degradation of hemicelluloses compared to that pretreated at a high temperature without AlCl3 addition. Besides the RCrI, the signals for the residual lignin in the substrates can also evaluate the delignification effects of different pretreatment conditions. After the process, it was found that signals for lignin were largely reduced (152.6, 56.0 ppm), implying that most of the lignin was removed after the process. Especially in R-150, the faint signals for lignin in R-150 and R-160 are in agreement with the higher delignification ratios. Furthermore, besides the delignification ratio, the structural characteristics of the residual lignin in the substrates were also associated with the subsequent enzymatic hydrolysis of the substrates. In fact, the signal for etherified S3,5 (β-O-4 linkages) at 152.6 ppm decreased in the harsher pretreatment conditions (R-160, R-170, and R-180) compared to (R-150, R-140, R-130, and R-180-0), while the signals for non-etherified S3,5 (cleaved β-O-4 linkages) were increased in R-160, R-170, and R-180. Theoretically, high delignification ratio and depolymerized lignin (cleaved β-O-4 linkages) in the substrates facilitates their subsequent enzymatic hydrolysis.

3.6. Enzymatic hydrolysis of raw material and the pretreated substrate

The enzymatic saccharification of the pretreated substrates is plotted in Fig. 4. Obviously, the EWS pretreatment effectively improved the enzymatic digestibility of Eucalyptus chips. It was observed that the glucose yield of the pretreated substrates was significantly increased from 40.35 to 95.02% after 72 h enzymatic hydrolysis compared with that (9.20%) of the control sample. As the temperature was elevated, the enzymatic digestibility of the pretreated substrates (R7, R6, R5, and R4) enhanced and finally reached a maximum value (95.02%) at 160 °C. The highest glucose yield of the substrate was probably related to the following reasons: (1) the decreased content of hemicelluloses was probably related to the enhanced cellulose digestibility; (2) aluminium ion (Al3+) eliminated the inhibition induced by lignin through formation of a metal–lignin complex and more active sites of cellulose were accessible for subsequent enzymatic hydrolysis.47 However, as the pretreated temperature further increase to 170 and 180 °C, the glucose yields of the pretreated substrates slightly reduced to 88.5% and 89.0%, respectively. This decrease was probably due to the pseudo-lignin on the surface of the substrates (Fig. 2) that restricts the cellulose saccharification process to some extent.32,45 Meanwhile, the generated condensed structures (condensed S2,6 and disappeared G6) in L-170 and L-180 also added some clues to the decreased glucose yield of the corresponding substrates. Furthermore, the lower glucose yield of R-180-0, compared to that of R-180, was because R-180 had a high content of lignin and pseudo-lignin on the surface of the substrate. To sum up, these results implied that the degraded hemicellulosic polymers and lignin, redistribution of lignin, enhancive surface area, and loosened surface morphology were all beneficial to increase enzymatic saccharification.25,30
image file: c6ra09640a-f4.tif
Fig. 4 Glucose yield of enzymatic hydrolysis of the raw material and pretreated substrates.

4. Conclusion

A robust process based on EWS pretreatment with AlCl3 catalyst was applied to obtain lignin and enhance the enzymatic hydrolysis of Eucalyptus wood. In this study, a high-quality lignin and digestible substrate can be achieved at mild pretreatment temperatures compared to those obtained under harsh conditions by the EWS process without a catalyst. The comprehensive NMR results showed that the EWS pretreatment catalysed by AlCl3 led to almost complete cleavage of β-O-4 linkages as the temperature increased to 160 °C. Moreover, the released lignin fragments were rich in phenolic hydroxyl groups, which were beneficial to their subsequent chemical modification in bio-based materials. Observably, the GPC and NMR results also showed that the molecular weight and structural characteristics of L-130 were similar to those of L-180-0. In other words, the addition of AlCl3 as a catalyst remarkably decreases the pretreatment temperature of the EWS process. Meanwhile, compositional and structural changes of hemicelluloses and cellulose also occurred, such as the degradation of hemicelluloses and crystalline transformation and partial degradation of cellulose. After enzymatic hydrolysis, a maximum glucose yield (95.02%) was achieved in R-160, which was increased by approximately 85.82% compared to that of the raw material (9.20%). In short, the EWS with AlCl3 catalyst is advantageous to achieve efficient fractionation and value-added utilization of the major components of Eucalyptus wood.

Acknowledgements

The authors wish to express their gratitude for the financial support from Natural Science Foundation of China (31430092, 31500486, and 31110103902), International Science & Technology Cooperation Program of China (2015DFG31860).

References

  1. M. F. Demirbas, Appl. Energy, 2009, 86, 151–161 CrossRef.
  2. M. Balat and H. Balat, Appl. Energy, 2009, 86, 2273–2282 CrossRef CAS.
  3. D. Kumar and G. S. Murthy, Biotechnol. Biofuels, 2013, 6, 63–82 CrossRef CAS PubMed.
  4. D. M. Alonso, J. Q. Bond and J. A. Dumesic, Green Chem., 2010, 12, 1493–1513 RSC.
  5. T. Walther, P. Hensirisak and F. A. Agblevor, Bioresour. Technol., 2001, 76, 213–220 CrossRef CAS PubMed.
  6. B. Yang and C. E. Wyman, Biofuels, Bioprod. Biorefin., 2008, 2, 26–40 CrossRef CAS.
  7. L. R. Lynd, J. H. Cushman, R. J. Nichols and C. E. Wyman, Science, 1991, 251, 1318–1323 CAS.
  8. K. David and A. J. Ragauskas, Energy Environ. Sci., 2010, 39, 1182–1190 Search PubMed.
  9. A. J. Ragauskas, G. T. Beckham, M. J. Biddy, R. Chandra, F. Chen, M. F. Davis and P. Langan, Science, 2014, 344, 1246843 CrossRef PubMed.
  10. F. S. Chakar and A. J. Ragauskas, Ind. Crops Prod., 2004, 20, 131–141 CrossRef CAS.
  11. Z. Zhang, M. D. Harrison, D. W. Rackemann, W. O. Doherty and I. M. O'Hara, Green Chem., 2016, 18, 360–381 RSC.
  12. Y. Li and A. J. Ragauskas, RSC Adv., 2012, 2, 3347–3351 RSC.
  13. K. Zhang, Z. Pei and D. Wang, Bioresour. Technol., 2016, 199, 21–33 CrossRef CAS PubMed.
  14. H. Chen, J. Zhao, T. Hu, X. Zhao and D. Liu, Appl. Energy, 2015, 150, 224–232 CrossRef CAS.
  15. C. Z. Liu, F. Wang, A. R. Stiles and C. Guo, Appl. Energy, 2012, 92, 406–414 CrossRef CAS.
  16. J. S. Kim, Y. Y. Lee and T. H. Kim, Bioresour. Technol., 2016, 199, 42–48 CrossRef CAS PubMed.
  17. A. Von Schenck, N. Berglin and J. Uusitalo, Appl. Energy, 2013, 102, 229–240 CrossRef CAS.
  18. X. Pan, N. Gilkes, J. Kadla, K. Pye, S. Saka, D. Gregg and J. Saddler, Biotechnol. Bioeng., 2006, 94, 851–861 CrossRef CAS PubMed.
  19. J. Wildschut, A. T. Smit, J. H. Reith and W. J. Huijgen, Bioresour. Technol., 2013, 135, 58–66 CrossRef CAS PubMed.
  20. D. Yawalata and L. Paszner, Holzforschung, 2004, 58, 7–13 CAS.
  21. W. J. J. Huijgen, A. T. Smit, J. H. Reith and H. den Uil, J. Chem. Technol. Biotechnol., 2011, 86, 1428–1438 CrossRef CAS.
  22. S. Constant, C. Basset, C. Dumas, F. Di Renzo, M. Robitzer, A. Barakat and F. Quignard, Ind. Crop Prod., 2015, 65, 180–189 CrossRef CAS.
  23. M. Schwiderski, A. Kruse, R. Grandl and D. Dockendorf, Green Chem., 2014, 16, 1569–1578 RSC.
  24. A. Sluiter, B. Hames, R. Ruiz, C. Scarlata, J. Sluiter, D. Templeton and D. Crocker, Laboratory analytical procedure (NERL), 2008 Search PubMed.
  25. S. L. Sun, S. N. Sun, J. L. Wen, X. M. Zhang, F. Peng and R. C. Sun, Bioresour. Technol., 2015, 175, 473–479 CrossRef CAS PubMed.
  26. K. M. Holtman, H. M. Chang, H. Jameel and J. F. Kadla, J. Wood Chem. Technol., 2006, 26, 21–34 CrossRef CAS.
  27. J. Rencoret, G. Marques, A. Gutierrez, D. Ibarra, J. Li, G. Gellerstedt, J. I. Santos, J. Jiménez-Barbero, A. T. Martinez and J. C. del Río, Holzforschung, 2008, 62, 514–526 CrossRef CAS.
  28. Y. Pu, S. Cao and A. J. Ragauskas, Energy Environ. Sci., 2011, 4, 3154–3166 CAS.
  29. J. Li, G. Henriksson and G. Gellerstedt, Bioresour. Technol., 2007, 98, 3061–3068 CrossRef CAS PubMed.
  30. Y. Pu, F. Hu, F. Huang, B. H. Davison and A. J. Ragauskas, Biotechnol. Biofuels, 2013, 6, 15–27 CrossRef CAS PubMed.
  31. L. Hu, Y. Luo, B. Cai, J. Li, D. Tong and C. Hu, Green Chem., 2014, 16, 3107–3116 RSC.
  32. F. Hu, S. Jung and A. J. Ragauskas, Bioresour. Technol., 2012, 117, 7–12 CrossRef CAS PubMed.
  33. J. L. Wen, S. L. Sun, T. Q. Yuan, F. Xu and R.-C. Sun, J. Agric. Food Chem., 2013, 61, 11067–11075 CrossRef CAS PubMed.
  34. J. Ralph and L. L. Landucci, NMR of lignins, in Lignin Lignans, Advances in Chemistry, ed. C. Heitner, D. Dimmel and J. Schmidt, CRC Press, Boca Raton FL, 2010, pp. 137–243 Search PubMed.
  35. H. H. Nimz, D. Robert, O. Faix and M. Nemr, Holzforschung, 1981, 35, 16–26 CrossRef CAS.
  36. P. Sannigrahi, A. J. Ragauskas and S. J. Miller, Energy Fuels, 2010, 24, 683–689 CrossRef CAS.
  37. A. Rico, J. Rencoret, C. José, A. T. Martínez and A. Gutiérrez, BioEnergy Res., 2015, 8, 211–230 CrossRef CAS.
  38. J. Rencoret, G. Marques, A. Gutiérrez, L. Nieto, J. I. Santos, J. Jiménez-Barbero, Á. T. Martínez and J. C. del Río, Holzforschung, 2009, 63, 691–698 CrossRef CAS.
  39. J. Rencoret, A. Gutiérrez, L. Nieto, J. Jiménez-Barbero, C. B. Faulds, H. Kim, J. Ralph, Á. T. Martínez and C. José, Plant Physiol., 2011, 155, 667–682 CrossRef CAS PubMed.
  40. J. L. Wen, S. L. Sun, B. L. Xue and R. C. Sun, Materials, 2013, 6, 359–391 CrossRef CAS.
  41. B. B. Hallac, Y. Q. Pu and A. J. Ragauskas, Energy Fuels, 2010, 24, 2723–2732 CrossRef CAS.
  42. R. Samuel, S. Cao, B. K. Das, F. Hu and Y. Pu, RSC Adv., 2013, 3, 5305–5309 RSC.
  43. D. Y. Min, H. Jameel, H. M. Chang, L. Lucia, Z. G. Wang and Y. C. Jin, RSC Adv., 2014, 4, 10845–10850 RSC.
  44. B. M. Upton and A. M. Kasko, Chem. Rev., 2016, 116, 2275–2306 CrossRef CAS PubMed.
  45. R. Kumar, F. Hu, P. Sannigrahi, S. Jung, A. J. Ragauskas and C. E. Wyman, Biotechnol. Bioeng., 2013, 110, 737–753 CrossRef CAS PubMed.
  46. H. J. Li, Y. Q. Pu, R. Kumar, A. J. Ragauskas and C. E. Wyman, Biotechnol. Bioeng., 2014, 111, 485–492 CrossRef CAS PubMed.
  47. S. R. Kamireddy, J. Li, M. Tucker, J. Degenstein and Y. Ji, Ind. Eng. Chem. Res., 2013, 52, 1775–1782 CrossRef CAS.

Footnote

Electronic supplementary information (ESI) available. See DOI: 10.1039/c6ra09640a

This journal is © The Royal Society of Chemistry 2016
Click here to see how this site uses Cookies. View our privacy policy here.