
Understanding the crystallization behavior of polyamide 6/polyamide 66 alloys from the perspective of hydrogen bonds: projection moving-window 2D correlation FTIR spectroscopy and the enthalpy†
Abstract
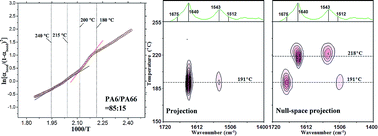
In this study, the crystallization behavior of PA6/PA66 alloys was studied using in situ FTIR spectroscopy, combined with Proj-MW2D correlation analysis and DSC measurements. The method for calculating the generation enthalpy of hydrogen bonds during PA6/PA66 alloys crystallization was also established via Van't Hoff analysis. The essential reason for the crystallization reduction for both PA6 and PA66 in alloys was elucidated from the perspective of hydrogen bonds. Compared with neat PA6 and neat PA66, DSC measurements showed that the crystallization ability of both PA6 and PA66 in the alloys obviously decreased. From the results of the generation enthalpies of the hydrogen bonds, it was confirmed that the capability for hydrogen bond generation of both PA6 and PA66 in PA6/PA66 alloys was significantly reduced. The molecular chain motions of PA6 and PA66 during the alloy crystallization were successfully separated using Proj-MW2D correlation FTIR spectroscopy. Two main issues were addressed. The first one is that the generating capacity of hydrogen bonds between PA6 and PA66 is actually very weak, although this type of hydrogen bond can be generated in theory. The second is that non-hydrogen bonded molecular chains of PA66 are also involved in the PA6 crystallization, and the molecular chains of amorphous state PA66 hinder the generation of hydrogen bonds between PA6 molecular chains, resulting in a significant crystallization reduction of PA6 in PA6/PA66 alloys.
 Please wait while we load your content...

