Heterogeneous photooxidation of sulfur dioxide in the presence of airborne mineral dust particles

J. Y. Park and M. Jang*
Department of Environmental Engineering Sciences, University of Florida, P.O. Box 116450, Gainesville, FL 32611, USA. E-mail: mjang@ufl.edu; Fax: +1-352-392-3076; Tel: +1-352-846-1744

Received 13th April 2016 , Accepted 10th June 2016

First published on 13th June 2016


Abstract

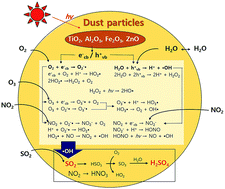
The photocatalytic effect of Arizona Test Dust (ATD) particles on SO2 oxidation was investigated in both the absence and the presence of atmospheric oxidants (e.g., NOx and O3) under varying relative humidity (RH) using a 2 m3 indoor photo-irradiation chamber. To the best of our knowledge, this is the first time that the kinetic rate constant has been determined for heterogeneous photooxidation of SO2 in the presence of airborne mineral dust particles. Chamber-generated sulfate data, measured using a particle into liquid sampler coupled with ion chromatography, were used to estimate the kinetic uptake coefficient (γSO42−) of SO2 corresponding to sulfate production on ATD particles. The γSO42− value (γSO42−,dark) in the presence of UV light was significantly higher than that (γSO42−,dark) obtained in the dark. For example, γSO42−,light was (1.15 ± 0.17) × 10−5 and γSO42−,dark was (1.16 ± 0.11) × 10−6 at 20% RH. Both γSO42−,light and γSO42−,dark values increased exponentially as RH increased from 20% to 81%. The heterogeneous photocatalytic oxidation of SO2 was also considerably enhanced by both O3 and NO2. To characterize the reaction between sulfuric acid and inorganic species of dust particles, aerosol acidity ([H+]C-RUV, μmol L−1 by aerosol volume) was measured using colorimetry integrated with a reflectance UV-Visible spectrometer. Under the experimental conditions employed (sulfate[thin space (1/6-em)]:[thin space (1/6-em)]dust particle = 1[thin space (1/6-em)]:[thin space (1/6-em)]20 in mass), the value determined for [H+]C-RUV was much lower than the value of [H+] determined from the concentrations of sulfate and ammonium ions measured using ion chromatography, suggesting that most sulfuric acid reacted with alkaline components of ATD particles.


1. Introduction

Mineral dust particles are the largest contributors to particle mass loading in the atmosphere, with estimated annual emission of 1000–3000 Tg per year.1,2 Mineral dust particles account for 35% of PM10 in China and as much as 50% to 60% in some cities.3 The majority of mineral dust particles originates from desert areas, such as the Sahara desert in Northern Africa and the Gobi desert in northern China and Mongolia.4,5 Their compositions consisting of quartz, feldspars, carbonates (calcite, dolomite), and clay minerals (illite, kaolinite, chlorite, montmorillonite) vary with sources.6 Mineral dust particles larger than 100 μm in diameter quickly settle near the source, while dust particles smaller than 20 μm are globally transported over thousands of kilometers due to their long lifetimes, which can last from days to weeks.7–9 Mineral dust particles can significantly affect the global radiation balance,10–12 cloud formation by serving as cloud condensation nuclei and ice nuclei,13 oceanic biogeochemical cycles (e.g., marine productivity due to dust-bonded iron),14–16 regional air quality via visibility impairment,17,18 and pulmonary health.19,20

The surfaces of mineral dust particles can act as sinks for atmospheric trace gases such as O3,21–23 NOx (i.e., NO and NO2),24 and SO2.25 For example, Underwood et al.24 reported NO2 adsorption on the surfaces of metal oxides, subsequent formation of surface nitrite (NO2) ions, and the production of nitrate ions via the reaction of two nitrite ions or the reaction of nitrite ions and gas phase NO2. Heterogeneous uptake of O3 is catalytic on the surface of metal oxides and results in O3 destruction via formation of surface-bound atomic oxygen and an oxygen molecule.21,23 Using a global three-dimensional model, Dentener et al.4 estimated that ozone levels near a dust source are reduced by as much as ∼10% due to heterogeneous reactions. In addition, Wang et al.26 reported that mixing ratios of O3 were reduced by up to 3.8 ppb (∼9%) in the presence of dust particles.

Among criteria pollutants, SO2 is most significantly affected by mineral dust particles.27 An annual average of 50% to 70% of total sulfate is estimated to be formed by mineral dust in the vicinity of dust sources.4,28 To date, a number of studies characterizing the heterogeneous chemistry of SO2 and the production of sulfate have focused on reactions under dark conditions. For example, Zhang et al.29 reported that active oxygen (O2) or hydroxyl ions (OH) are produced from O2 or H2O adsorbed on the surface of metal oxides (e.g., Al2O3) and might heterogeneously oxidize SO2. Studies have shown that heterogeneous chemistry of atmospheric oxidants like O3,23,30–33 NOx,25,34–36 and H2O2[thin space (1/6-em)]37,38 can also increase sulfate concentrations. Upon exposure to O3, sulfite (SO32−) produced on the surfaces of dust particles is heterogeneously oxidized to sulfate.31,32 Liu et al.35 and Ma et al.36 found that NOx promotes SO2 oxidation via the reaction with dinitrogen tetraoxide (N2O4), a critical oxidant, on the surface of metal oxides. H2O2 adsorbed on the dust particle can produce OH radicals and increase SO2 uptake.38 Despite numerous studies regarding sulfate concentration enhancement via mineral dust particles, the mechanisms responsible for the heterogeneous chemistry of SO2 remains largely uncertain, hampering prediction of sulfate formation on regional and global scales. Of particular note in this regard is our lack of knowledge regarding the photocatalytic effect of mineral dust on SO2 oxidation.

The present study investigates the heterogeneous photooxidation of SO2 in the presence of Arizona Test Dust (ATD) particles. SO2 was photochemically oxidized in the presence of ATD particles using a 2 m3 indoor photo-irradiation chamber. Sulfate concentrations were measured over the course of the chamber experiment using a Particle Into-Liquid Sampler coupled with Ion Chromatography (PILS-IC). The chamber data thus collected were used to determine the kinetic uptake coefficient (γSO42−) corresponding to sulfate production from SO2 on ATD particles. The effects of relative humidity (RH) and atmospheric oxidants, such as NOx and O3, on the heterogeneous photocatalytic oxidation of SO2 were also investigated.

2. Experimental methods

2.1 Indoor chamber experiment

SO2 was photooxidized while varying conditions related to RH and atmospheric oxidants (e.g., NOx and O3) using the 2 m3 Teflon indoor chamber equipped with 16 UV lamps (range of wavelengths: 280–900 nm) (Solarc Systems Inc., FS40T12/UVB). Fig. 1 shows a schematic diagram of the experimental setup using the indoor chamber. The chamber was flushed using air from clean air generators (Aadco Model 737, Rockville, MD; Whatman Model 75-52, Haverhill, MA) and compressed air of breathing-grade quality (Airgas, Radnor, PA). In order to control RH, the humidified air produced using a hot water bubbler with clean air was introduced into the chamber until the chamber RH reached the desired value. The RH and temperature of the chamber were monitored using an electronic thermo-hygrometer (Dwyer Instrument, INC, USA). ATD particles were added to the chamber using a PARI LC Star nebulizer (Pari, Starnberg, Germany). ATD particles were directly introduced into the chamber in the form of the dry particles without solvent extraction. SO2 (500 ppm sulfur oxide, Airgas) and NO2 (2% nitrogen dioxide, Airgas) were injected into the chamber using a gas tank. O3 was generated via an ozone generator (Jelight Model 600, Irvine, CA) by passing through clean air. After completing gases injections, reactions proceeded under dark conditions for 2–3 hours, after which UV lamps were illuminated to induce photochemical reactions. Fig. S1 shows spectral irradiance of the light sources used in the present study measured with a fibro-optical portable spectrometer (EPP2000, Stellar Net Inc., USA). Table 1 summarizes the experimental conditions utilized for SO2 oxidation in the presence of ATD particles in the indoor chamber.
image file: c6ra09601h-f1.tif
Fig. 1 A schematic diagram of the experimental setup using the indoor chamber.
Table 1 Experimental conditions and kinetic uptake coefficients (γSO42−,light and γSO42−,dark) for SO2 oxidation on the surfaces of ATD particles in the absence and presence of atmospheric oxidants (e.g., NO2 and O3) under different conditions of relative humidity (RH)
Exp. No.a Purpose UV Type of particles Mass conc. of particlesb,d (μg m−3) S0 (cm2 m−3) RHc (%) Temp.c (°C) Initial SO2 conc.d (ppb) Initial NO/NO2 conc.d (ppb) Initial O3 conc.d (ppb) [SO42−]e (μg m−3) γSO42−,light or γSO42−,dark
a “D” denotes “Dark” condition experiments. “L” denotes “Light” condition experiments.b Mass concentrations of ATD particles were calculated from the SMPS data, the density of ATD particles (2.65 g cm−3), and the particle size distribution that is extended to 3 μm (see ESI S1).c Accuracy of RH: ±5%; accuracy of temperature: ±0.5 °C.d The errors associated with SO2, NO, NO2, and O3 were ±0.9%, ±12.5%, ±6.9%, and ±0.2%, respectively. The errors associated with ATD mass were ±6% based on SMPS and OPC data.e Sulfate concentrations were measured via PILS-IC after 2 hours of reaction time. The values were not corrected for the wall loss of particles but were corrected for the indigenous sulfate content of dust particles. In order to quantify the sulfate from indigenous ATD, water-soluble sulfate associated with ATD particles was measured using the PILS-IC. To estimate the sulfate produced by dust chemistry, the concentration of the sulfate from indigenous ATD was subtracted from the total sulfate. For comparison, sulfate concentrations were also determined for initial SO2 concentrations using the ratio of the initial SO2 concentrations in the presence and absence of dust particles.f N.A.: not applicable (no mineral dust particles).
D1 RH effect at dark conditions with dust (Section 3.2) Off ATD 295 9.51 21.0 22.7 266.13 N.A.f N.A.f 0.96 ± 0.02 (1.16 ± 0.11) × 10−6
D2 Off ATD 406 12.44 55.3 21.8 188.05 0.06/0.63 1.86 0.82 ± 0.01 (1.71 ± 0.18) × 10−6
D3 Off ATD 278 8.51 80.1 21.3 149.60 0.86/1.60 0.29 1.73 ± 0.04 (3.47 ± 0.70) × 10−6
L1A RH effect with light source without dust (Section 3.3) On N.A.f N.A.f N.A.f 19.3 23.1 92.17 0.35/1.48 0.36 1.62 ± 0.03 N.A.f
L1B On N.A.f N.A.f N.A.f 20.4 24.0 132.65 0.25/1.15 1.47 1.65 ± 0.02 N.A.f
L1C On N.A.f N.A.f N.A.f 20.4 24.4 121.55 0.36/1.88 1.43 1.60 ± 0.03 N.A.f
L1D On N.A.f N.A.f N.A.f 55.1 25.3 94.82 0.58/1.13 0.90 1.83 ± 0.03 N.A.f
L1E On N.A.f N.A.f N.A.f 80.4 27.3 88.38 0.25/1.13 0.71 2.85 ± 0.02 N.A.f
L2 RH effect with light source with dust (Section 3.4) On ATD 123 3.77 20.4 23.9 87.80 0.26/1.67 0.30 2.09 ± 0.04 (1.15 ± 0.17) × 10−5
L3 On ATD 120 3.66 55.2 26.1 82.31 0.17/1.87 1.79 2.78 ± 0.21 (2.75 ± 0.73) × 10−5
L4 On ATD 131 3.95 80.7 25.5 78.03 0.23/0.39 0.28 6.27 ± 0.19 (8.13 ± 0.18) × 10−5
L5 O3 effect On N.A.f N.A.f N.A.f 20.6 24.5 99.91 0.21/1.60 64.08 2.98 ± 0.03 N.A.f
L6 On ATD 130 3.97 21.0 23.7 78.09 0.11/1.35 64.83 4.90 ± 0.14 (5.35 ± 0.58) × 10−5
D4 Off ATD 122 3.73 21.3 24.3 96.80 <0.05/1.93 64.42 0.29 ± 0.01 (4.66 ± 0.55) × 10−6
L7 NO2 effect On N.A.f N.A.f N.A.f 20.8 24.13 90.34 68.71/109.50 1.52 1.55 ± 0.07 N.A.f
L8 On ATD 121 3.97 21.3 23.7 76.81 77.03/110.67 5.79 5.42 ± 0.12 (9.30 ± 0.63) × 10−5
D5 Off ATD 433 13.45 19.5 23.8 131.91 64.20/71.77 1.65 0.40 ± 0.01 (2.10 ± 0.08) × 10−6


In this study, the ranges of the concentrations (Table 1) of ATD particles, SO2, O3 and NOx were chosen to mimic the urban center where human activities are high. For example, field studies showed that the annual mean concentration of mineral dust particles in urban areas of China (e.g., Beijing) is as high as ∼85 μg m−3, varying season and location, and their concentrations during dust storms dramatically increased.3 The average concentrations of SO2, NOx and O3 were 31.9 ± 2.0 ppb, 62.7.0 ± 4.1 ppb, and 11.9 ± 0.8 ppb, respectively, with hourly maxima of 147.3 ppb, 314.2 ppb, and 69.7 ppb, respectively at an urban site in Beijing from 2007 to 2008.39 Francis et al.40 reported that SO2 concentration was 262.3 ppb at Shillong, China in March 2009 during Asian dust storms.

Gases and particles were sampled directly from the indoor chamber using laboratory instruments. To account for dilutions of gaseous compounds, carbon tetrachloride (CCl4) (99%, Acros, USA) was injected into the chamber and measured using a gas chromatography-flame ionization detector (HP-5890 GC-FID). Concentrations of SO2, NOx and O3 were continuously measured using a fluorescence TRS analyzer (Teledyne Model 102E), a chemiluminescence NO/NOx analyzer (Teledyne Model T201), and a photometric ozone analyzer (Teledyne model 400E), respectively. ATD particle sizes ranged from 20 nm to 835 nm, as measured by a scanning mobility particle sizer (SMPS; TSI 3080, USA) consisting of a regular differential mobility analyzer (DMA; TSI 3081, USA) and a condensation particles counter (CPC; TSI 3021A, USA). Full size distributions of ATD particles (20 nm to 3 μm) were estimated by assuming the log-normal size distribution, the details of which are given in the ESI. A Particle Into-Liquid Sampler (Applikon, ADISO 2081) coupled with Ion Chromatography (Metrohm, 761 Compact IC) (PILS-IC) was used to determine the mass concentrations of inorganic chemical species in particles every 30 minutes. The detection limit of PILS-IC is 0.2 μg m−3, and the associated error is ±6%. All aerosol data, such as concentrations of inorganic chemical species and SMPS data, were corrected based on the first-order rate constant for wall loss. Gaseous data were corrected for dilution using CCl4 decay data.

2.2 Particle acidity measurements

To explore the reactions that occur between mineral dust particles and sulfates on the surfaces of ATD particles, particle acidity (H+ molarity, mol L−1) was measured using the following two different methods: (1) colorimetry integrated with a reflectance UV-Visible spectrometer (C-RUV)41 and (2) PILS data integrated with inorganic thermodynamics using an E-AIM.42 This experiment was conducted using the University of Florida's Atmospheric Photochemical Outdoor Reactor (UF-APHOR) chamber. A detailed description of the UF-APHOR chamber and experimental operation is presented in our previous study43 and the ESI. Owing to its large volume (104 m3), the UF-APHOR chamber enables characterization of aerosol acidity over the course of the chamber experiment. Table S1 summarizes the outdoor chamber experiments employed to study SO2 photooxidation in the presence of ATD particles and two different SO2 concentrations. Using a pump at a flow rate of 13 L min−1, aerosol samples were collected on a 13 mm filter (Gelman Science Palflex, TX40H120-WW) that was dyed with a 0.02% aqueous solution of metanil yellow (Sigma Aldrich). The procedure utilized for dyed filter preparation has been reported previously.44 Color changes of the filter sample were monitored using reflectance UV-Visible spectroscopy (Lambda 35 UV WinLab V5.2, PerkinElmer) coupled to an integrating sphere attachment (50 mm integrating Sphere Lambda 2–40) and wavelengths ranging from 300 to 800 nm.

2.3 Characterization of mineral dust particles

The ATD particles used in this study ranged in size from 0–3 μm (Powder Technology Inc., Minnesota, USA). Specific surface areas were measured using the BET method and a NOVA 2200 instrument. The BET specific surface area of ATD particles was 47.4 m2 g−1. Elements of ATD particles were analyzed using energy dispersive spectroscopy (EDS, model 6505, Oxford Inc., England), and the results are summarized in Table S2. Table S2 also included chemical components of ATD particles provided by the manufacturer (Powder Technology Inc.). The major element of ATD particles was Si (∼58%), followed by Al (∼18%), Fe (∼8%), and Ti (∼0.7%). The size distribution of the ATD particles that were introduced into the chamber was determined using SMPS and is shown in Fig. S2.

3. Determination of kinetic uptake coefficient of SO2 on ATD particles

To investigate the significance of the heterogeneous photocatalytic reaction of SO2, sulfate formation in the presence of both dust and UV light should be decoupled from the photooxidation and non-photocatalytic reactions. The photocatalytic uptake coefficient (γSO42−,light) of SO2 is an important parameter for predicting sulfate formation in the presence of dust under UV light. The kinetic uptake coefficient for the non-photocatalytic pathway described by γSO42−,dark. γSO42−,light is obtained using the following procedures.

(1) Loss of SO2 to the reactor wall.

(2) Sulfate formation in the presence of ATD particles under dark conditions.

(3) SO2 oxidation in the absence of ATD particles under UV light.

(4) Uptake of SO2 on ATD particles under UV light.

3.1 Uptake of SO2 by the reactor wall

Consideration of the wall loss of gaseous SO2 is required to obtain correct SO2 concentrations over the reaction time. The wall loss of gaseous SO2 was treated as a first-order reaction. The rate constant of SO2 wall loss (kwall) was determined by monitoring SO2 decay at three different RH levels (separated chamber experiments) in the absence of ATD particles under dark conditions. The RH and temperature of the chamber were monitored using an electronic thermo-hygrometer. The kwall values obtained at 20%, 55%, and 81% RHs were 3.45 × 10⁻⁶ s−1, 3.93 × 10⁻⁶ s−1, and 4.18 × 10⁻⁶ s−1, respectively.

3.2 Sulfate formation in the presence of ATD particles under dark conditions

γSO42−,dark values were determined at three different RHs (20%, 55%, and 81%) at room temperature (295–298 K). The SO2 uptake process under dark conditions is also described by a first-order heterogeneous reaction:
 
image file: c6ra09601h-t1.tif(1)
where kdark is a rate constant (s−1) for SO2 uptake on ATD particles under dark conditions; and [SO2] is the concentration of gaseous SO2 in the chamber (mol m−3). The relationship between γSO42−,dark and kdark is written as26
 
image file: c6ra09601h-t2.tif(2)
where ω is the mean molecular velocity (m s−1) of gaseous SO2; and SATD is the geometric surface area (cm2 m−3) of the ATD particles. ω is defined using eqn (3):
 
image file: c6ra09601h-t3.tif(3)
where R is the gas constant (J mol K−1); T is the absolute temperature (K); and MSO2 is the molecular weight of gaseous SO2 (kg mol−1). SATD is determined using eqn (4):
 
SATD = S0[thin space (1/6-em)]exp(−kpt) (4)
where S0 is the total concentration of initial geometric surface area of the ATD particles (cm2 m−3) and kp is the first-order rate constant for the wall loss of ATD particles (s−1). The kp value is 0.006577 min−1. If eqn (2)–(4) are integrated into eqn (1), the reaction rate of SO2 is written as
 
image file: c6ra09601h-t4.tif(5)

The analytical solution of eqn (5) is expressed as

 
image file: c6ra09601h-t5.tif(6)
where [SO2]0 is the initial concentration of gaseous SO2 in the chamber (mol m−3); and [SO2]t is the concentration (mol m−3) of gaseous SO2 at time t (min). The decay rate of SO2 is controlled by the uptake of SO2 on the surfaces of dust particles. Adsorbed SO2 can produce sulfate via heterogeneous reactions on dust surfaces. The present study assumes that after correction of SO2 loss to the wall, SO2 decay equals formation of sulfate. Hence, observed [SO2]t is determined by subtracting the sulfate concentration ([SO42−]t, mol m−3) from the wall-loss-corrected gaseous [SO2]0, as shown in eqn (7) below:
 
[SO2]t = [SO2]0[thin space (1/6-em)]exp(−kwallt) − [SO42−]t (7)
γSO42−,dark is estimated using chamber data obtained at three different RH levels: 20% RH (Exp. D1), 55% RH (Exp. D2), and 81% RH (Exp. D3) in Table 1.

3.3 SO2 oxidation in the absence of ATD particles under UV light

The SO2 decay rate under UV light in the absence of ATD particles can be described as
 
image file: c6ra09601h-t6.tif(8)
where kOH is a rate constant for the gas-phase reaction of SO2 with OH radicals (m3 per molecules per s), and kSA is a rate constant for SO2 uptake on H2SO4 particles (s−1) (wet inorganic particles). Although the chamber is initially flushed using clean air, the chamber contains OH radicals via photolysis of HONO off-gassing from the wall and photooxidation of a small amount of hydrocarbons and NOx (less than ∼3 ppb), which intrude into the chamber via gaseous diffusion during the experiment. These OH radicals react with SO2 and form H2SO4 under UV light. Under our chamber experimental conditions, sulfate formation was reproducible within 2% (Exp. L1A, Exp. L1B, and Exp. L1C in Table 1). H2SO4 particles provide an aqueous phase and can also promote heterogeneous uptake of SO2.

3.4 Uptake of SO2 on ATD particles under UV light

The reaction rate of the heterogeneous photocatalytic reaction of SO2 on ATD particles is described as
 
image file: c6ra09601h-t7.tif(9)
where kjATD is a 1st order rate constant for photocatalytic SO2 uptake on the surface of ATD particles (s−1). kjATD depends on the actinic flux at each wavelength and the metal composition of mineral dust particles. To estimate the reaction rate constant solely attributed to heterogeneous photocatalytic reaction of SO2 at given dust particles, the gas-phase photooxidation of SO2 (terms kOH[OH][SO2] and kjSA[SO2]) was subtracted from eqn (9). The concentration of sulfate originating from gas-phase SO2 photooxidation was also subtracted from the total sulfate concentration.
 
image file: c6ra09601h-t8.tif(10)

Excepting the loss of SO2 to the chamber wall (term kwall[SO2]), most of the terms in eqn (9) pertaining to SO2 decay were very small during SO2 photooxidation within the indoor chamber, meaning that the effect on kjATD estimation of subtracting the terms kOH[OH][SO2] and kjSA[SO2] should also be small. kjATD is defined by the kinetic uptake coefficient (γSO42−,light) of SO2 on ATD particles under UV light, as follows:

 
image file: c6ra09601h-t9.tif(11)

By substituting eqn (2), (4) and (11) with (10), eqn (10) can be rewritten as,

 
image file: c6ra09601h-t10.tif(12)

The analytical solution of eqn (12) can be derived as

 
image file: c6ra09601h-t11.tif(13)

In the present study, both γSO42−,light and γSO42−,dark were calculated using the geometric surface area of ATD particles (SATD). The actual dust particle surface area, which has an irregular shape and porosity, is much larger than the geometric surface area.31,38,45 Thus, the kinetic uptake coefficient based on the geometric surface area should be considered to be the upper limit. With 47.4 m2 g−1 of the BET specific surface area and 2.65 g cm−3 of the density of ATD, the kinetic uptake coefficients using the total geometric surface area is 15.5 times greater than those using the BET surface area.

As discussed above, the contribution of SO2 wall loss to the total SO2 decay is significantly larger than that of other reactions (eqn (6) and (13)). To provide better illustration of formation of sulfate by dust heterogeneous chemistry, eqn (6) and (13) were rearranged into eqn (6)′ and (13)′, respectively as shown in Fig. 2. The SO2 decay rate obtained under UV light is significantly larger than that obtained in the dark. Table 1 summarizes the γSO42−,light and γSO42−,dark values that were semiempirically fit to the experimental data using eqn (6) and (13). The semiempirically predicted values obtained using eqn (6) and (13) are corrected for SO2 loss to the chamber wall and illustrated in Fig. 2. The SO2 decay rate obtained under UV light is significantly larger than that obtained in the dark. The effects of RH on γSO42−,light and γSO42−,dark are discussed in detail in Section 4.2.


image file: c6ra09601h-f2.tif
Fig. 2 The estimation of SO2 decay to predict kinetic uptake coefficients under (a) dark conditions (γSO42−,dark) and (b) UV light (γSO42−,light). S0 represents total concentration of initial geometric surface area of the ATD particles. To provide better illustration of sulfate formation by dust chemistry, eqn (6) was rearranged into (ln[SO2]t/[SO2]0 + kwallt)/S0 = −(1 − exp(−kpt))(ωγSO42−,dark/4kp) (eqn (6)′). Eqn (13) was also rearranged into (ln[SO2]t/[SO2]0 + kwallt)/S0 = −(1 − exp(−kpt))(ωγSO42−,light/4kp) − (1 − exp(−kpt))(ωγSO42−,dark/4kp) (eqn (13)′). “Exp” and “Pre” denote the observed SO2 decay and the semiempirically predicted SO2 decay, respectively.

4. Results and discussion

4.1 Photocatalytic effect of ATD particles on SO2 photooxidation

Overall, ATD particles significantly increased sulfate concentrations in both the absence and presence of UV light compared to SO2 oxidation occurring in the absence of ATD particles. Under UV light, sulfate concentrations determined in the presence of ATD particles (Exp. L2, 2.09 ± 0.04 μg m−3) were significantly greater than those determined in the absence of ATD particles (Exp. L1A, L1B, and L1C, 1.62 ± 0.03 μg m−3 on average). As shown in Table 1, γSO42−,light is substantially greater than γSO42−,dark, proving that mineral dust particles act as critical photocatalysts. For example, γSO42−,light (Exp. L2, (1.15 ± 0.17) × 10−5) at 20% RH was almost 10 times larger than γSO42−,dark (Exp. D1, (1.16 ± 0.11) × 10−6). The present study measured γSO42−,light to determine the extent of sulfate formation after the available dust surface is saturated with SO2. SO2 decay was estimated from the sulfate concentration produced via heterogeneous reaction of SO2 on the surface of dust particles (refer to eqn (7)). To account for the reversible adsorption of SO2 observed in most previous studies, the SO2 uptake coefficient has typically been determined by measuring pre-saturation SO2 adsorption using very low initial SO2 concentrations (1–10 ppb) and high concentrations of dust particles. SO2 uptake coefficients previously reported for ATD38 and authentic mineral dust (China losses and Saharan dust)32,45 were several orders of magnitude (∼103) higher than the values of γSO42−,dark determined by the present study. Thus, it may be that the sulfate formation reaction is not hampered by either gas-phase diffusion or the adsorption process under the experimental conditions employed therein.

Fig. 3 presents the proposed reaction mechanisms for heterogeneous SO2 photooxidation on the surface of ATD particles. Metal oxides (i.e., photoactive semiconductor materials) present in ATD particles can generate electron (ecb)–hole (h+vb) pairs, which are involved in oxidation and reduction processes.28,46,47 O2 molecules adsorbed on metal oxides act as electron acceptors and produce highly reactive superoxide radical anions (O2). Simultaneously, H2O reacts with h+vb and produces a hydroxyl radical (OH). SO2 adsorption mainly occurs by oxidation via OH radicals on the dust surface, leading to the production of SO3. The resulting SO3 is hydrated and converted to H2SO4.48–50 Although a few studies46 have proposed that sulfate formation is enhanced by SO2 oxidation via OH radicals produced by a photocatalytic mechanism on the surface of iron oxide and ATD particles, a corresponding kinetic rate constant (e.g., γSO42−,light) has not been reported.


image file: c6ra09601h-f3.tif
Fig. 3 Reaction mechanisms for heterogeneous photooxidation of SO2 on the surfaces of mineral dust particles in the presence of O3[thin space (1/6-em)]31,32 and NO2.54,55 ecb represents electrons generated in the conduction band, and h+vb represents holes generated in the valence band.

4.2 Effect of RH on SO2 oxidation in the presence of ATD particles

Fig. 4 shows the γSO42−,dark and γSO42−,light values measured under three different RHs (Exp. D1, D2, and D3 vs. Exp. L2, L3, and L4 in Table 1). Presumably, both γSO42−,dark and γSO42−,light exponentially increase as a function of RH. For example, the difference in γSO42−,dark values obtained at 20% RH and 55% RH under dark conditions was relatively small, but the γSO42−,dark value greatly increased at RH 81%, as shown in Fig. 4 and Table 1. Regarding the reversible uptake of SO2 on ATD particles under dark conditions, Huang et al.38 have also reported an increase of SO2 uptake on ADT particles with increasing RH (from (0.35 ± 0.01) × 10−4 to (0.92 ± 0.08) × 10−4 as RH increased from 0% to 90%). γSO42−,dark obtained in the current study is ∼100 times lower than uptake coefficient by Huang et al. γSO42−,dark is directly related to sulfate production while uptake coefficient by Huang et al. was calculated from SO2 decay data, which are influenced by SO2 adsorption on dust particles, sulfite formation, and sulfate formation.
image file: c6ra09601h-f4.tif
Fig. 4 The symbols represent estimated γSO42−,light and γSO42−,dark values of SO2 using eqn (6) and (13) in the presence of ATD particles measured under three different RH conditions with and without UV light. The lines were obtained by fitting the experimental data to the exponential regression equations.

Water adsorbed on metal oxide particles can inhibit SO2 oxidation because water molecules compete with SO2 molecules for surface active sites, leading to suppression of surface reactivity toward SO2. Unlike pure metal oxides, however, mineral dust particles contain small amounts of hygroscopic inorganic salts, such as sulfate. For example, the indigenous sulfate concentration on ATD particles was nearly 35% for Exp. D1 in Table 1. The indigenous sulfate that forms salts with the alkaline components (e.g., K, Na, Ca and Mg ions) of dust can be efflorescence (RH 40–50%) and affects the water uptake of dust particles. In general, the aerosol water content increases exponentially above the efflorescence RH.51 The higher water content on dust under higher RH conditions increases SO2 uptake as well as sulfate formation.

4.3 Aerosol acidity to measure carbonates depletion

To investigate the chemical reactions between H2SO4 and alkaline carbonates on ATD particles, the acidity ([H+]) of ATD particles was measured using both C-RUV ([H+]C-RUV) and compared to the [H+] predicted using IC data ([H+]PILS-IC) (Fig. 5). SO2 was photooxidized in the presence of ATD particles using two different SO2 concentrations (high SO2 = 276 ppm and low SO2 = 153 ppb) within a large outdoor chamber (Table S1), which provided a great enough volume for aerosol characterization via both C-RUV and IC. Partial neutralization of H2SO4 with ammonia was inevitable because ammonia off-gasses from the chamber wall during the daytime due to decomposition of ammonium sulfate carried over from previous chamber experiments. Most sulfate originated from SO2 oxidation (indigenous sulfate of ATD was only 3% of total sulfates) (Fig. 5(a)). [H+]PILS-IC was determined using concentrations of sulfates and ammonium ions integrated via an inorganic thermodynamic model.42 [H+]C-RUV was determined via in situ thermodynamic equilibrium dissociation of the sulfate-ammonia after reactions of sulfate with alkaline carbonates (depletion of carbonate). When [H+]C-RUV is reduced mainly by H2SO4 neutralization with ammonia, [H+]C-RUV should be similar to [H+]PILS-IC. When H2SO4 forms salts with alkaline ions (counter part of carbonates), [H+]C-RUV becomes less than [H+]PILS-IC. Fig. 5(a) suggests, based on IC data, that most of the H2SO4 produced using a low SO2 concentration was neutralized by ammonia, and, thus, reactions of H2SO4 with alkaline carbonates were insignificant. When produced using a high concentration of SO2, H2SO4 was partially neutralized with ammonia. As shown in Fig. 5(b), [H+]C-RUV was significantly lower than [H+]PILS-IC, proving that the remaining acidic sulfate reacted with dust particles. The aerosol acidity determined by C-RUV data indicates that the chemical composition of the dust surface can be modified when acidic sulfate is available, that is, when the concentration of ammonia is not high enough to neutralize H2SO4 (Fig. 5(b)). Sulfate substitution by carbonates on dust particles was also observed during dust episodes in spring 2006 in Japan.52
image file: c6ra09601h-f5.tif
Fig. 5 The inorganic compositions of photochemically aged ATD particles under conditions of low and high SO2 concentrations (a). Comparison between [H+]C-RUV and [H+]PILS-IC (b). The concentration of sulfate was subtracted by that of indigenous sulfate originating from ATD particles. The indigenous sulfate concentration of dust particles was trivial (about 3% of total sulfate).

Modification of the chemical composition of dust particles can impact their hygroscopic properties and CCN activities. Fan et al.53 reported speculation that sulfate and nitrate uptake can render hydrophobic dust particles hydrophilic. However, Shi et al.52 reported that sulfate substitution with carbonates decreased water affinity.

4.4 Effects of O3 and NO2 on SO2 oxidation in the presence of ATD particles

The effects of O3 and NO2 on both γSO42−,dark and γSO42−,light are also summarized in Table 1. Under UV light and in the presence of O3, the value determined for γSO42−,light (Exp. L6: (5.35 ± 0.58) × 10−5) was substantially greater than that of γSO42−,dark (Exp. D4: (4.66 ± 0.55) × 10−6). The photocatalytic effect in the presence of O3 (Exp. L6 vs. Exp. D4) was even greater than that observed in the absence of O3 (Exp. D1 vs. Exp. L2). The mechanisms of heterogeneous SO2 reactions in the presence of O3 are illustrated in Fig. 3.47 O3 is reduced to the ozonide radical (O3) by a photochemically generated electron (ecb). The O3 radical can rapidly react with water and produce hydrogen trioxy radicals (HO3˙). Dissociation of HO3˙ produces another OH radical (Fig. 3). Even in the absence of UV light, O3 accelerated sulfate formation compared to conditions in which O3 was absent: i.e., (4.66 ± 0.55) × 10−6 in the presence of O3 at 20% RH (Exp. D4) vs. (1.16 ± 0.11) × 10−6 in the absence of O3 at 20% RH (Exp. D1). Gaseous SO2 is adsorbed on the surfaces of mineral dust particles and forms SO32− with adsorbed water. The SO32− that is produced from dissolved SO2 in the water layers of dust particles is oxidized to sulfate by reaction with O3.31,32

In the presence of NO2 and ATD particles, the value determined for γSO42−,light (Exp. L8: (9.30 ± 0.63) × 10−5) is ∼8 times higher than that obtained in the absence of NO2 (Exp. L2: (1.15 ± 0.17) × 10−5), demonstrating the significant impact of NO2 on SO2 uptake. Through dust-induced heterogeneous photochemical processes (Fig. 3), NO2 forms HONO, which can also be a source of OH radicals via photolysis.54,55 In a recent field study by Nie et al.,56 increasing TiO2 contents in dust particles were positively correlated with nitrite formation via heterogeneous photochemical reactions. These researchers proposed that HONO was sourced from NO2 due to the photocatalytic capability of TiO2 during the daytime. Saliba et al.57 found that HONO concentrations were 2–3 times higher during African and Arabian dust storms between October 2009 and April 2011 compared to those determined on non-dusty days.57 Under dark conditions, the value of γSO42−,dark slightly increased in the presence of NO2 (Exp. D5: (2.10 ± 0.08) × 10−5 at 20% RH) compared to that obtained in the absence of NO2 (Exp. D1: (1.16 ± 0.11) × 10−6 at 20% RH), although this effect was less severe than the effect of O3.

5. Atmospheric implications and conclusions

The reversible uptake coefficient of SO2 on mineral dust particles has been used to estimate the removal rate of gaseous SO2[thin space (1/6-em)]58–60 and applied to simulation of the formation of sulfate via a regional model. The reversible uptake coefficients of SO2 (i.e., loss rate of gaseous SO2 on dust surface) range from 10−4 to 10−6.25,32,45,58,61 These uptake coefficients vary with types of mineral dust particles, sample preparation methods (airborne dust particles and the filter with predeposited dust particles in the absence and the presence of water extraction), concentration of SO2, and measurement methods (i.e., direct measurement of sulfate and SO2 decay). The conventional uptake coefficient of SO2, which uses SO2 decay data, is appropriate for the estimation of the removal of SO2 in the presence of relatively low SO2 concentrations. In the present study, we calculated kinetic uptake coefficient of SO2 to augment the prediction of formation of sulfate using airborne dust particles. Overall, the kinetic uptake coefficient (γSO42−,light) of SO2 in the presence of ATD particles under UV light was one order of magnitude higher than that (γSO42−,dark) obtained under dark conditions (Exp. L2 vs. Exp. D1 in Table 1). Our findings suggest that dust-driven photocatalytic processes of SO2 should be incorporated into future atmospheric kinetic models to improve the accuracy in predicting sulfate formation.

The atmospheric lifetimes of mineral dust particles depend on their sizes. The mass median diameter of dust particles traveling over long distances is usually smaller than 10 μm.7 The lifetimes of large dust particles (5.0–10 μm) are ∼1.1 days, whereas the lifetimes of sub-micron-sized dust particles (0.1–1.0 μm) can reach up to 17 days.62 The reported average lifetime of dust particles is about ∼4.3 days.62,63 During long-range transport within this time scale, mineral dust particles can experience atmospheric aging and modulate the formation of sulfate via heterogeneous reaction of SO2. The lifetime of SO2 undergoing reactions with OH radicals (on average 106 molecule per cm in urban areas, rate constant: (1.1 ± 0.2) × 10−12 cm3 s−1) is approximately 10 days; however, the reported actual residence time of SO2 for this chemical reaction is approximately 3.3 days under conditions of heterogeneous chemistry in the presence of an atmospheric aerosol.38,45,64,65 Based on the experimental conditions employed herein and using Exp. L8 (in the presence of NOx and dust), the estimated lifetime of SO2 is approximately 4 days. Compared to the reaction of SO2 with OH radicals in the gas phase, heterogeneous chemistry in the presence of ATD particles should significantly contribute to both the lifetime of SO2 and sulfate production (3.3 days vs. 4 days).

High NOx concentrations are found in polluted urban areas. In the presence of high NOx levels, ozone formation is often suppressed. For example, average concentrations of NOx and O3 were 62.7 ± 4.0 ppb and 11.9 ± 0.8 ppb, respectively, with hourly maximum values of 303.9 ppb and 69.7 ppb, respectively, in Beijing from November 2007 to March 2008.39 In general, sulfate production declines with higher NOx concentrations due to the decreased oxidation capacity of the photooxidation system.66 However, high NOx concentrations (mean NOx concentration = ∼183 ppb) promoted sulfate formation in the present study (Exp. L2 vs. L8 in Table 1). When the γSO42−,dark and γSO42−,light values obtained herein are applied to the observed sulfate production trend, sulfate formation determined using γSO42−,light (daytime) in urban environments with high NOx concentrations can be 2–3 orders of magnitude greater than that obtained using γSO42−,dark (nighttime) under low NO2 levels (D1 vs. L2 and L8 in Table 1). In previously reported studies, such elevations in sulfate concentration have also been observed in urban atmospheres.67–69

Although the SO2, and NO2 concentrations employed in the current chamber study can mimic polluted urban environments,3,34,39,40 the chemical compositions of the ATD particles utilized in the present study differ from those of authentic dust generated during dust storms. For example, the amount of catalytic metal oxides (e.g., TiO2, Fe2O3, Al2O3, and ZnO) is higher in authentic field dust and activates the production of sulfate by heterogeneous photocatalytic reactions. The indigenous salt contents of ATD and authentic dust also differ and influence differently the hygroscopic property of dust, which appears to be high in authentic dust (see Section 4.3). In addition to the chemical compositions of dust particles, the indoor chamber lighting conditions differ from natural sunlight in light intensity as well as the shape of the corresponding light spectrum. The intensity of sunlight is stronger for wavelengths greater than 300 nm but weaker for wavelengths less than 300 nm. With regard to applying γSO42−,light values to ambient conditions, the γSO42−,light values reported in the present study should be revisited using simulations in an outdoor chamber and with authentic dust particles. Overall, we expected that, compared to measurements obtained using the indoor chamber and ATD particles, both γSO42−,dark and γSO42−,light values would be greater in the presence of authentic dust particles under ambient conditions and sulfate production would increase.

Acknowledgements

This work was supported by grants from the National Institute of Metrological Research (NIMS-2016-3100) and the grant from the National Research Funding of Korea (2014M3C8A5032316).

References

  1. Y. Peng, K. von Salzen and J. Li, Atmos. Chem. Phys., 2012, 12, 6891–6914 CrossRef CAS.
  2. C. Textor, M. Schulz, S. Guibert, S. Kinne, Y. Balkanski, S. Bauer, T. Berntsen, T. Berglen, O. Boucher, M. Chin, F. Dentener, T. Diehl, R. Easter, H. Feichter, D. Fillmore, S. Ghan, P. Ginoux, S. Gong, A. Grini, J. Hendricks, L. Horowitz, P. Huang, I. Isaksen, I. Iversen, S. Kloster, D. Koch, A. Kirkevåg, J. E. Kristjansson, M. Krol, A. Lauer, J. F. Lamarque, X. Liu, V. Montanaro, G. Myhre, J. Penner, G. Pitari, S. Reddy, Ø. Seland, P. Stier, T. Takemura and X. Tie, Atmos. Chem. Phys., 2006, 6, 1777–1813 CrossRef CAS.
  3. X. Y. Zhang, Y. Q. Wang, T. Niu, X. C. Zhang, S. L. Gong, Y. M. Zhang and J. Y. Sun, Atmos. Chem. Phys., 2012, 12, 779–799 CrossRef CAS.
  4. F. J. Dentener, G. R. Carmichael, Y. Zhang, J. Lelieveld and P. J. Crutzen, J. Geophys. Res.: Atmos., 1996, 101, 22869–22889 CrossRef CAS.
  5. J. M. Prospero, P. Ginoux, O. Torres, S. E. Nicholson and T. E. Gill, Rev. Geophys., 2002, 40, 2 CrossRef.
  6. T. Y. Tanaka and M. Chiba, Global Planet. Change, 2006, 52, 88–104 CrossRef.
  7. J. M. Prospero, Proc. Natl. Acad. Sci. U. S. A., 1999, 96, 3396–3403 CrossRef CAS.
  8. Y. Shao, K.-H. Wyrwoll, A. Chappell, J. Huang, Z. Lin, G. H. McTainsh, M. Mikami, T. Y. Tanaka, X. Wang and S. Yoon, Aeolian Research, 2011, 2, 181–204 CrossRef.
  9. C. L. Ryder, E. J. Highwood, T. M. Lai, H. Sodemann and J. H. Marsham, Geophys. Res. Lett., 2013, 40, 2433–2438 CrossRef.
  10. S. C. Alfaro, S. Lafon, J. L. Rajot, P. Formenti, A. Gaudichet and M. Maille, J. Geophys. Res.: Atmos., 2004, 109, D08208 CrossRef.
  11. Y. Balkanski, M. Schulz, T. Claquin and S. Guibert, Atmos. Chem. Phys., 2007, 7, 81–95 CrossRef CAS.
  12. I. N. Sokolik, D. M. Winker, G. Bergametti, D. A. Gillette, G. Carmichael, Y. J. Kaufman, L. Gomes, L. Schuetz and J. E. Penner, J. Geophys. Res.: Atmos., 2001, 106, 18015–18027 CrossRef CAS.
  13. D. Rosenfeld, Y. Rudich and R. Lahav, Proc. Natl. Acad. Sci. U. S. A., 2001, 98, 5975–5980 CrossRef CAS PubMed.
  14. T. D. Jickells, Z. S. An, K. K. Andersen, A. R. Baker, G. Bergametti, N. Brooks, J. J. Cao, P. W. Boyd, R. A. Duce, K. A. Hunter, H. Kawahata, N. Kubilay, J. laRoche, P. S. Liss, N. Mahowald, J. M. Prospero, A. J. Ridgwell, I. Tegen and R. Torres, Science, 2005, 308, 67–71 CrossRef CAS PubMed.
  15. N. M. Mahowald, A. R. Baker, G. Bergametti, N. Brooks, R. A. Duce, T. D. Jickells, N. Kubilay, J. M. Prospero and I. Tegen, Global Biogeochem. Cycles, 2005, 19, GB4025 Search PubMed.
  16. A. Tagliabue, L. Bopp and O. Aumont, Geophys. Res. Lett., 2009, 36, L13601 CrossRef.
  17. K. W. Kim, Y. J. Kim and S. J. Oh, Atmos. Environ., 2001, 35, 5157–5167 CrossRef CAS.
  18. E.-H. Lee and B.-J. Sohn, Atmos. Environ., 2011, 45, 4611–4616 CrossRef CAS.
  19. Z. Meng and B. Lu, Atmos. Environ., 2007, 41, 7048–7058 CrossRef CAS.
  20. L. Perez, A. Tobias, X. Querol, N. Kunzli, J. Pey, A. Alastuey, M. Viana, N. Valero, M. Gonzalez-Cabre and J. Sunyer, Epidemiology, 2008, 19, 800–807 CrossRef PubMed.
  21. A. E. Michel, C. R. Usher and V. H. Grassian, Geophys. Res. Lett., 2002, 29, 10 CrossRef.
  22. A. E. Michel, C. R. Usher and V. H. Grassian, Atmos. Environ., 2003, 37, 3201–3211 CrossRef CAS.
  23. C. R. Usher, A. E. Michel, D. Stec and V. H. Grassian, Atmos. Environ., 2003, 37, 5337–5347 CrossRef CAS.
  24. G. M. Underwood, C. H. Song, M. Phadnis, G. R. Carmichael and V. H. Grassian, J. Geophys. Res.: Atmos., 2001, 106, 18055–18066 CrossRef CAS.
  25. M. Ullerstam, M. S. Johnson, R. Vogt and E. Ljungström, Atmos. Chem. Phys., 2003, 3, 2043–2051 CrossRef CAS.
  26. K. Wang, Y. Zhang, A. Nenes and C. Fountoukis, Atmos. Chem. Phys., 2012, 12, 10209–10237 CrossRef CAS.
  27. S. J. Smith, J. van Aardenne, Z. Klimont, R. J. Andres, A. Volke and S. Delgado Arias, Atmos. Chem. Phys., 2011, 11, 1101–1116 CrossRef CAS.
  28. C. R. Usher, A. E. Michel and V. H. Grassian, Chem. Rev., 2003, 103, 4883–4939 CrossRef CAS PubMed.
  29. X. Zhang, G. Zhuang, J. Chen, Y. Wang, X. Wang, Z. An and P. Zhang, J. Phys. Chem. B, 2006, 110, 12588–12596 CrossRef CAS PubMed.
  30. L. Li, Z. M. Chen, Y. H. Zhang, T. Zhu, J. L. Li and J. Ding, Atmos. Chem. Phys., 2006, 6, 2453–2464 CrossRef CAS.
  31. M. Ullerstam, R. Vogt, S. Langer and E. Ljungstrom, Phys. Chem. Chem. Phys., 2002, 4, 4694–4699 RSC.
  32. C. R. Usher, H. Al-Hosney, S. Carlos-Cuellar and V. H. Grassian, J. Geophys. Res.: Atmos., 2002, 107, ACH 16-11–ACH 16-19 CrossRef.
  33. L. Y. Wu, S. R. Tong, W. G. Wang and M. F. Ge, Atmos. Chem. Phys., 2011, 11, 6593–6605 CrossRef CAS.
  34. H. He, Y. Wang, Q. Ma, J. Ma, B. Chu, D. Ji, G. Tang, C. Liu, H. Zhang and J. Hao, Sci. Rep., 2014, 4, 4172 CrossRef PubMed.
  35. C. Liu, Q. Ma, Y. Liu, J. Ma and H. He, Phys. Chem. Chem. Phys., 2012, 14, 1668–1676 RSC.
  36. Q. Ma, Y. Liu and H. He, J. Phys. Chem. A, 2008, 112, 6630–6635 CrossRef CAS PubMed.
  37. W. Hua, Z. M. Chen, C. Y. Jie, Y. Kondo, A. Hofzumahaus, N. Takegawa, C. C. Chang, K. D. Lu, Y. Miyazaki, K. Kita, H. L. Wang, Y. H. Zhang and M. Hu, Atmos. Chem. Phys., 2008, 8, 6755–6773 CrossRef CAS.
  38. L. Huang, Y. Zhao, H. Li and Z. Chen, Environ. Sci. Technol., 2015, 49, 10797–10805 CrossRef CAS PubMed.
  39. W. Lin, X. Xu, B. Ge and X. Liu, Atmos. Chem. Phys., 2011, 11, 8157–8170 CrossRef CAS.
  40. T. Francis, J. Environ. Prot., 2011, 2, 778–795 CrossRef.
  41. J. Li and M. Jang, Aerosol Sci. Technol., 2012, 46, 833–842 CrossRef CAS.
  42. S. L. Clegg, P. Brimblecombe and A. S. Wexler, J. Phys. Chem. A, 1998, 102, 2137–2154 CrossRef CAS.
  43. Y. Im, M. Jang and R. L. Beardsley, Atmos. Chem. Phys., 2014, 14, 4013–4027 CrossRef.
  44. M. Jang, G. Cao and J. Paul, Aerosol Sci. Technol., 2008, 42, 409–420 CrossRef CAS.
  45. J. W. Adams, D. Rodriguez and R. A. Cox, Atmos. Chem. Phys., 2005, 5, 2679–2689 CrossRef CAS.
  46. Y. Dupart, S. M. King, B. Nekat, A. Nowak, A. Wiedensohler, H. Herrmann, G. David, B. Thomas, A. Miffre, P. Rairoux, B. D'Anna and C. George, Proc. Natl. Acad. Sci. U. S. A., 2012, 109, 20842–20847 CrossRef CAS PubMed.
  47. C. George, B. D'Anna, H. Herrmann, C. Weller, V. Vaida, D. J. Donaldson, T. Bartels-Rausch and M. Ammann, in Atmospheric and Aerosol Chemistry, ed. F. V. McNeill and A. P. Ariya, Springer Berlin Heidelberg, Berlin, Heidelberg, 2014, pp. 1–53,  DOI:10.1007/128_2012_393.
  48. J. T. Jayne, U. Pöschl, Y.-m. Chen, D. Dai, L. T. Molina, D. R. Worsnop, C. E. Kolb and M. J. Molina, J. Phys. Chem. A, 1997, 101, 10000–10011 CrossRef CAS.
  49. T. Loerting and K. R. Liedl, Proc. Natl. Acad. Sci. U. S. A., 2000, 97, 8874–8878 CrossRef CAS.
  50. H. Chen, C. E. Nanayakkara and V. H. Grassian, Chem. Rev., 2012, 112, 5919–5948 CrossRef CAS PubMed.
  51. Q. Q. Wu, L. B. Huang, H. Liang, Y. Zhao, D. Huang and Z. M. Chen, Atmos. Chem. Phys., 2015, 15, 6851–6866 CrossRef CAS.
  52. Z. Shi, D. Zhang, M. Hayashi, H. Ogata, H. Ji and W. Fujiie, Atmos. Environ., 2008, 42, 822–827 CrossRef CAS.
  53. S.-M. Fan, L. W. Horowitz, H. Levy and W. J. Moxim, Geophys. Res. Lett., 2004, 31, L02104 CrossRef.
  54. M. Ndour, P. Conchon, B. D'Anna, O. Ka and C. George, Geophys. Res. Lett., 2009, 36, L05816 CrossRef.
  55. Y. Dupart, L. Fine, B. D'Anna and C. George, Aeolian Research, 2014, 15, 45–51 CrossRef.
  56. W. Nie, T. Wang, L. K. Xue, A. J. Ding, X. F. Wang, X. M. Gao, Z. Xu, Y. C. Yu, C. Yuan, Z. S. Zhou, R. Gao, X. H. Liu, Y. Wang, S. J. Fan, S. Poon, Q. Z. Zhang and W. X. Wang, Atmos. Chem. Phys., 2012, 12, 11985–11995 CrossRef CAS.
  57. N. A. Saliba, S. G. Moussa and G. El Tayyar, Atmos. Chem. Phys. Discuss., 2014, 14, 4827–4839 CrossRef.
  58. J. N. Crowley, M. Ammann, R. A. Cox, R. G. Hynes, M. E. Jenkin, A. Mellouki, M. J. Rossi, J. Troe and T. J. Wallington, Atmos. Chem. Phys., 2010, 10, 9059–9223 CrossRef CAS.
  59. S. Zhu, T. Butler, R. Sander, J. Ma and M. G. Lawrence, Atmos. Chem. Phys., 2010, 10, 3855–3873 CrossRef CAS.
  60. R. Kumar, M. C. Barth, S. Madronich, M. Naja, G. R. Carmichael, G. G. Pfister, C. Knote, G. P. Brasseur, N. Ojha and T. Sarangi, Atmos. Chem. Phys., 2014, 14, 6813–6834 CrossRef.
  61. Q. Ma, Y. Liu, C. Liu, J. Ma and H. He, J. Environ. Sci., 2012, 24, 62–71 CrossRef CAS.
  62. C. S. Zender, H. Bian and D. Newman, J. Geophys. Res.: Atmos., 2003, 108, 4416 CrossRef.
  63. C. S. Zender, R. L. R. L. Miller and I. Tegen, Trans., Am. Geophys. Union, 2004, 85, 509–512 CrossRef.
  64. N. A. Krotkov, M. R. Schoeberl, G. A. Morris, S. Carn and K. Yang, J. Geophys. Res., 2010, 115, D00L20 CrossRef.
  65. I. Barnes, V. Bastian, K. H. Becker, E. H. Fink and W. Nelsen, J. Atmos. Chem., 1986, 4, 445–466 CrossRef CAS.
  66. B. Chu, T. Liu, X. Zhang, Y. Liu, Q. Ma, J. Ma, H. He, X. Wang, J. Li and J. Hao, Sci. China: Chem., 2015, 58, 1426–1434 CrossRef CAS.
  67. R. Zhang, R. Arimoto, J. An, S. Yabuki and J. Sun, J. Geophys. Res.: Atmos., 2005, 110, D18S06 Search PubMed.
  68. Y. Wang, Q. Zhang, J. Jiang, W. Zhou, B. Wang, K. He, F. Duan, Q. Zhang, S. Philip and Y. Xie, J. Geophys. Res.: Atmos., 2014, 119, 10 Search PubMed.
  69. W. J. Li and L. Y. Shao, Aerosol Air Qual. Res., 2012, 12, 1095–1104 CAS.

Footnote

Electronic supplementary information (ESI) available. See DOI: 10.1039/c6ra09601h

This journal is © The Royal Society of Chemistry 2016
Click here to see how this site uses Cookies. View our privacy policy here.