DOI:
10.1039/C6RA09530E
(Paper)
RSC Adv., 2016,
6, 57739-57750
Nano-engineering of liposomes using a supercritical CO2 mediated gas anti-solvent method†
Received
13th April 2016
, Accepted 2nd June 2016
First published on 2nd June 2016
Abstract
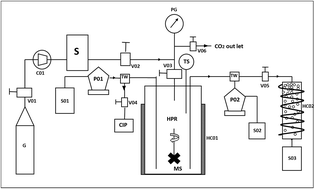
Nano-liposomes were designed using a supercritical (SC) gas anti-solvent (GAS) method. The present approach was configured to combine two steps, i.e., (1) the SC-CO2 assisted drying of phospholipids to form a uniform layer; and (2) the hydration under pressure and depressurization of the SC liquid phase to generate nano-liposomes. The effects of pressure, temperature and surfactant concentration (Tween 80) were evaluated for the production of nano-liposomes. The SC-GAS method was compared with Bangham's method in terms of the mean diameter, coefficient of uniformity, morphology, stability index and actual energy required for liposome formation. Liposomes obtained using Bangham's method were multi-lamellar vesicles, having a coefficient of uniformity of 12.07 ± 0.024 with a mean diameter of 4.64 ± 0.010 μm, exhibiting the irregular thickness of the bilayer. Liposome production using the SC-GAS method under optimized formulation conditions, i.e., 170 bar, 50 °C, 1.5% Tween 80 and a depressurization rate of 25 bar min−1, yielded nano-liposomes exhibiting a coefficient of uniformity of 1.10 ± 0.012 with a mean diameter of 0.063 ± 0.002 μm. The stability index and viscosity of the prepared liposome suspension indicate greater stability and near Newtonian behaviour respectively. The SC-GAS process requires 1.52 times less energy compared to Bangham's method to achieve nano-scale liposome production. Storage studies indicate that SC-GAS based nano-liposomes were highly stable for up to 3 months at different temperatures.
Introduction
The targeted and sustained release of drugs and/or active principles is one of the challenging tasks in current drug delivery systems. The application of nano-science in the development of delivery systems has become a major focus of recent research, with promising perspectives. Because, unfortunately, most phytochemicals/drugs are biologically unstable, poorly soluble in water, and distribute poorly to target sites, and, moreover, the dosing of these compounds is still problematic, and excessive doses can cause negative effects.1 So, the development of suitable delivery systems is urgently needed, to address these challenges. Drug delivery through nano-sized colloidal systems like nano-liposomes, nano-emulsions and other nano-carriers is a potential solution and is becoming accepted, reaping enormous demand in the fields of food, pharmaceuticals and nutraceuticals. Liposomes have attracted much attention as potential carriers of drugs for systematic use2 and liposome based encapsulation processes have received increased interest over the years for various applications. This is because liposomes happen to be potent drug delivery systems because of their ability to meet several requirements such as the stability of the active molecules, the yield and the efficiency of the drug encapsulation, the reproducibility of the micro/nano-particle quality and the drug release profile, and the residual levels of organic solvent in the particles. Basically, liposomes are composed of one or more bilayers of amphipathic molecules (e.g. phospholipids) surrounded by an aqueous continuous phase. The major advantage of liposomal encapsulation is that both hydrophilic and hydrophobic molecules can be intercalated.3 Moreover the surface of liposomes offers flexibility for any modifications to achieve the site specific unloading of active principles and/or drugs.
Further, the selection of appropriate technology for liposome production should fulfil all the requirements for evolution as an efficient drug delivery system and, moreover, the method used to produce liposomes should achieve high entrapment efficiency, a narrow size distribution, long-term stability, and protective properties for biomolecules. The conventional preparation of liposomes unfortunately involves the evaporation of organic solvents, thin-film dispersion, melting, freeze–thaw methods, injection,4 the preparation of vesicles by sonication, and dialysis to provide unilamellar vesicles.5–7 Recently many methods have been developed for liposome production that include microfluidic hydrodynamic focusing,8,9 membrane technology,10 dual asymmetric centrifugation,11 high pressure homogenization, etc.
The supercritical method is a novel approach by which liposomes can be made in a single step by making use of supercritical carbon dioxide (SCCO2).12 This technique has many advantages over conventional methods for liposomal production, with a maximum entrapment efficiency approximately 8 times higher, a uniformly spherical shape, highly stability, and a narrowly dispersed distribution, thus increasing drug efficacy and targeting.13–15 Zarena et al. (2011) have reviewed the variety of methods to produce submicron- and nano-particles using SCCO2, which are: rapid expansion of supercritical solutions (RESS), gas anti-solvent (GAS), precipitation with compressed anti-solvent process (PCA), and solution enhanced dispersion using supercritical fluids (SEDS and PGSS), to form particles utilizing SCCO2.16 Further, GAS is a more universal process and offers greater flexibility than the variants because the compounds to be encapsulated need not to be dissolved in SCCO2. Both hydrophilic and hydrophobic compounds can be entrapped into lipid vesicles. Kadimi et al. (2007) have claimed an intercalation efficiency (IE) of 20% for amphotericin B and in a similar study, an IE of 28% for sea buckthorn leaf extract with a narrow range of size distribution (0.48–1.07 μm), prepared using SCCO2 methods.17,18 Liposome preparation in batch mode using a modified supercritical method improved the particle size in the ranges of 265 and 214 nm.19,20 Further efforts have been made to further decrease the particle size to 146 nm and demonstrate the superior characteristics of liposomes over traditional methods.21
Previous attempts to engineer liposomes using the GAS method17,18 were successful in the submicron range (<1 μm) in the author's lab. The method has been further modified as per the requirements to produce nano-liposomes (<100 nm) with superior characteristics of stability and uniform distribution. The existing method was advanced to run liposome production in fed-batch mode with a provision for CIP. As per our knowledge, this is the first study reporting a fed-batch mode for engineering nano-sized liposomes for the entrapment of both hydrophilic and hydrophobic active principles. The major objective of the current study is to evaluate the SCCO2 mediated particle design setup, facilitating the one step production of nano-liposomes (<100 nm) using a GAS technique. The specific objective was the selection of favourable operating ranges for the major processing parameters, i.e., pressure, temperature and surfactant concentration, and their effect on liposome characteristics (particle size distribution, morphology and stability). Liposomes prepared with the supercritical method were compared to those obtained with Bangham's method.
Experimental
Materials and methods
Materials. Soy lecithin obtained from Sakthi Chemicals (Coimbatore, TN, India) composed of a natural mixture of phospholipids (phosphatidylcholine (PC), phosphatidylethanolamine (PE), phosphatidylinositol (PI) and phosphatidic acid (PA)), glycolipids and triglycerides was used for liposome formation. Cholesterol (99% purity) and Tween 80 were purchased from Sigma chemical (Bengaluru, India). Other reagents of analytical grade were purchased from Rankem (Bangalore, India). Food grade CO2 (with a purity of 99.9%) from local suppliers (Mysore, India) was used for the process of liposome preparation.
Preparation of nano-sized liposomes using the SC-GAS method. Fig. 1 illustrates a schematic diagram of the system employed for liposome production based on the GAS principle. The process involves two major steps, (a) the SCCO2 assisted drying of liposomal content on the removal of organic solvents under the effect of temperature and pressurized SCCO2 to form a uniform layer; and (b) the hydration of lipids under pressure to form large unilamellar vesicles (LUV) following nano-sized liposome production through depressurization (Fig. 2A). About 1 g of liposomal content, i.e., soy lecithin (SL) and cholesterol (Chol) (4
:
1 w/w), was dissolved with a mixture of chloroform and ethanol (3
:
1 v/v) in the ratio of 1
:
3 (w/v) and loaded into the 500 ml high-pressure reactor vessel (Berghof autoclave, HPR, Germany). The vessel was equilibrated until the set temperature was reached and then pressurized with CO2 up to the required pressure. Initially the experiments were carried in batch mode to optimize favourable operating ranges for the pressure, temperature and surfactant content. CO2 was compressed with the compressor (C01) to attain the required pressure and then released into the pressure vessel through valves V01–V03. After sealing the top with a lid, the vessel was gently flushed with CO2 to remove air trapped inside. The magnetic stirrer (MS) at the bottom of the cell was kept off during the first step of liposome formation, i.e., the drying of lipids could lead to the formation of a thick cake of liposomal material, which is unfavourable for the dispersion of lipid molecules into the aqueous phase. After 15 min of lipid drying, the SCCO2 was depressurized for 10 s to flush out solvent vapour through the valve V06, to ensure a homogenous SCCO2 phase inside the vessel. To the dried liposomal material, phosphate buffer saline (PBS, pH 7.2) containing surfactant (Tween 80) was pumped at the ratio of (liposome content
:
PBS) 1
:
30 (w/v) into the vessel with the help of a HPLC pump (P02), to facilitate the hydration of the lipid, for 1 h with stirring at 500 rpm to ensure the complete dispersion of the lipid in the aqueous phase. Liposomes were collected (S03) under atmospheric pressure in the collection chamber, which was maintained at a temperature of 60 °C through depressurizing the supercritical liquid phase (LUV) at a constant rate of 25 bar min−1 through the micro metering valve (V05), while the pressure inside the vessel was maintained at a constant value by keeping the gas inlet valve open (V01–V03). After the completion of a batch, the vessel was cleaned and rinsed with organic solvent pumped through a HPLC pump (P01) under pressure to remove residual liposomal contents through the valve V04. Fresh liposomal material dissolved in organic solvent (S01) was again pumped into the vessel through a HPLC pump (P01) and the required pressure was adjusted once the set temperature was obtained and the process continued as detailed above. The experimental process was optimized through tuning the process parameters such as the pressure, temperature and Tween 80 concentration between 50–200 bar, 40–65 °C and 0–4%, respectively.
 |
| Fig. 1 Illustration of the system used for the preparation of liposomes using the SCF-CO2-GAS technique. (G) CO2 tank; (V01–V05) on/off high pressure needle valves; (TW) three way valve; (C01) compressor; (S) surge tank; (P01, P02) HPLC pumps; (HPR) high pressure reactor; (PG) pressure guage; (TS) temperature sensor; (HC01, HC02) heating coils; (S01–S03) sample vials; (MS) magnetic stirrer; and (CIP) clean in process. | |
 |
| Fig. 2 (A) Stepwise liposome production using the SC-GAS technique; (B) phenomena of liposome formation under the SC-GAS technique. | |
Preparation of liposomes using a thin film method (Bangham's method). Liposomes were prepared using a conventional process for comparison, with the liposomes formed using the SC-GAS method, using SL and Chol (4
:
1 w/w). The liposomal contents were dissolved in a mixture of chloroform and ethanol (3
:
1 v/v) in the ratio of 1
:
20 (w/v). The organic solvents were removed under reduced pressure in a rotary evaporator at 65 °C (above the lipid-transition temperature). After 1 hour, for equilibration, a PBS (pH 7.2)/Tween 80 surfactant (1.5%, w/v) solution was introduced under vacuum and hydrated for 2 hours for better encapsulation.18
Characterization of the liposomes
Mean particle diameter and coefficient of uniformity (Cu). The mean particle size was determined using a Microtrac instrument (Model: S3500, Microtrac Inc., USA). Each measurement was carried out in triplicate and the results are expressed as mean ± SD, where SD represents the mean error. Cu is used as a criterion in the particle size distribution of soil to provide an index of gradation. It is known that the higher the value of Cu, the larger the range of particle sizes and uniformly graded soils have identical sizes of particles when Cu is between 1 and 3.22 In the present study Cu is used as a criterion to define the disparity in liposome particles where a value less than 4 is defined as a uniform distribution and above 4 as a broad distribution range. Cu is defined as the ratio of D60 to D10. The values of D60 and D10 were obtained from particle size data.
Morphology of the liposomes
Phase contrast microscopy. The liposomes were shaken before sampling to ensure that oil droplets were uniformly distributed. The liposome samples were diluted with triple distilled water in order to obtain better images. 3 to 4 μl of diluted liposome was placed on a glass slide with a micro syringe and then covered with a cover slip. The slide was then subjected to phase contrast microscopy (Olympus BX-5, Japan), fixed with a digital camera to capture images. All the liposome samples were observed under 100× magnification.
Scanning electron microscopy (SEM). Scanning electron microscopy (Model: LEO 435 VP; LEO Electron Microscopy Ltd., Cambridge, UK) was used to observe the topography and surface morphology of the liposomes. Samples were freeze dried first on SEM stubs and analyzed for liposome particle size and shape.
Liposome stability index (LSI). The emulsifying activity of the surfactant and the interaction of the lipid mixture under supercritical CO2 for tailoring the nano-liposome particles was assessed by determining the LSI using a turbidimetric method. The freshly made liposomes were diluted with triple distilled water just before taking the absorbance at 500 nm using a UV-visible spectrophotometer (UV-1800, Shimadzu, Japan) in 1 cm path length cuvettes. The liposomes were stored in an incubator for 24 h at a temperature of 37 °C, followed by the measuring of the absorbance at the same wavelength.23 The turbidity of the liposomes was calculated using the following equation, |
Turbidity (T) = ((A × 2.303)/λ)
| (1) |
The liposome stability index for 24 h was determined using the following relation:
where
T is the turbidity value at 0 h,
A is the absorbance at 500 nm,
λ is the path length of the cuvette (m), Δ
T is the change in turbidity over 24 h, and Δ
t is the time interval. The turbidimetric method was employed to evaluate the integrative effect of pressure, temperature and surfactant concentration on the liposome stability.
Rheological examination. The viscosities of the liposomes were determined using a controlled stress rheometer (Rheostress 6000, Haake, Karlsruhe, Germany) at 25 ± 0.1 °C with a coaxial cylinder attachment (spindle no. Z41), through applying the shear rate in a linear manner from 0.1 up to 100 s−1 with a span of 60 s. All measurements were in duplicate, and the apparent viscosities of the liposomes were calculated at a shear rate of 100 s−1.24
Energy calculations involved in liposome formation. The energy supplied [ES] to prepare liposomes using both the SC-GAS and Bangham's method was calculated from the measured current, voltage and process time duration of the individual units of the system, like the compressor, heater, etc. The theoretical energy density (Er) required for making the liposomes can be calculated from the following equation:25 |
 | (3) |
where Er is the theoretical energy density (MJ m−3), Φ is the lipid phase of the liposomes, γ is the surface tension (N m−1), and d is the diameter of the liposomes (m). The surface tension (γ) of the liposomes was measured using a tensiometer (Model K8, Kruss GMBH, Interfacial Tensiometer, Hamburg, Germany). The ring method was employed to measure the surface tension of the liposomes. A Pt–Ir-20 ring connected to a balance beam was immersed into a test liquid and afterwards slowly withdrawn. The samples were held in a thermostatic vessel of 10 ml. The presented values are an average of two measurements. The temperature was maintained at 25 ± 0.5 °C.
Storage stability study. The nano-liposomes prepared using both the SC-GAS and Bangham's methods were kept for observation for up to 3 months at different temperatures such as 4, 25 and 37 °C. The samples were checked for their stability at regular intervals by measuring the size, viscosity and Cu of the liposomes. Fresh samples were considered as a control.
Statistical analysis. The statistical analysis of the data was conducted using Microsoft® Excel 2010. Data were reported as mean ± standard deviation (SD). Analysis of variance (ANOVA) was conducted and significant differences between means were obtained using Tukey's multiple comparison test at a significance level of p < 0.05.
Results and discussion
Plausible phenomena of liposome formation using the SC-GAS method
The phenomena involved in liposome formation using the SC-GAS technique are illustrated in Fig. 2B. Under ambient conditions, the lipid molecules are present in a disordered state and above the lipid transition temperature (41.4–58 °C),26 dispersion in water causes ordering and the self-assembling of lipids, which will lead to liposome formation. The basic principle of the GAS method involves the saturation of lipid components with SCCO2, reducing the solubility in organic solvents, thus causing precipitation. During the first step of liposome formation (optimized for 15 min) there exists a CO2/solvent/phospholipid ternary system due to the combined effects of the liposome mixture temperature and pressurized CO2 that weakens the solvent solubility. Lipid drying to form a uniform layer can be assisted by depressurizing the SCCO2, leading to a total removal of remnant solvent, ensuring the attainment of only a SC homogenous phase (CO2/phospholipid system) which is very important for such applications.27 Lipid saturation with SCCO2 facilitates bondage between CO2 and the hydrophobic fatty acyl chains of the phospholipids, due to which the rapid diffusion of CO2 takes place, attaining an expanded lipid bilayer. The extent of CO2 diffusion and the thickness of the lipid bilayer depends on the level of operating pressure (50–200 bar). Hydration under pressure and equilibration for 1 h yields LUV and the bimodal particle size distribution can be seen in Fig. 3A. The addition of PBS/Tween 80 solution to the CO2/phospholipid system under pressure and equilibration for 1 h facilitates the partial solubilization of CO2 in the aqueous phase to form carbonic acid, establishing a CO2/aqueous/Tween 80/phospholipid quaternary system. The depressurization of the SC liposome suspension to ambient pressure to reduce the particle size to the nano-scale is an essential step in the GAS technique. Upon depressurization, the diffused CO2 molecules are released from the lipid bilayer due to loss of solvating power upon the pressure drop, causing the break-up of the curvature into discrete phospholipids. The extent of this lipid bilayer destabilization depends on the initial pressure built up in the pressure vessel, and the disordered state of the phospholipids was brought to the ordered curvature state of liposomes by maintaining a temperature near the lipid transition temperature at the sample collection end. Due to both the lipid transition temperature and hydrophobic interactions, the separated phospholipid molecules aggregate spontaneously into a spherical bilayer to form liposomes. The rate of depressurization is also a critical parameter that decides the number of nano-sized liposomes formed. A fast depressurization rate causes a drastic drop in CO2 pressure, causing the icing of the liposome suspension, and so lesser liposome formation was observed, which suggested a slow depressurization rate offers better control over the particle mean size and size distribution. Similar observations were made by other authors.28,29 The importance of the depressurization of the SC liposome suspension near the lipid transition temperature is discussed later.
 |
| Fig. 3 (A) Particle size distribution of liposome samples collected after complete CO2 depressurization; (B) microscopic image of liposomes collected at ambient temperature and pressure. | |
Effect of pressure
The effect of pressure on the mean diameter and Cu of liposomes prepared using the SC-GAS technique is shown in Fig. 4A. The pressure was varied between 50 and 200 bar and it was found that increasing the pressure has a significant (p < 0.05) positive effect on the particle size and Cu. The extent of free and diffused CO2 in the phospholipid bi-layer is the determining parameter for the particle size of the liposomes. Fig. 4A clearly indicates that lower pressure <80 bar is not enough to reduce the particle size to the nano-level (<100 nm) due to ineffective diffusion of CO2 in the lipid bi-layer. Liposome formation at pressures between 50 and 80 bar cannot ensure spherical particles due to unequal diffusion of CO2 throughout the lipid layer and is ineffective for the complete unpacking of the bi-layer structure to form discrete lipid molecules. Low pressure treatment yielded liposomes having a broad range of particle size distribution (Fig. 5A). As the pressure was increased from 120 to 200 bar there was significant particle size reduction and this pressure range is effective for producing particles with superior characteristics, possessing spherical shape, and a narrow range of particle size distribution (Fig. 5B). Lisha Zhao and co-workers reported an operating pressure range to obtain spherical shape submicron liposomes.19,20 A higher pressure range facilitated a CO2/aqueous/Tween80/phospholipid quaternary system, which was more favorable for the uniform dispersion of phospholipid molecules to unite together after depressurization to form nano-sized liposomes. Increasing the pressure from 50 to 200 bar drastically alters the liposome size from 0.929 ± 0.003 to 0.098 ± 0.004 μm, with a narrow range of particle size distribution.
 |
| Fig. 4 Effects of process parameters on liposome mean diameters and coefficients of uniformity (COU), (A) pressure (50–200 bar); (B) Tween 80 concentration (0–4%); and (C) temperature (40–65 °C). | |
 |
| Fig. 5 Particle size distributions of liposomes: at pressures of (A) 50 bar and (B) 200 bar; at (C) 0% Tween 80 and (D) 4% Tween 80; at a temperature of (E) 40 °C and (F) 65 °C; (G) under optimized conditions of 170 bar, 50 °C and 1.5% Tween 80; and (H) using Bangham's method. | |
The current configuration of the nano-liposome production setup was proved to engineer unimodal nano-liposomes over the tested pressure range (50–200 bar) provided the pressure inside the pressure vessel was necessarily kept constant during depressurization. Throughout depressurization, CO2 was released uniformly from every portion of the liquid phase, making each particle influenced by dense CO2, leading to a low Cu. Increasing pressure reasonably improved the uniformity of the liposomes, wherein Cu, from 8.28 ± 0.023, was brought down to 1.10 ± 0.012 over the tested pressure range. Further, the experiments were carried out at pressures between 160 and 200 bar to select the best effective pressure for nano-liposome production. Liposome production at a pressure of 170 bar yielded liposomes with a mean particle size of 0.094 ± 0.003 μm and a Cu of 1.11 ± 0.011.
Effect of surfactant concentration
The presence of the surfactant (Tween 80) plays an important role in the CO2/aqueous/Tween 80/phospholipid quaternary system, wherein the concentration of Tween 80 majorly governs the extent of lipid dispersion into the aqueous phase which helps liposome recovery during the depressurization step. The concentration of Tween 80 was varied between 0 and 4% to evaluate its effect on the mean particle size and Cu of liposomes (Fig. 4B). Even though in the absence of surfactant one can obtain liposomes, the particle mean diameter is larger (0.350 ± 0.005 μm) with broad particle size distribution (Fig. 5C). This is due to the fact that after depressurization, when lipid molecules assemble to form liposomes, there exists no repulsive force around the liposomes to stop coalescence and aggregation. As mentioned earlier, in the absence of surfactant there was an incomplete dispersion of lipids in the aqueous phase, affecting the CO2/aqueous/surfactant/lipid quaternary homogenous phase, and about 50% (by wt) of liposome material still remained in the pressure vessel. Experiments were carried out with small amounts of Tween 80 (0.5%) to produce liposomes, where the particle size was reduced to 0.110 ± 0.003 μm, with a Cu of 3.25 ± 0.025. Increasing the concentration of Tween 80 from 0.5 to 2% showed positive effects on particle size reduction and Cu, during which the smallest particle size of 0.063 ± 0.002 μm (Fig. 5G) and an improved Cu of 1.10 ± 0.015 were obtained at 1.5%. Liposome production using a Tween 80 concentration in the range of 0.5 to 2% resulted in 85 to 90% (data not shown) liposome yield and the rest remained in the vessel due to foam formation, which was unavoidable. A further increase of surfactant from 2 to 4% showed a slight increase in the mean diameter (Fig. 4B) and Cu. This may be due to continued foam formation causing negative effects.30
Effect of temperature
Variations in temperature, at a constant pressure (170 bar), Tween 80 concentration (2%) and aqueous amount (30 ml), around the phase transition temperature (40–65 °C) entail changes in the melting transitions of lecithin, which is due to van der Waals interactions between adjacent lipid molecules. In the absence of CO2, at lower temperatures lecithin exists in a lamellar gel phase, whereas at higher temperatures it changes to a fluid liquid-crystalline phase. In the presence of dense CO2 and cholesterol, the gel-fluid phase transition temperature is reduced and the fluid liquid-crystalline phase region is broadened.31 In a high pressure system, whatever the temperature, the fluid liquid-crystalline phase is favoured, which is required in SC mediated liposome production and enables liposomal encapsulation even at mild temperatures.32 In the present study, the effect of temperature at constant pressure and surfactant content was evaluated on the particle size and Cu of the liposomes (Fig. 4C). Temperature a has significant effect (p < 0.05) on the CO2/aqueous/Tween 80/lipid quaternary system, as an increase in temperature from 40–50 °C resulted in the diameter of the liposomes reducing from 0.209 ± 0.005 to 0.094 ± 0.002 μm (Fig. 5E). This is due to the increased density of CO2 under the interactive effects of pressure (170 bar) and temperature (45 and 50 °C), which were the most favourable conditions for increased CO2 solubility in the aqueous phase and the formation of small particles. But at higher temperatures (55–65 °C) the particle size was increased to 0.118 ± 0.004 μm (Fig. 5F). This is due to the fact that an elevated temperature decreases the cohesive energy density of CO2, lowering its solubility in the aqueous phase and also causing the partitioning of surfactant towards the aqueous phase, creating a slightly upper CO2-lecithin phase and a lower surfactant-aqueous phase.33 During depressurization, the aggregation of liposomes happens due to an unequal availability of surfactant to the dispersed liposomes. Cu decreased from 2.30 ± 0.012 to 1.21 ± 0.021 with a temperature increase from 40 to 50 °C and later increased with temperature to 2.29 ± 0.018 (Fig. 4C) due to phase separation causing a non-uniform distribution of surfactant molecules around the liposomes. Hence, an optimal temperature of 50 °C is recommended for the production of nano-sized liposomes with better size uniformity.
Importance of depressurization and depressurization at the phase inversion temperature
The importance of the depressurization step lies in the conversion of LUV to SUV by creating a pressure drop through the micrometric high pressure tubing. Before depressurization, the liposomes are of a large multimodal size distribution with a Cu of 2.61 ± 0.021 (Fig. 3A). During depressurization, each particle is equally influenced by the pressure drop, and to do so the pressure inside the pressure vessel should necessarily be kept constant. A slower depressurization rate (25 bar min−1) is more favourable for the production of not only small particles but also the greatest number of liposomes. A fast depressurization rate offers poor control over the particle size and causes the formation of a lesser number of liposomes, which is discussed later.
The presence of dense CO2 in the CO2/water/surfactant/lipid quaternary system facilitates the phase transition of lecithin at mild temperatures. During the depressurization step, CO2 is released, causing cooling of the liquid phase, creating a sudden shock which is un-favourable for self-assembling of lipid molecules to form liposomes. The phase transition temperature increases and phospholipids undergo a phase transition from a fluid liquid-crystalline phase to a lamellar gel phase. Fig. 3B shows that the depressurization of the SC liquid phase at ambient temperatures causes the formation of fewer liposomes and most of the lipid molecules remained discrete. So it is preferred that depressurization at ambient pressure occurs at certain temperatures above the lipid phase transition to obtain a smaller size, better uniformity and greater number of liposomes. Fast depressurization creates a large pressure drop due to which the SC liquid temperature drops drastically, which is unfavourable for the formation of liposomes of a desirable size. A slow depressurization rate not only offers better control over particle size but also provides enough resident time in the sample collection chamber to pick a temperature above the phase transition wherein the combined effects of hydrophobic interaction and heat yield a reasonably good number of liposomes.
Characterization of the nano-liposomes
Morphology of the liposomes. Liposomes prepared using the Bangham and SC-GAS methods were observed under a phase contrast microscope to characterize the morphology and shape of the liposomes. All samples were observed under 100× magnification to confirm the occurrence of nano-sized and spherical liposomes as indicated from the data provided using the particle size analyzer. From Fig. 6A–E it can be seen that increasing the pressure at a constant temperature, Tween 80 concentration and depressurization rate (25 bar min−1) has a positive effect on particle size reduction and the spherical shape of the liposomes. Fig. 6F–K also suggests that increasing the concentration of Tween 80 from 0–4% improved the particle dispersion in the aqueous phase, establishing a stabilized liposome system inhibiting particle growth. Fig. 6M shows that the hydration of lipids under pressure produces large unilamellar vesicles (LUV). The occurrence of large multilamellar liposomes with irregular shape from using Bangham's method is evident in Fig. 6N.
 |
| Fig. 6 Microscopic images (100× magnification) of liposomes prepared using different formulation variables: (A–E) under pressures ranging from 50–200 bar, at 50 °C, with 1% Tween 80; (F–K) at a Tween 80 concentration ranging from 0–4%, under 170 bar, at 50 °C; (L) at 170 bar, 50 °C, and 1.5% Tween 80; (M) at 170 bar, 50 °C, and 1.5% Tween 80 without depressurization; and (N) using Bangham's method. | |
The occurrence of very much smaller sized liposomes (<100 nm) from using the SC-GAS method than from the conventional method is evident in the SEM pictures of the liposomes, and their occurrence was abundant. Smaller sized liposomes are delivered more efficiently to an infected site as compared with larger sized liposomes. The SEM images in Fig. 7A and B confirm the occurrence of particles, supporting the micrographs from the phase contrast microscope. By observing the results of liposome size (Fig. 5G) and the SEM images (Fig. 7B), the proposed configuration of SC-GAS liposome production at 170 bar, 50 °C, 1.5% Tween 80 and a depressurization rate of 25 bar min−1 can undoubtedly be employed to produce mono-dispersed nano-liposomes with reproducible features (Fig. 8).
 |
| Fig. 7 Scanning electron microscope images of liposomes prepared using (A) the SCCO2-GAS method at 170 bar, 50 °C and 1.5% Tween 80; and (B) Bangham's method. | |
 |
| Fig. 8 Liposome samples prepared using the SC-GAS method: (A) at 50 bar, 50 °C, and 1% Tween 80; (B) at 160 bar, 50 °C, and 1% Tween 80; (C) at 200 bar, 50 °C, and 1% Tween 80; (D) sample collected after depressurization (170 bar, 50 °C, 1% Tween 80); and (E) using Bangham's method. | |
Comparison with Bangham's method. The physical properties of liposomes in terms of mean particle size, distribution and Cu, prepared using the SC-GAS and thin-film methods, were compared. The results of particle size distribution analysis for liposomes prepared using the thin film method are shown in Fig. 5H. Liposome vesicles prepared using the conventional method had a relatively broad size distribution ranging between 0.55 and 12.05 μm with a mean diameter of 4.64 μm and, moreover, the vesicles exhibited an irregular thickness of bilayer (Fig. 6N), which may reduce the membrane stability and lead to considerable leakage. The Cu was 12.07 ± 0.024, which implies that the conventionally prepared liposomes were characterized to be highly poly-dispersed. Another disadvantage of the conventional method is its poor reproducible features.21 The particle sizes of liposomes formed using the SC-GAS method were markedly lower than those produced with thin-film dispersion, with higher heterogeneity. The SC-GAS assisted liposome production yielded nano-liposomes with a mean particle diameter of 0.063 ± 0.002 μm and a Cu of 1.10 ± 0.012, making them much more efficient for drug delivery (Fig. 6L).
Liposome stability index (LSI). The liposome stability index is a quick method for the estimation of the stability of liposomes. The process temperature, pressure and surfactant had a simultaneous effect on the LSI. The liposomes were kept under stressed temperature conditions (37 ± 1 °C) to trigger the process of aggregation. Lesser values of the stability index value are a sign of less stability for liposomal formulation. As the pressure increases from 50 to 200 bar, the LSI is found to increase between 195 and 468 (Fig. S2†), indicating a pressure between 170 and 200 bar is a favourable range to produce stabilized narrow size distributed nano-liposomes. When the temperature increases, the LSI increases (237–544) up to 50 °C but there was no significant difference when the temperature increased from 50 to 65 °C (Fig. S2†). The emulsifying properties of the liposome system were improved when the Tween 80 concentration increased from 0 to 4%, thus improving the LSI (132–680).
Viscosity of the liposomes. The viscosity of the liposomes plays an important role during long term storage and also is very important for stability and efficient drug release. Higher viscosity liposomes are an indication of a smaller size and narrow particle distribution. Higher viscosity nano-liposomes exhibit slower release of active ingredients and have a lower clearance rate after administration. It was observed that all the liposome formulations followed near Newtonian behaviour (R2 = 0.946) as shown in Fig. S1.† The flow behaviour of the liposomes was like milk which is a good example of a stable O/W emulsion where lipid droplets are stabilized with milk protein.24,34 Table 1 lists the rheological properties of liposomes prepared under different formulation conditions. With a significant effect on particle size reduction using the SC-GAS method, the apparent viscosity of the liposome suspension was found to increase with increasing the pressure from 50 to 160 bar, and it stabilized between 160 and 200 bar. As the temperature increased the viscosity was found to increase and later stabilize. An increase in the Tween 80 concentration from 0 to 4% increases the apparent viscosity of the liposomes from 1.36 to 2.02 mPa. At higher Tween 80 concentrations, a greater amount of hydrophilic tails were available to entrap the water molecule in the formulation which may lead to an increase in the apparent viscosity.35
Table 1 Effect of formulation conditions on the viscosity of liposomes prepared using the SC-GAS method
Pressure (bar) |
Viscosity (mPa) |
Temperature (°C) |
Viscosity (mPa) |
Surfactant, % |
Viscosity (mPa) |
50 |
1.42 ± 0.02 |
40 |
1.53 ± 0.03 |
0 |
1.36 ± 0.01 |
80 |
1.49 ± 0.01 |
45 |
1.63 ± 0.01 |
0.5 |
1.50 ± 0.01 |
120 |
1.56 ± 0.05 |
50 |
1.86 ± 0.01 |
1 |
1.80 ± 0.03 |
160 |
1.72 ± 0.02 |
55 |
1.72 ± 0.01 |
1.5 |
1.84 ± 0.01 |
170 |
1.83 ± 0.02 |
65 |
1.84 ± 0.04 |
2 |
1.86 ± 0.01 |
200 |
1.82 ± 0.01 |
|
|
3 |
1.90 ± 0.02 |
|
|
|
|
4 |
2.02 ± 0.01 |
Energy involved in liposome formation. In comparison with Bangham's method, supercritical based liposome production requires 1.52 times less energy. Most of the energy supplied to the rotary evaporator (Bangham's method) is dissipated into heat energy and very little energy contributes towards liposome formation. For example, for liposomes containing 21.82% SL (Φ = 0.21) prepared using Bangham's method at a temperature of 60 ± 1 °C for a time of 3 h, the droplet size achieved was 4.64 μm. The surface tension (γ) of such liposomes was 0.0285 Nm−1.25,36 Then using eqn (3), the theoretical energy density (Er) required for making liposomes having a droplet diameter of 4.64 μm was calculated to be 0.008 MJ m−3. Similar calculations were done for liposomes prepared using the SC-GAS method, using eqn (3), where the values of Φ, γ and d are 0.21, 0.0366 N m−1, and 0.063 μm, respectively. In the SC-GAS method, an Er of 0.732 MJ m−3 was required to form a SUV liposome, concluding that the SC process utilizes 94.5 times more instrument supplied energy than compared to the conventional process.Table 2 strongly supports the superior method of nano-liposome production using the SC-GAS method in fed-batch mode as compared to other variants of SC techniques and high pressure based competitive methods. The present configuration of SC-GAS set up facilitates nano-liposomes with a mean size of 63 nm which is 40% less than other SC methods and 70–90% less than in high pressure homogenization and micro fluidizer based techniques. The major advantage of the present method is that particle formation happens twice, i.e., during hydration under pressure and the depressurization step, and undoubtedly these phenomena offer better encapsulation efficiency. As per the author's knowledge, this is the first study to report the production of stabilized superior liposomes of less than 100 nm with a narrow range of size distribution using a SC-GAS method.
Table 2 Comparison of the supercritical mediated liposome method with other advanced techniquesa
Liposome preparation method |
Reference |
P, bar/T, °C |
PS, nm |
P – pressure; T – temperature; PS – particle size; SAILA – Supercritical Assisted Injection into Liquid Antisolvent; RESS – Rapid Expansion of Supercritical Solution. |
Supercritical methods |
SC-GAS |
Present study |
170/50 |
63 |
Supercritical |
19 and 20 |
300/50 |
214, 523 |
SAILA |
30 |
100/60 |
150 |
SC-CO2 |
21 |
300/50 |
146 |
SAS |
37 |
100/35 |
150, 350 |
RESS |
38 |
300/50 |
20–40 |
RESS |
39 |
300/65 |
94 |
RESS |
40 |
250/60 |
200 |
SCF-CO2 |
41 |
100/45 |
1137 |
SAS |
42 |
100/60 |
1012 |
![[thin space (1/6-em)]](https://www.rsc.org/images/entities/char_2009.gif) |
High pressure homogenization methods |
— |
43 |
1500 |
102 |
— |
44 |
690 |
140 |
![[thin space (1/6-em)]](https://www.rsc.org/images/entities/char_2009.gif) |
Microfluidizer methods |
— |
45 |
730 |
100 |
— |
46 |
1200/25 |
66.8 |
— |
47 |
580 |
100 |
Storage stability study. The effect of time on the particle size, Cu and viscosity of the liposomes prepared using both SC-GAS and Bangham's methods was assessed at different time intervals on liposomes stored at 4, 25 and 37 °C (Table 3). The particle size analysis and microscopic observations proved that liposomes prepared using SC-GAS methods showed superior characteristics, with a narrow size distribution. The nano-liposomes stored at 4 and 25 °C were highly stable for up to 3 months (Table 3) with no significant changes (p > 0.05) in the mean size, Cu and viscosity, whereas liposomes stored at 37 °C were stable for 2 months and showed a significant increase (p < 0.05) in mean size, Cu and viscosity due to aggregation. This is due to the fact that uniformly distributed nano-liposomes possess uniform charge density around the surface, attaining a thermodynamically stabilized state. But liposomes prepared using Bangham's method showed large variations in the mean size, due to which fast aggregation became favourable. Liposomes (from Bangham's method) stored at 4 and 25 °C were stable only for 5 weeks whereas those at 37 °C were stable for up to 4 weeks and later saw significant changes in the mean size, Cu and viscosity. Fast aggregation is due to an unequal distribution of charge density, i.e., large particles possess a larger charge density compared to smaller particles, due to which larger particles have a tendency to show dominance over smaller particles because of the large potential difference, causing aggregation.
Table 3 Effect of storage temperature on the particle size, coefficient of uniformity and viscosity of liposomes
Time (weeks) |
Mean particle size (μm) |
Coefficient of uniformity (Cu) |
Viscosity (mPa) |
4 °C |
25 °C |
37 °C |
4 °C |
25 °C |
37 °C |
4 °C |
25 °C |
37 °C |
SC-GAS method |
0 |
0.063 ± 0.002 |
|
|
1.201 ± 0.012 |
|
|
1.831 ± 0.01 |
|
|
1 |
0.065 ± 0.001 |
0.064 ± 0.001 |
0.065 ± 0.003 |
1.195 ± 0.091 |
1.211 ± 0.014 |
1.197 ± 0.012 |
1.829 ± 0.02 |
1.833 ± 0.02 |
1.834 ± 0.01 |
2 |
0.064 ± 0.001 |
0.066 ± 0.003 |
0.067 ± 0.002 |
1.212 ± 0.012 |
1.220 ± 0.020 |
1.224 ± 0.018 |
1.842 ± 0.01 |
1.830 ± 0.01 |
1.829 ± 0.02 |
3 |
0.066 ± 0.001 |
0.065 ± 0.001 |
0.067 ± 0.001 |
1.211 ± 0.011 |
1.219 ± 0.019 |
1.231 ± 0.017 |
1.831 ± 0.02 |
1.831 ± 0.02 |
1.827 ± 0.02 |
4 |
0.066 ± 0.003 |
0.067 ± 0.001 |
0.069 ± 0.002 |
1.212 ± 0.113 |
1.225 ± 0.020 |
1.230 ± 0.013 |
1.839 ± 0.01 |
1.829 ± 0.03 |
1.828 ± 0.03 |
5 |
0.069 ± 0.002 |
0.071 ± 0.002 |
0.074 ± 0.001 |
1.217 ± 0.015 |
1.230 ± 0.009 |
1.240 ± 0.023 |
1.828 ± 0.03 |
1.824 ± 0.01 |
1.816 ± 0.02 |
6 |
0.068 ± 0.001 |
0.071 ± 0.003 |
0.075 ± 0.004 |
1.220 ± 0.012 |
1.231 ± 0.010 |
1.239 ± 0.019 |
1.830 ± 0.01 |
1.823 ± 0.04 |
1.817 ± 0.01 |
7 |
0.069 ± 0.003 |
0.072 ± 0.001 |
0.080 ± 0.001 |
1.239 ± 0.011 |
1.235 ± 0.014 |
1.450 ± 0.012 |
1.829 ± 0.00 |
1.824 ± 0.01 |
1.802 ± 0.02 |
8 |
0.07 0 ± 0.001 |
0.071 ± 0.005 |
0.080 ± 0.003 |
1.302 ± 0.019 |
1.230 ± 0.028 |
1.449 ± 0.011 |
1.821 ± 0.02 |
1.822 ± 0.02 |
1.803 ± 0.01 |
12 |
0.070 ± 0.002 |
0.070 ± 0.004 |
0.080 ± 0.002 |
1.316 ± 0.020 |
1.235 ± 0.026 |
1.450 ± 0.011 |
1.823 ± 0.02 |
1.820 ± 0.00 |
1.805 ± 0.02 |
![[thin space (1/6-em)]](https://www.rsc.org/images/entities/char_2009.gif) |
Bangham's method |
0 |
5.67 ± 0.005 |
|
|
12.97 ± 0.021 |
|
|
1.278 ± 0.01 |
|
|
1 |
5.71 ± 0.001 |
5.73 ± 0.009 |
5.71 ± 0.010 |
12.931 ± 0.019 |
13.001 ± 0.004 |
12.959 ± 0.019 |
1.279 ± 0.02 |
1.278 ± 0.01 |
1.275 ± 0.02 |
2 |
5.72 ± 0.002 |
5.73 ± 0.010 |
5.72 ± 0.006 |
12.993 ± 0.021 |
12.994 ± 0.010 |
13.001 ± 0.012 |
1.278 ± 0.02 |
1.279 ± 0.02 |
1.279 ± 0.01 |
3 |
5.76 ± 0.001 |
5.77 ± 0.015 |
5.82 ± 0.003 |
13.110 ± 0.019 |
13.010 ± 0.012 |
13.563 ± 0.002 |
1.276 ± 0.01 |
1.269 ± 0.01 |
1.263 ± 0.02 |
4 |
5.77 ± 0.001 |
5.78 ± 0.004 |
6.19 ± 0.008 |
13.098 ± 0.012 |
13.011 ± 0.020 |
13.909 ± 0.012 |
1.277 ± 0.03 |
1.268 ± 0.03 |
1.254 ± 0.05 |
5 |
5.81 ± 0.003 |
6.31 ± 0.007 |
6.78 ± 0.001 |
13.767 ± 0.016 |
13.980 ± 0.019 |
14.032 ± 0.021 |
1.269 ± 0.02 |
1.241 ± 0.01 |
1.239 ± 0.03 |
6 |
5.81 ± 0.004 |
6.45 ± 0.007 |
6.70 ± 0.004 |
13.709 ± 0.019 |
14.014 ± 0.012 |
14.201 ± 0.019 |
1.270 ± 0.01 |
1.230 ± 0.02 |
1.240 ± 0.02 |
7 |
5.85 ± 0.005 |
6.90 ± 0.010 |
7.11 ± 0.007 |
13.891 ± 0.020 |
14.231 ± 0.013 |
14.199 ± 0.014 |
1.265 ± 0.02 |
1.214 ± 0.04 |
1.250 ± 0.01 |
8 |
6.16 ± 0.004 |
7.13 ± 0.010 |
7.15 ± 0.002 |
14.026 ± 0.014 |
14.959 ± 0.021 |
14.892 ± 0.019 |
1.253 ± 0.04 |
1.203 ± 0.01 |
1.249 ± 0.04 |
12 |
6.22 ± 0.009 |
7.47 ± 0.008 |
8.20 ± 0.003 |
14.11 2 ± 0.010 |
15.213 ± 0.009 |
15.455 ± 0.030 |
1.240 ± 0.02 |
1.119 ± 0.00 |
1.056 ± 0.04 |
Conclusions
The SC-GAS method provides a better way to prepare liposomes with a characteristic nano-size of 63 nm and with better morphology (i.e., uniform size and shape), and a narrowly dispersed size distribution. The presented configuration for a SC-GAS mediated liposome production unit can be operated in fed-batch mode with the additional feature of ensured reproducibility compared to conventional methods. The proposed SC-GAS method can undoubtedly be used to prepare nano-liposomes exhibiting a good LSI and rheological properties which majorly contributes to evolving successful liposome based drug delivery systems. Moreover, dense CO2 enables liposome production in a closed, inert and hygienic manner, which can be easily made compliant with GMP. Supercritical technology shows advantages over conventional preparation methods and offers great potential in the encapsulation of valuable compounds relevant to nutraceutical, functional food and pharmaceutical applications.
Acknowledgements
The author (SMG) acknowledges the encouragement from the Director of the Central Food Technological Research Institute (CFTRI, Mysore, India).
References
- M. D. Saldafia, F. M. Gamarra and R. M. Siloto, Emerging Technologies Used for the Extraction of Phytochemicals from Fruits, Vegetables, and Other Natural Sources, Fruit and Vegetable Phytochemicals: Chemistry, Nutritional Value, and Stability, ed. L. A. de la Rosa, E. Alvarez-Parrilla and G. A. González-Aguilar, Wiley-Blackwell, UK, 2009, p. 235 Search PubMed.
- G. Gregoriadis, N. Engl. J. Med., 1976, 295, 704–710 CrossRef CAS PubMed.
- S.-L. Huang, Adv. Drug Delivery Rev., 2008, 60, 1167–1176 CrossRef CAS PubMed.
- R. Wang, C. Liu and W. Liu, Acad. Per. Farm. Prod. Proc., 2007, 8, 12–14 Search PubMed.
- P. Gokhale, R. Kotwani, S. Dange, N. Kshirsagar and S. Pandya, Indian J. Med. Res., 1993, 98, 75–78 CAS.
- R. T. Proffitt, J. Adler-Moore and S.-M. Chiang, US Pat., 5 965 156, 1999.
- Q. Ye and M. B. Sankaram, US Pat., 6 193 998, 2001.
- Y. P. Patil and S. Jadhav, Chem. Phys. Lipids, 2014, 177, 8–18 CrossRef CAS PubMed.
- E. Kastner, R. Kaur, D. Lowry, B. Moghaddam, A. Wilkinson and Y. Perrie, Int. J. Pharm., 2014, 477, 361–368 CrossRef CAS PubMed.
- A. Laouini, C. Jaafar-Maalej, S. Gandoura-Sfar, C. Charcosset and H. Fessi, UK Colloids 2011, Springer, Berlin Heidelberg, Germany, 2012 Search PubMed.
- M. Hirsch, V. Ziroli, M. Helm and U. Massing, J. Controlled Release, 2009, 135, 80–88 CrossRef CAS PubMed.
- K. Otake, M. Abe, H. Sakai, I. Tomohir, K. Chihiro and S. Msatoshi, US Pat., 20 040 099 976, 2004.
- K. Otake, T. Shimomura, T. Goto, T. Imura, T. Furuya, S. Yoda, Y. Takebayashi, H. Sakai and M. Abe, Langmuir, 2006, 22, 4054–4059 CrossRef CAS PubMed.
- K. Otake, T. Imura, H. Sakai and M. Abe, Langmuir, 2001, 17, 3898–3901 CrossRef CAS.
- K. Otake, T. Shimomura, T. Goto, T. Imura, T. Furuya, S. Yoda, Y. Takebayashi, H. Sakai and M. Abe, Langmuir, 2006, 22, 2543–2550 CrossRef CAS PubMed.
- A. S. Zarena and K. U. Sankar, Ther. Delivery, 2011, 2, 259–277 CrossRef CAS.
- U. S. Kadimi, D. R. Balasubramanian, U. R. Ganni, M. Balaraman and V. Govindarajulu, Nanomedicine: Nanotechnology, Biology and Medicine, 2007, 3, 273–280 CrossRef CAS PubMed.
- S. M. Ghatnur, R. S. Sonale, M. Balaraman and U. S. Kadimi, J. Liposome Res., 2012, 22, 215–223 CrossRef CAS PubMed.
- L. Zhao and F. Temelli, J. Supercrit. Fluids, 2015, 100, 110–120 CrossRef CAS.
- L. Zhao and F. Temelli, J. Food Eng., 2015, 158, 104–112 CrossRef CAS.
- L. Zhao, F. Temelli, J. M. Curtis and L. Chen, Food Res. Int., 2015, 77, 63–72 CrossRef CAS.
- R. F. Craig, Craig's soil mechanics, CRC Press, London, 2004 Search PubMed.
- K. N. Pearce and J. E. Kinsella, J. Agric. Food Chem., 1978, 26, 716–723 CrossRef CAS.
- P. V. Gadkari and M. Balaraman, J. Food Eng., 2015, 147, 14–23 CrossRef CAS.
- S. M. Jafari, Y. He and B. Bhandari, J. Food Eng., 2007, 82, 478–488 CrossRef.
- M. Müller and C. Müller-Goymann, Arch. Pharm. Pharm. Med. Chem., 2001, 334, 79 CrossRef.
- K. Byrappa, S. Ohara and T. Adschiri, Adv. Drug Delivery Rev., 2008, 60, 299–327 CrossRef CAS PubMed.
- T. P. Castor and L. Chu, US Pat., 5 776 486, 1998.
- T. Castor, WO Pat., 9 427 581, 1994.
- R. Campardelli and E. Reverchon, J. Food Eng., 2015, 149, 131–136 CrossRef CAS.
- G. D. Bothun, B. L. Knutson, H. J. Strobel and S. E. Nokes, Langmuir, 2005, 21, 530–536 CrossRef CAS PubMed.
- L. Lesoin, O. Boutin, C. Crampon and E. Badens, Colloids Surf., A, 2011, 377, 1–14 CrossRef CAS.
- C. T. Lee, P. A. Psathas, K. P. Johnston, J. deGrazia and T. W. Randolph, Langmuir, 1999, 15, 6781–6791 CrossRef CAS.
- A. Zarena, S. Bhattacharya and U. S. Kadimi, Food Bioprocess Technol., 2012, 5, 3007–3013 CrossRef.
- J. Rao and D. J. McClements, J. Agric. Food Chem., 2011, 59, 5026–5035 CrossRef CAS PubMed.
- S. M. Jafari, Y. He and B. Bhandari, Eur. Food Res. Technol., 2007, 225, 733–741 CrossRef CAS.
- M. T. Fernández-Ponce, Y. Masmoudi, R. Djerafi, L. Casas, C. Mantell, E. M. de la Ossa and E. Badens, J. Supercrit. Fluids, 2015, 105, 119–127 CrossRef.
- S. Xu, B. Zhao and D. He, Mater. Lett., 2015, 142, 283–286 CrossRef CAS.
- Z. Wen, X. You, L. Jiang, B. Liu, Z. Zheng, Y. Pu and B. Cheng, Flavour Fragrance J., 2011, 26, 27–33 CrossRef CAS.
- L. Frederiksen, K. Anton, P. v. Hoogevest, H. R. Keller and H. Leuenberger, J. Pharm. Sci., 1997, 86, 921–928 CrossRef CAS PubMed.
- P. R. Karn, W. Cho, H.-J. Park, J.-S. Park and S.-J. Hwang, Int. J. Nanomed., 2013, 8, 365 Search PubMed.
- P. R. Karn, S.-E. Jin, B. J. Lee, B. K. Sun, M.-S. Kim, J.-H. Sung and S.-J. Hwang, Int. J. Nanomed., 2014, 9, 5079 Search PubMed.
- K. Peters, S. Leitzke, J. Diederichs, K. Borner, H. Hahn, R. Müller and S. Ehlers, J. Antimicrob. Chemother., 2000, 45, 77–83 CrossRef CAS PubMed.
- I. b. Gülseren and M. Corredig, J. Agric. Food Chem., 2013, 61, 3242–3251 CrossRef PubMed.
- A. Thompson and H. Singh, J. Dairy Sci., 2006, 89, 410–419 CrossRef CAS PubMed.
- L.-q. Zou, W. Liu, W.-l. Liu, R.-h. Liang, T. Li, C.-m. Liu, Y.-l. Cao, J. Niu and Z. Liu, J. Agric. Food Chem., 2014, 62, 934–941 CrossRef CAS PubMed.
- B. Farhang, Y. Kakuda and M. Corredig, Dairy Sci. Technol., 2012, 92, 353–366 CrossRef CAS.
Footnote |
† Electronic supplementary information (ESI) available. See DOI: 10.1039/c6ra09530e |
|
This journal is © The Royal Society of Chemistry 2016 |
Click here to see how this site uses Cookies. View our privacy policy here.