Synthesis of bifunctional reduced graphene oxide/CuS/Au composite nanosheets for in situ monitoring of a peroxidase-like catalytic reaction by surface-enhanced Raman spectroscopy

Wei Songab, Guangdi Niec, Wei Jib, Yanzhou Jiangc, Xiaofeng Lubc, Bing Zhao*a and Yukihiro Ozaki*b
aState Key Laboratory of Supramolecular Structure and Materials, Jilin University, Changchun 130012, P. R. China. E-mail: zhaob@jlu.edu.cn
bSchool of Science and Technology, Kwansei Gakuin University, 2-1 Gakuen, Sanda, Hyogo 660-1337, Japan. E-mail: ozaki@kwansei.ac.jp
cAlan G. MacDiarmid Institute, College of Chemistry, Jilin University, Changchun, 130012, P. R. China

Received 12th April 2016 , Accepted 27th May 2016

First published on 27th May 2016


Abstract

Reduced graphene oxide (rGO)/CuS/Au composite nanosheets were prepared herein via a two-step approach based on a simple hydrothermal reaction combined with an in situ reduction process. The rGO/CuS/Au composite nanosheets exhibited good peroxidase-like catalytic activity toward the oxidation of a peroxidase substrate 3,3′,5,5′-tetramethylbenzidine (TMB) in the presence of H2O2. The rGO/CuS/Au composite nanosheets were also utilized as a new surface-enhanced Raman scattering (SERS) substrate, enabling monitoring of the peroxidase-like catalytic reaction on their active surface. The oxidized intermediate of TMB formed during the peroxidase-like reaction was captured and clearly identified by SERS spectroscopy, providing an avenue for quantitative in situ monitoring of the oxidation of TMB. This approach could also be used to directly detect H2O2 with a detection limit of about 2.1 μM.

Introduction

Heterogeneous catalysts currently play an important role in the chemical industries due to their high catalytic activity and facile separation from a reaction system.1–4 To better understand the mechanism and kinetics of heterogeneous catalytic reactions, an in situ study of the heterogeneous reaction on the surface of catalysts is crucial. Over the past few decades, a series of spectroscopic techniques including UV-vis absorption spectroscopy, infrared spectroscopy, normal Raman spectroscopy and surface-enhanced Raman scattering (SERS) spectroscopy have been employed to investigate the catalytic mechanism of many heterogeneous catalytic reactions.5–10 Among these techniques, SERS demonstrates high sensitivity and selectivity because the enhancement factor of SERS can reach 1 × 10¹⁴, enabling detection even at the single molecule level, and can provide positive identification of various kinds of analytes.11–16 Additionally, the SERS technique yields abundant chemical information for real time and in situ monitoring of the catalytic reaction process.

For successful application of the SERS technique to the monitoring of catalytic reactions, materials that possess both catalytic activity and SERS activity must be developed. Recently, significant progress has been made in the preparation of nanocomposites as SERS substrates to monitor catalytic reactions.17–29 For example, a bimetallic Ag/Pd colloid was synthesized and acted as a SERS substrate for monitoring the catalytic reduction of nitroarenes.17 The SERS signals provide detailed information about the reaction products generated during the catalytic reduction of 4-nitrobenzoic acid, allowing the elucidation of the mechanism of formation of an intermediate amino-derivative and a final product of the azo-derivative. Recently, Han and co-workers also reported the fabrication of a novel Au–Pd bimetallic nanostructure (HIF-AuNR@AuPd) via the site-specific epitaxial growth of Au–Pd alloys at the ends of Au nanorods.18 The as-prepared HIF-AuNR@AuPd nanorods exhibit both high catalytic activity and a strong SERS effect at the ends of the rods, providing an excellent platform to monitor the kinetics of the reduction process and distinguish among different catalytic active sites in the HIF-AuNR@AuPd nanorods. The SERS technique can also be used to monitor photocatalytic processes.30–32 For instance, Shao, Kang, and co-workers fabricated a bifunctional nanocomposite composed of a ZnO nanorod array, reduced graphene oxide, and Au nanoparticles (ZnO–rGO–Au), which could be used as both a SERS-active substrate and photocatalyst, making it a good candidate for the real-time SERS detection of organic pollutants during the photocatalytic degradation process.30 Recently, our group fabricated a sensitive SERS substrate based on ZnO nanofiber-modified silver foil through a simple electrospinning technique and calcination process.31 This substrate provides high efficiency for evaluating the catalytic activity and reaction kinetics of the photodegradation of organic pollutants under ultraviolet irradiation.

Graphene, a novel two-dimensional monolayer of graphite with an extremely large surface area, has been regarded as an ideal matrix to support inorganic nanomaterials to form hybrid functional materials.33–37 Compared with bulk graphene, extended and (or) enhanced performance was generally achieved with the graphene-based hybrid nanomaterials in nanoelectronic devices, catalysis, and energy storage and conversion devices, etc.38–40 In the field of catalysis, the combination of a nanocatalyst with graphene is a favourable approach to enhance its catalytic activity and chemical stability. For instance, CuS–graphene composite nanosheets have been used as peroxidase-like nanocatalyst toward the oxidation of 3,3′,5,5′-tetramethylbenzidine (TMB) in the presence of H2O2.41 The as-prepared CuS–graphene nanocomposite with an appropriate ratio of CuS and graphene exhibited higher catalytic activity than the individual CuS nanoparticles and graphene alone, indicating the synergistic effect between the graphene and CuS components. On the other hand, several research groups have also demonstrated that graphene afforded a unique platform for SERS studies due to the typical functions of surface passivation, surface enrichment, and fluorescence, etc.42,43 Zhang and co-workers prepared a new kind of SERS substrate by depositing metal nano-islands on a graphene layer, providing not only Raman enhancement but also photochemical stability.42

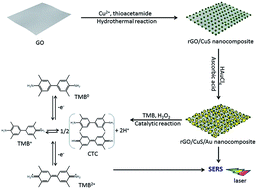
However, there are few reports on the fabrication of multifunctional graphene-based composite nanosheets for monitoring enzyme-like catalytic processes by SERS technique. In this study, we demonstrate a two-step approach for the fabrication of ternary reduced graphene oxide (rGO)/CuS/Au composite nanosheets based on a simple hydrothermal reaction combined with an in situ reduction process. The as-prepared composite nanosheets can be used as a SERS-active substrate for in situ monitoring of the peroxidase-like catalytic reaction. Here, the CuS nanoparticles act as a catalyst for the oxidation of TMB in the presence of H2O2, while the Au nanoparticles ensure the SERS enhancement, providing the ability to detect the Raman signals of oxidized TMB. It has been reported that the localized surface plasmons (LSPs) of metal nanostructures can generate a very strong electromagnetic (EM) field enhancement at particle gaps or close vicinity of the nanopore edges, resulting “hot” SERS-active sites.44,45 On the other hand, the charge transfer (CT) resonances between the adsorbate molecules and metal surface also contributed much to the SERS effect (chemical enhancement, CE),46 and the CT effect can be further enhanced by the combination of metal with semiconductors.47,48 In this work, it is supposed that both EM and CE mechanism contribute the SERS effect due to the unique structure of the rGO/CuS/Au composite nanosheets. It has shown that such a bifunctional platform yields a unique opportunity to investigate the peroxidase-like catalytic reaction kinetics on the surface of nanocatalysts. Furthermore, the detection of H2O2 with high sensitivity can be realized by monitoring changes in the SERS intensity.

Experimental

2.1 Materials

Natural graphite powder (CP), 3,3′,5,5′-tetramethylbenzidine (TMB), and thioacetamide (TAA, C2H5NS, AR) were purchased from Sinopharm Chemical Regent Co., Ltd. Copper acetate monohydrate (CuAc2·H2O, AR) was obtained from Tianjin Huadong Chemical Reagent Works. Sodium hydroxide (NaOH, AR) was purchased from Beijing Chemical Works. Chloroauric acid was obtained from Wako Chemicals and Sinopharm Chemical Regent Co., Ltd. Ascorbic acid (AA) was purchased from Sigma Aldrich and Tianjin Kemiou Chemical Regent Co., Ltd. All the chemicals and reagents were used without further purification.

2.2 Synthesis of rGO/CuS composite nanosheets

GO was synthesized from natural graphite powder through a modified Hummer's and Offeman's method.49 The procedure for preparation of the rGO/CuS composite nanosheets is as follows: 15.0 mg of the as-prepared GO was dispersed in 25 mL of distilled water under ultrasonic irradiation for more than 1 h; 40 mg of CuAc2·H2O in 20 mL of water was then added and again stirred overnight. Subsequently, 16.8 mg of NaOH in 25 mL of water was dropped into the above brown suspension under constant stirring. After 10 min, the precipitate was centrifuged and washed twice with distilled water. Finally, the washed precipitate was transferred into 30 mL of 8 mM TAA aqueous solution in a 50 mL Teflon-lined stainless steel autoclave. The reaction proceeded in an electric oven at 160 °C for 6.5 h. After cooling, the product was centrifuged and washed with distilled water and ethanol several times and dried at 35 °C in an ordinary oven overnight.

2.3 Synthesis of rGO/CuS/Au composite nanosheets

In a typical procedure, 1.25 mg of the as-prepared rGO/CuS composite nanosheets was dispersed in 10 mL of distilled water by ultrasonic treatment for 5 min, after which 100 μL of aqueous HAuCl4 (0.025 mol L−1) solution was slowly dropped into the above rGO/CuS solution under magnetic stirring, followed by the addition of 300 μL of aqueous ammonium solution (10 wt%). Finally, 0.8 mL of 10 mM AA solution was added to reduce HAuCl4 to Au nanoparticles. After 4.5 h, the final product was centrifuged, washed with distilled water and ethanol, and then dried in air at room temperature for one day.

2.4 SERS monitoring of peroxidase-like catalytic oxidation of TMB in the presence of H2O2 by rGO/CuS/Au composites nanosheets

In a typical experiment, 20 μL of 15 mM TMB solution in dimethylsulfoxide (DMSO) solvent was added into 1.0 mL of acetate buffer solution (pH = 4.0) to form solution A. Similarly, 20 μL of H2O2 solution was added to 1.0 mL of acetate buffer solution to form solution B. To monitor the catalytic oxidation of TMB, 10 μL of solution A and 10 μL of the rGO/CuS/Au composite nanosheet suspension were combined; 10 μL of solution B was then added. SERS spectra were acquired directly from the above mixture after different reaction times.

2.5 Characterization

The morphology of the rGO/CuS and rGO/CuS/Au composite nanosheets was characterized using a JEOL JEM-2000EX transmission electron microscope (TEM) operated at 100 kV. A FEI Tecnai G2 F20 electron microscope operated at 200 kV was used to acquire the high-resolution TEM (HRTEM) images and for energy dispersive X-ray (EDX) analysis of the rGO/CuS/Au composite nanosheet. X-ray diffraction (XRD) patterns were obtained with a PANalytical B.V. (Empyrean) diffractometer using Cu-Kα radiation. UV-vis absorption spectra were recorded on a Shimadzu UV-3600 spectrometer. Analysis of the X-ray photoelectron spectra (XPS) was performed on an ESCLAB MKII instrument using Al as the excitation source. Raman spectra were obtained with a Holoprobe Raman microscope; 785 nm radiation was used as the excitation source, and the laser power at the sample position was typically 14.3 mW.

Results and discussion

The overall scheme for the synthesis of the rGO/CuS/Au composite nanosheets was presented in Fig. 1. The process comprises two main steps: firstly, CuS nanoparticles were deposited on the surface of rGO via a simple hydrothermal reaction. An in situ reduction process was then used to modify Au nanoparticles on the surface of the rGO/CuS composite nanosheets. TEM analysis of the surface morphologies of the as-prepared rGO/CuS and rGO/CuS/Au composite nanosheets is summarized in Fig. 2. The rGO/CuS nanocomposite possesses a sheet-like morphology having CuS nanoparticles with diameters of 20–100 nm on the surface of the rGO nanosheets. After the reduction of HAuCl4, Au nanoparticles were deposited on the surface of the rGO/CuS nanosheets. From the TEM image, most of the Au nanoparticles appear to be distributed evenly over the surface of the CuS nanoparticles. The HRTEM image clearly showed the typical lattice interlayer spacing of 0.235 nm, corresponding to the (111) plane of face centered cubic (fcc) Au, indicating the formation of Au nanoparticles.50 The rGO/CuS/Au composite nanosheets were also examined by EDX spectroscopy. As shown in Fig. 2d, C, Cu, S, Au, and Mo were present in the fabricated rGO/CuS/Au composite nanosheets, and no impurity elements were observed in the EDX spectrum, except for Mo. The signal of Mo originates from the carbon-coated Mo grid. This result indicates the formation of CuS and Au nanoparticles on the surface of the rGO nanosheets.
image file: c6ra09471f-f1.tif
Fig. 1 Schematic of the synthesis of rGO/CuS/Au composite nanosheets with both peroxidase-like activity and SERS properties.

image file: c6ra09471f-f2.tif
Fig. 2 TEM images of the as-prepared (a) rGO/CuS and (b) rGO/CuS/Au composite nanosheets. (c) HRTEM image of rGO/CuS/Au composite nanosheets. (d) EDX spectrum of the rGO/CuS/Au composite nanosheets.

XRD assay of the as-prepared rGO/CuS and rGO/CuS/Au composite nanosheets (Fig. 3) showed dominant diffraction peaks at 27.9, 29.3, 32.0, 32.9, 48.1, 52.7, and 59.4° for the rGO/CuS sample. These peaks could be indexed to the (101), (102), (103), (006), (110), (108), and (116) lattice planes of CuS, respectively. The diffraction peaks were consistent with the standard sample of CuS (JCPDS card no. 06-0464), indicating that the as-prepared CuS nanoparticles on the surface of rGO had a pristine hexagonal structure.41 After decoration of rGO/CuS with the Au nanoparticles, additional (111), (200), (220), and (311) reflections of the fcc structure of Au appeared in the XRD pattern, demonstrating the formation of Au nanoparticles and their crystalline nature.


image file: c6ra09471f-f3.tif
Fig. 3 XRD patterns of the as-prepared (a) rGO/CuS and (b) rGO/CuS/Au composite nanosheets.

UV-vis absorption spectra of the as-prepared rGO/CuS and rGO/CuS/Au composite nanosheets were presented in Fig. 4a. The rGO/CuS composite nanosheets exhibited an absorption peak at around 436 nm and another obvious absorption over 700 nm. The broad shoulder over 700 nm is ascribed to the d–d transition of Cu(II) state, which is characteristic of covellite phase.51 After modification of the Au nanoparticles, the absorption peak in the range of 500–720 nm was much enhanced, which might be due to the formation of aggregated Au nanostructures.52,53 Fig. 4b showed Raman spectra of the rGO/CuS and rGO/CuS/Au composite nanosheets. According to previous reports, the peaks around 1312 cm−1 and 1600 cm−1 are ascribed to the D and G band of graphene.54 These two peaks were observed for both the rGO/CuS and rGO/CuS/Au composite nanosheets, indicating the presence of rGO in these nanocomposites. In addition, the high D-band to G-band intensity ratio (ID/IG) for both samples also suggests an increase in the proportion of sp2− conjugated carbon atoms compared with the rGO that reported previously.55 The peak at about 456 cm−1 is attributed to the A1g mode of CuS, and the other peak at around 1030 cm−1 is plausibly related to the A1g coupling.56 All of the above results confirmed that the as-prepared rGO/CuS/Au composite nanosheets are composed of CuS and Au nanoparticles on the surface of the rGO nanosheets.


image file: c6ra09471f-f4.tif
Fig. 4 (a) UV-vis spectra of the as-prepared rGO/CuS and rGO/CuS/Au composite nanosheets. (b) Raman spectrum of rGO/CuS and the rGO/CuS/Au composite nanosheets.

The chemical composition and surface electronic state of the resulting rGO/CuS/Au composite nanosheets were characterized by XPS analysis. Obvious signals of C, O, Cu, S, and Au appeared in the XPS spectrum of the obtained rGO/CuS/Au composite nanosheets (Fig. S1). In detail, the Au 4f spectrum exhibited two peaks at 84.3 and 88.0 eV, which are related to the Au 4f7/2 and Au 4f5/2 states, respectively (Fig. 5a). The binding energies of Au 4f7/2 and Au 4f5/2 were similar to that of Au0 reported previously, confirming the formation of metallic Au nanoparticles in the final product.57 Fig. 5b showed two strong peaks at 932.4 and 952.3 eV, associated with Cu 2p3/2 and Cu 2p1/2. In addition, two weak, shake-up satellite lines at around 944.3 and 963.5 eV were also apparent in the Cu 2p spectrum, indicating the paramagnetic chemical state of Cu2+, which was similar to that documented in a previous report.58 Fig. 5c showed the S 2p spectrum of the rGO/CuS/Au composite nanosheets. The S 2p binding energy peaks that appeared at approximately 162.5 and 163.5 eV are generally ascribed to S 2p3/2 and S 2p1/2, respectively, indicating the formation of the Cu–S bond. The other peak centered at around 169.1 eV might be attributed to the formation of SO42− or S2O32− through the oxidation of S2−.41 The C 1s signal was detected at around 284.7 eV, and no additional large peaks of C–O and C[double bond, length as m-dash]O were observed, confirming the formation of rGO during the hydrothermal reaction between GO and TAA (Fig. 5d). All the XPS data indicated that the rGO/CuS/Au composite nanosheets were successfully prepared in this study.


image file: c6ra09471f-f5.tif
Fig. 5 XPS spectra of the as-prepared rGO/CuS/Au composite nanosheets. (a) Au 4f, (b) Cu 2p, (c) S 2p, (d) C 1s.

The peroxidase-like activity of the as-prepared rGO/CuS/Au composite nanosheets was also evaluated toward the oxidation of the peroxidase substrate TMB in the presence of H2O2. Similar to horseradish peroxidase and CuS nanostructures, the rGO/CuS/Au composite nanosheets can catalyze the oxidation of TMB by H2O2 to produce a typical blue color in only several minutes. In contrast, no obvious blue colour was generated with the TMB + H2O2 system, the rGO/CuS/Au composite nanosheets + TMB mixture, or the rGO/CuS/Au composite nanosheets + H2O2 mixture (Fig. 6a). UV-vis analysis was used to evaluate the peroxidase-like activity of the rGO/CuS/Au composite nanosheets. As shown in Fig. 6b, three strong absorption peaks centered at around 369, 453, and 652 nm were observed for the rGO/CuS/Au composite nanosheets + TMB + H2O2 system, which originate from the oxidation of TMB. Consistent with the colorimetric result, no obvious absorption peaks appeared in the range of 330 to 750 nm for the TMB + H2O2 solution, rGO/CuS/Au composite nanosheets + TMB mixture, and rGO/CuS/Au composite nanosheets + H2O2 mixture. This result indicated that the peroxidase-like catalytic activity was ascribed to the oxidation of TMB by H2O2 in the presence of the rGO/CuS/Au composite nanosheets.


image file: c6ra09471f-f6.tif
Fig. 6 (a) Photographs (from left to right) and (b) UV-vis spectra of TMB–H2O2 (black line), rGO/CuS/Au–TMB solution (green line), rGO/CuS/Au–H2O2 solution (blue line), and rGO/CuS/Au–TMB–H2O2 solution (red line) in pH 4.0 acetate buffer at room temperature.

The as-prepared rGO/CuS/Au composite nanosheets are not only a good nanocatalyst with peroxidase-like activity but also an efficient SERS substrate that could be used to monitor the catalytic oxidation of TMB by H2O2. Monitoring of the catalytic process by SERS was carried out with a 785 nm laser excitation, and SERS signals were collected from the rGO/CuS/Au composite nanosheet substrate. The SERS spectra of the TMB solution in the presence of the rGO/CuS/Au composite nanosheets and H2O2 at different time intervals were shown in Fig. 7. Characteristic bands at 679, 713, and 893 cm−1 could be clearly observed immediately upon combination of the components. The peak at 893 cm−1 is a characteristic peak of the acetic acid solvent,59 while the bands at 679 and 713 cm−1 are attributed to the ring and C–H out-of-plane bending modes of the TMB molecules.60 With the progress of time, these three dominant bands did not change much, but some new peaks emerged, which might be due to the surface enhanced resonance Raman scattering of the oxidized TMB molecules on the surface of the rGO/CuS/Au composite nanosheet substrate. The new bands at about 558, 1192, 1335, and 1613 cm−1 are characteristic of the charge transfer complex (CTC) and radical cation of TMB (TMB+), which is consistent with the UV-vis absorption spectrum. These new bands are due to ring deformation, the CH3 bending mode, inter-ring C–C stretching mode, and ring stretching and C–H bending modes, respectively.61,62 Furthermore, the SERS spectrum could also give information about the peroxidase-like catalytic activity and reaction kinetics for the oxidation of TMB by the rGO/CuS/Au composite nanosheets in the presence of H2O2. Because the concentration of the oxidized TMB is proportional to its SERS intensity, the relationship between the relative SERS intensity of the characteristic peaks and the reaction time for the catalytic oxidation of TMB in the presence of H2O2 was evaluated. As shown in Fig. 8a and b, using the intensity of the SERS signals of the oxidized TMB molecules at 558 and 1192 cm−1, linear relationships between the relative SERS intensity (I558/I893 and I1192/I893) and the time was obtained in the range of 0 to 20 min. This result indicated that the peroxidase-like catalytic process may follow pseudo-zero-order kinetics.


image file: c6ra09471f-f7.tif
Fig. 7 (a) Changes in SERS spectra during peroxidase-like catalytic oxidation of TMB on the rGO/CuS/Au composite nanosheet substrate in the presence of H2O2. The time interval adopted for the spectral sequence is 1 min. (b) Enlarged spectra in the 1640–1593, 1355–1325, and 1212–1162 cm−1 regions.

image file: c6ra09471f-f8.tif
Fig. 8 Linear relationship between the time and relative intensity of the SERS bands at (a) 558 cm−1 and (b) 1192 cm−1 for oxidized TMB.

It is well known that the accurate detection of H2O2 is important in the fields of food production, medicine, industry, and environmental protection. Because H2O2 is involved in the oxidation of TMB with consequent color and SERS intensity changes depending on the H2O2 concentration, this is a facile approach for the determination of H2O2 by SERS analysis. Given that the concentration of H2O2 is proportional to the intensity of the SERS peaks at 558, 1192, 1335, and 1613 cm−1, which correspond to the oxidation of TMB, H2O2 can be quantitatively determined by monitoring the SERS spectrum during the oxidation of TMB (Fig. 9a). Taking the peak at 558 cm−1 as an example, Fig. 9b plotted the relative SERS intensity of the peak at 558 and 893 cm−1 versus the H2O2 concentration. The SERS intensity increased as the H2O2 concentration increased, and a linear correlation in the concentration ranges of 3.05–50 μM was observed (inset of Fig. 9b). From the linear correlation in the range of 3.05–50 μM, the detection limit was estimated to be about 2.1 μM (S/N = 3), which is much lower than that obtained using Au@Pt and Au@PtAg nanorods as peroxidase mimetic and monitored by UV-vis absorption spectroscopy.63,64 This result indicated that the peroxidase-like catalytic reaction monitored by the SERS technique could provide a facile and sensitive method for the detection of H2O2.


image file: c6ra09471f-f9.tif
Fig. 9 (a) Change in the SERS spectra for the oxidized TMB molecules on the rGO/CuS/Au composite nanosheets substrate with variation of the H2O2 concentration (from top down: 0.20 M, 0.10 M, 0.05 M, 25.00 mM, 12.50 mM, 6.25 mM, 3.12 mM, 1.56 mM, 0.78 mM, 0.39 mM, 0.20 mM, 0.10 mM, 0.05 mM, 24.40 μM, 12.20 μM, 6.10 μM, and 3.05 μM). (b) Relationship between the relative SERS intensity (I558/I893) and the H2O2 concentration. The inset shows the curve of linear relationship between the relative SERS intensity (I558/I893) and the H2O2 concentration in the range of 3.05–50 μM.

Conclusions

In summary, we have successfully fabricated ternary rGO/CuS/Au composite nanosheets through a hydrothermal reaction followed by an in situ reduction process for the first time. The morphology and chemical structure of the synthesized rGO/CuS/Au composite nanosheets were characterized by TEM, XRD, UV-vis, Raman, and XPS analyses. The as-prepared rGO/CuS/Au composite nanosheets could not only be used as a nanocatalyst for the oxidation of TMB in the presence of H2O2, but also as a sensitive SERS substrate. Therefore, we have demonstrated the possibility of in situ monitoring of the peroxidase-like catalytic process by the SERS technique, and the determination of H2O2 with a low detection limit. As an advantage, this technique affords the opportunity to monitor the enzyme-like catalytic reaction and sensitive detection of substances through SERS assay by using bifunctional graphene-based nanocomposites as a SERS substrate. It is anticipated that the developed strategy for the preparation of bifunctional nanomaterials could be extended to the detection of other substances such as glucose, xanthine, acetylcholine, and ascorbic acid in biological media.

Acknowledgements

This work was supported by the National Natural Science Foundation of China (no. 21273091, 21327803, 21473068), the Development Program of the Science and Technology of Jilin Province (20130522137JH), and a Support Project to Assist Private Universities in Developing Bases for Research (Research Centre for Single Molecule Vibrational Spectroscopy) from the Ministry of Education, Culture, Sports, Science and Technology of Japan.

Notes and references

  1. C. Coperet, M. Chabanas, R. P. Saint-Arroman and J. M. Basset, Angew. Chem., Int. Ed., 2003, 42, 156–181 CrossRef CAS PubMed.
  2. J.-M. Basset, C. Coperet, D. Soulivong, M. Taoufik and J. Thivolle-Cazat, Acc. Chem. Res., 2010, 43, 323–334 CrossRef CAS PubMed.
  3. J. L. Shi, Chem. Rev., 2013, 113, 2139–2181 CrossRef CAS PubMed.
  4. V. Polshettiwar, R. Luque, A. Fihri, H. B. Zhu, M. Bouhrara and J. M. Basset, Chem. Rev., 2011, 111, 3036–3075 CrossRef CAS PubMed.
  5. J. Ryczkowski, Catal. Today, 2001, 68, 263–381 CrossRef CAS.
  6. M. A. Banares and G. Mestl, Adv. Catal., 2009, 52, 43–128 CAS.
  7. F. C. Jentoft, Adv. Catal., 2009, 52, 129–211 CAS.
  8. U. Bentrup, Chem. Soc. Rev., 2010, 39, 4718–4730 RSC.
  9. F. T. Fan, Z. C. Feng and C. Li, Chem. Soc. Rev., 2010, 39, 4794–4801 RSC.
  10. C. E. Harvey and B. M. Weckhuysen, Catal. Lett., 2015, 145, 40–57 CrossRef CAS PubMed.
  11. Z. Q. Tian, B. Ren, J. F. Li and Z. L. Yang, Chem. Commun., 2007, 3514–3534 RSC.
  12. S. M. Nie and S. R. Emery, Science, 1997, 275, 1102–1106 CrossRef CAS PubMed.
  13. M. K. Hossain, Y. Kitahama, G. G. Huang, X. X. Han and Y. Ozaki, Anal. Bioanal. Chem., 2009, 394, 1747–1760 CrossRef CAS PubMed.
  14. Y. Ozaki, K. Kneipp and R. Aroca, Frontiers of Surface-Enhanced Raman Scattering: Single Nanoparticles and Single Cells, John Wiley & Sons, Inc., 2014 Search PubMed.
  15. E. Le Ru and P. Etchegoin, Principles of Surface-Enhanced Raman Spectroscopy and Related Plasmonic Effects, Elsevier, Amsterdam, 2009 Search PubMed.
  16. K. Kneipp, M. Moskovits and H. Kneipp, Surface-Enhanced Raman Scattering-Physics and Applications, Springer, Heidelberg, Berlin, 2006 Search PubMed.
  17. M. Muniz-Miranda, B. Pergolese and A. Bigotto, Chem. Phys. Lett., 2006, 423, 35–38 CrossRef CAS.
  18. J. F. Huang, Y. H. Zhu, M. Lin, Q. X. Wang, L. Zhao, Y. Yang, K. X. Yao and Y. Han, J. Am. Chem. Soc., 2013, 135, 8552–8561 CrossRef CAS PubMed.
  19. I. Najdovski, P. R. Selvakannan and A. P. O'Mullane, RSC Adv., 2014, 4, 7207–7215 RSC.
  20. Z. Y. Bao, D. Y. Lei, R. B. Jiang, X. Liu, J. Y. Dai, J. F. Wang, H. L. W. Chan and Y. H. Tsang, Nanoscale, 2014, 6, 9063–9070 RSC.
  21. Q. L. Cui, G. Z. Shen, X. H. Yan, L. D. Li, H. Möhwald and M. Bargheer, ACS Appl. Mater. Interfaces, 2014, 6, 17075–17081 CAS.
  22. Y. F. Huang, H. P. Zhu, G. K. Liu, D. Y. Wu, B. Ren and Z. Q. Tian, J. Am. Chem. Soc., 2010, 132, 9244–9246 CrossRef CAS PubMed.
  23. M. H. Cao, L. Zhou, X. Q. Xu, S. Cheng, J. L. Yao and L. J. Fan, J. Mater. Chem. A, 2013, 1, 8942–8949 CAS.
  24. V. Joseph, C. Engelbrekt, J. D. Zhang, U. Gernert, J. Ulstrup and J. Kneipp, Angew. Chem., Int. Ed., 2012, 51, 7592–7596 CrossRef CAS PubMed.
  25. W. Xie, C. Herrmann, K. Kompe, M. Haase and S. Schlucker, J. Am. Chem. Soc., 2011, 133, 19302–19305 CrossRef CAS PubMed.
  26. K. N. Heck, B. G. Janesko, G. E. Scuseria, N. J. Halas and M. S. Wong, J. Am. Chem. Soc., 2008, 130, 16592–16600 CrossRef CAS PubMed.
  27. K. Kim, K. L. Kim and K. S. Shin, J. Phys. Chem. C, 2011, 115, 14844–14851 CAS.
  28. S. Z. Zou, C. T. Williams, E. K. Y. Chen and M. J. Weaver, J. Am. Chem. Soc., 1998, 120, 3811–3812 CrossRef CAS.
  29. J. M. Li, J. Y. Liu, Y. Yang and D. Qin, J. Am. Chem. Soc., 2015, 137, 7039–7042 CrossRef CAS PubMed.
  30. C. Y. Wen, F. Liao, S. S. Liu, Y. Zhao, Z. H. Kang, X. L. Zhang and M. W. Shao, Chem. Commun., 2013, 49, 3049–3051 RSC.
  31. W. Song, W. Ji, S. Vantasin, I. Tanabe, B. Zhao and Y. Ozaki, J. Mater. Chem. A, 2015, 3, 13556–13562 CAS.
  32. J. L. Wang, R. A. Ando and P. H. C. Camargo, Angew. Chem., Int. Ed., 2015, 54, 6909–6912 CrossRef CAS PubMed.
  33. A. K. Geim and K. S. Novoselov, Nat. Mater., 2007, 6, 183–191 CrossRef CAS PubMed.
  34. C. N. R. Rao, A. K. Sood, K. S. Subrahmanyam and A. Govindaraj, Angew. Chem., Int. Ed., 2009, 48, 7752–7777 CrossRef CAS PubMed.
  35. M. J. Allen, V. C. Tung and R. B. Kaner, Chem. Rev., 2010, 110, 132–145 CrossRef CAS PubMed.
  36. M. Pumera, Chem. Soc. Rev., 2010, 39, 4146–4157 RSC.
  37. Y. W. Zhu, S. Murali, W. W. Cai, X. S. Li, J. W. Suk, J. R. Potts and R. S. Ruoff, Adv. Mater., 2010, 22, 3906–3924 CrossRef CAS PubMed.
  38. N. O. Weiss, H. L. Zhou, L. Liao, Y. Liu, S. Jiang, Y. Huang and X. F. Duan, Adv. Mater., 2012, 24, 5782–5825 CrossRef CAS PubMed.
  39. X. B Fan, G. L. Zhang and F. B. Zhang, Chem. Soc. Rev., 2015, 44, 3023–3035 RSC.
  40. X. L. Wang and G. Q. Shi, Energy Environ. Sci., 2015, 8, 790–823 CAS.
  41. G. D. Nie, L. Zhang, X. F. Lu, X. J. Bian, W. N. Sun and C. Wang, Dalton Trans., 2013, 42, 14006–14013 RSC.
  42. W. G. Xu, X. Ling, J. Q. Xiao, M. S. Dresselhaus, J. Kong, H. X. Xu, Z. F. Liu and J. Zhang, Proc. Natl. Acad. Sci. U. S. A., 2012, 109, 9281–9286 CrossRef CAS PubMed.
  43. W. G. Xu, N. N. Mao and J. Zhang, Small, 2013, 9, 1206–1224 CrossRef CAS PubMed.
  44. X. Y. Zhang, Y. H. Zheng, X. Liu, W. Lu, J. Y. Dai, D. Y. Lei and D. R. MacFarlane, Adv. Mater., 2015, 27, 1090–1096 CrossRef CAS PubMed.
  45. Z. Y. Bao, X. Liu, J. Y. Dai, Y. C. Wu, Y. H. Tsang and D. Y. Lei, Appl. Surf. Sci., 2014, 301, 351–357 CrossRef CAS.
  46. C. H. Ho and S. Lee, Colloids Surf., A, 2015, 474, 29–35 CrossRef CAS.
  47. S. Hsieh, P. Y. Lin and L. Y. Chu, J. Phys. Chem. C, 2014, 118, 12500–12505 CAS.
  48. L. B. Yang, X. Jiang, W. D. Ruan, J. X. Yang, B. Zhao, W. Q. Xu and J. R. Lombardi, J. Phys. Chem. C, 2009, 113, 16226–16231 CAS.
  49. W. S. Hummers and R. E. Offeman, J. Am. Chem. Soc., 1958, 80, 1339 CrossRef CAS.
  50. M. G. Wang, J. Han, H. X. Xiong and R. Guo, Langmuir, 2015, 31, 6220–6228 CrossRef CAS PubMed.
  51. M. Pal, N. R. Mathews, E. Sanchez-Mora, U. Pal, F. Paraguay-Delgado and X. Mathew, J. Nanopart. Res., 2015, 17, 301 CrossRef.
  52. A. J. Wang, Y. F. Li, M. Wen, G. Yang, J. J. Feng, J. Yang and H. Y. Wang, New J. Chem., 2012, 36, 2286–2291 RSC.
  53. C. S. Shi, L. F. Tian, L. L. Wu and J. Zhu, J. Phys. Chem. C, 2007, 111, 1243–1247 CAS.
  54. J. Bai and X. Jiang, Anal. Chem., 2013, 85, 8095–8101 CrossRef CAS PubMed.
  55. S. Bose, T. Kuila, M. E. Uddin, N. H. Kim, A. K. T. Lau and J. H. Lee, Polymer, 2010, 51, 5921–5928 CrossRef CAS.
  56. B. Minceva-Sukarova, M. Najdoski, I. Grozdanov and C. J. Chunnilall, J. Mol. Struct., 1997, 410–411, 267–270 CAS.
  57. Y. Tong, Z. C. Li, X. F. Lu, L. Yang, W. N. Sun, G. D. Nie, Z. J. Wang and C. Wang, Electrochim. Acta, 2013, 95, 12–17 CrossRef CAS.
  58. J. Zhang, J. G. Yu, Y. M. Zhang, Q. Li and J. R. Gong, Nano Lett., 2011, 11, 4774–4779 CrossRef CAS PubMed.
  59. S. X. Xue, J. P. Wang and H. Hu, Technol. Dev. Chem. Ind., 2011, 40, 45–47 CAS.
  60. S. Akyüz, T. Bulat, A. E. Özel and G. Basar, Vib. Spectrosc., 1997, 14, 151–154 CrossRef.
  61. S. Laing, A. Hernandez-Santana, J. Sassmannshausen, D. L. Asquith, I. B. McInnes, K. Faulds and D. Graham, Anal. Chem., 2011, 83, 297–302 CrossRef CAS PubMed.
  62. M. Kubinyi, G. Varsányi and A. Grofcsik, Spectrochim. Acta, Part A, 1980, 36, 265–272 CrossRef.
  63. J. B. Liu, X. N. Hu, S. Hou, T. Wen, W. Q. Liu, X. Zhu, J. J. Yin and X. C. Wu, Sens. Actuators, B, 2012, 166–167, 708–714 CrossRef CAS.
  64. X. N. Hu, A. Saran, S. Hou, T. Wen, Y. L. Ji, W. Q. Liu, H. Zhang, W. W. He, J. J. Yin and X. C. Wu, RSC Adv., 2013, 3, 6095–6105 RSC.

Footnote

Electronic supplementary information (ESI) available: XPS survey spectra. See DOI: 10.1039/c6ra09471f

This journal is © The Royal Society of Chemistry 2016