Highly emissive, naked-eye solvatochromic probe based on styryl tetrahydrodibenzo[a,i]phenanthridine for acidochromic applications†
Umamahesh Balijapalli,
Saravanakumar Manickam,
Manojkumar Dhanthalu Thiyagarajan and
Sathiyanarayanan Kulathu Iyer*
School of Advanced Sciences, VIT University, Vellore-632014, Tamilnadu, India. E-mail: sathiya_kuna@hotmail.com; Fax: +91 416 224 3092; Tel: +91 0416 2244520
First published on 6th June 2016
Abstract
A new series of 5-styryl tetrahydrodibenzo[a,i]phenanthridines was readily synthesized from β-tetralone, ammonium acetate and cinnamaldehydes. These dyes emitted light with large Stokes shift values of 3894–7265 cm−1, depending on the nature of the substituent. The dyes displayed positive solvatochromism in their emission spectra, suggestive of a more polar excited state. Dye 3c exhibited aggregation-induced emission (AIE) property in 10% THF–water mixture besides a ratiometric response to pH from 10.75 to 2.16 with blue shift of 84 nm in emission. The emission ratio (I526![[thin space (1/6-em)]](https://www.rsc.org/images/entities/char_2009.gif) :
:![[thin space (1/6-em)]](https://www.rsc.org/images/entities/char_2009.gif) I442) further displayed a good linearity with pH in the range of 4.1 to 6.8 and the corresponding pKa value was found to be 4.55 ± 0.03. The addition of TFA led to a prominent bathochromic shift in spectra along with clear colour changes owing to protonation at the phenanthridine segment. Further, a second protonation of the phenanthrinium segment could take place based on the pKa strength of the acid added. The pH dependent spectral changes were successfully applied to quantitatively detect pH in biological fluids and acid impurities in solvents.
I442) further displayed a good linearity with pH in the range of 4.1 to 6.8 and the corresponding pKa value was found to be 4.55 ± 0.03. The addition of TFA led to a prominent bathochromic shift in spectra along with clear colour changes owing to protonation at the phenanthridine segment. Further, a second protonation of the phenanthrinium segment could take place based on the pKa strength of the acid added. The pH dependent spectral changes were successfully applied to quantitatively detect pH in biological fluids and acid impurities in solvents.
Introduction
Organic electronics is maturing for use in essential applications owing to high efficiency, flexibility, and low cost as well as tuning of functionality, relative to silicon-based electronics, and has evolved as an important field of interest in academia as well as in industry.1 In particular, much attention had been paid on organic luminescent materials featuring donor–π bridge–acceptor architectures owing to their applications as semiconductors in thin film transistors (TFT), as organic dyes in dye-sensitized solar cells, as emitting charge transporters in organic light emitting devices (OLEDs)2 and also as suitable candidates for display of large nonlinear responses.3 One of the important aspects involved in displaying such properties is the presence and/or the nature of functionalities,4 and are typically constructed by an aromatic π-linker facilitating the intramolecular charge transfer (ICT) process between the donor and acceptor moieties.5 Among a wide variety of luminescent units, the pyridine-fused electron-deficient unit has become a popular building block to construct conjugated organic materials with low band gap for optoelectronic applications because of its strong electron-withdrawing ability, easy functionalization, and tuneable lowest unoccupied molecular orbital (LUMO) levels.6 Due to the constant demand for novel tailor-made functional π-systems, new and reliable accesses towards such compounds have to be established.7Recently, nitrogen heterocycles such as pyridazine, pyrimidine, pyrazoline, imidazopyridine, phenazine, quinazoline, coumarin and pyrazines have received intensive research interest for the synthesis of functionalized π-conjugated materials due to their desirable applications in the sensor industry.8 Further, the utility of fluorescent probes have been expanded to living systems and the demand for dyes with diverse spectral and tunable optical properties has enlarged to operate at intracellular pH levels and in highly acidic conditions.9 Fluorescent pH probes have been proved to be powerful tools for investigating the role of intracellular pH and acid–base interactions in diverse physiological10 and pathological processes.11 Precisely, in the biomedical field the monitoring of the cellular pH in the acidic pH window and quantitative detection of H+ are of importance. Due to high sensitivity, simplicity and non-invasiveness, ratiometrically designed sensors are more advantageous than many methods available to measure cellular pH.12 However, many of them are used as emission intensity based sensors, which have a limitation at low level detection.13
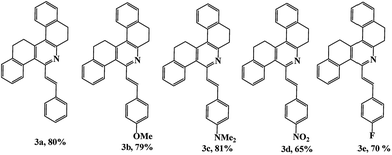
Tetrahydrodibenzophenanthridines, which belong to the most important class of heterocycles containing pyridine rings, are composed of five fused six-membered rings and contain one nitrogen atom, and they are widely distributed in many natural products and biologically active compounds.14 With their highly π-conjugated aromatic character, these are good candidates to be incorporated as platforms into push–pull scaffolds favouring intramolecular charge transfer (ICT). Additionally, the pyridine ring allows protonation, hydrogen-bond formation, and chelation through the nitrogen atom; which is also of considerable importance since such derivatives could be used for the formation of molecular assemblies and as sensors.15 In this work, for the first time we report on the synthesis and optical properties of styryltetrahydrodibenzophenanthridines (STHDPs) (Chart 1). To study the impact of the nature of variation in the donor/acceptor strength along with extended-π-conjugation on the optical properties, investigation was conducted on derivatives possessing both electron donating and electron withdrawing groups. We have investigated the sensitivity of these dyes towards pH level, water–solvent mixtures, acids, and solvents with different polarities, which could be considered as prototype studies. The phenomenon of chromophores changing color on interaction with acids, pH solutions, solvents, and water–solvent mixture, is termed as acidochromism, halochromism, solvatochromism and aggregation induced emission, respectively.
Results and discussion
Synthesis and characterization
5-Styryl-7,8,13,14-tetrahydrodibenzo[a,i]phenanthridines (STHDPs) (3a–e) were synthesized from cinnamaldehydes, ammonium acetate and 2-tetralone according to our earlier reported procedure,16 as shown in Scheme 1. Due to the presence of intervening π-conjugation between the phenyl group and phenanthridine moiety, these dyes (Chart 1) are highly emissive in both solid and solution states. All the compounds were characterized and confirmed by FTIR, 1H NMR, 13C NMR, HRMS and X-ray crystallography. 1H NMR spectra reveal that the compounds exist in trans configuration as the two vinylic protons show a coupling constant of 16 Hz. Further, to explore the solid-state fluorescence properties, X-ray crystallographic analysis was performed for compound 3d. The ORTEP diagram of compound 3d is given in Fig. 1. Compound 3d crystallized in the monoclinic system without solvation. A near zero dihedral angle between the two aromatic moieties could be attributed to the presence of an ethylene bridge that connects the 2,2′ positions of both the phenyl groups enforcing co-planarity between the two-adjacent rings.17 Because of this, 3d is expected to have extended π-conjugation in the overall molecule, which facilitates ICT process through the molecule which in turn finely tunes the emission.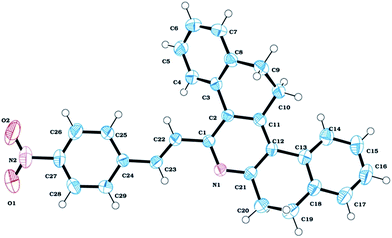 | ||
| Fig. 1 ORTEP diagram of compound 3d with ellipsoids shown at the 40% contour percent probability level (CCDC-1453322†). | ||
Optical properties
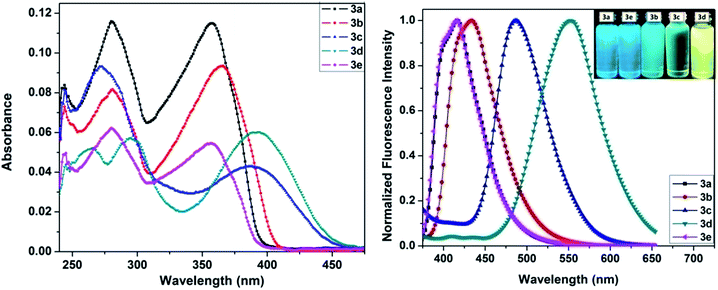
The optical studies of the dyes were conducted in chloroform solution. The corresponding absorption and emission spectra are shown in Fig. 2 and the relevant data are tabulated in Table 1. The dye 3a shows two well resolved peaks wherein the broad and intense absorption band at the lowest energy absorption maxima was observed around 360 nm attributable to the electronic transition originating from singlet ground (S0) to the first excited state (S1), S0 → S1. Substitution of dye 3a with electron donating OMe (3b), NMe2 (3c), and electron withdrawing NO2 (3d), F (3e) groups in the styryl ring introduces π-conjugation between donor and acceptor configurations, thereby red-shifting the absorption maximum by a factor of 28–36 nm, depending on the nature of the substituent. Notably, the nitro derivative (3d) showed a more red shifted absorption profile at 394 nm compared to the dialkylamine derivative (3c) at 386 nm. The impact of the nature of the styryl segment on the peak position of the lower energy absorbance band is reflected by the following trend (3e < 3a < 3b < 3c < 3d).| Compound | λabs/nm | λfl/nm | Stokes shift/cm−1 | ΦFb | τFc/ns | Krd/108 s−1 | Knre/108 s−1 | |
|---|---|---|---|---|---|---|---|---|
| Solution | Solid | |||||||
| a The absorbance and fluorescence spectra of dyes were recorded in 2 × 10⁻⁵ mol dm−3 solutions in chloroform.b The fluorescence quantum yields (ΦF) were estimated with quinine sulfate (ΦF) 0.55 in 0.5 M H2SO4 solution as a standard, λex = 366 nm.c Fluorescence lifetimes were measured by exciting the samples at 375 nm using time-correlated single-photon-counting technique using a 150 ps pulse nanoLED.d Kr measured by using Kr = [ΦF/τF].e Knr measured by using Knr = Kr[(1/ΦF) − 1]. | ||||||||
| 3a | 280, 358 | 416 | 470 | 3894 | 0.09 | 1.82 | 0.49 | 4.95 |
| 3b | 281, 366 | 434 | 462 | 4281 | 0.14 | 1.92 | 0.72 | 3.01 |
| 3c | 273, 386 | 486 | 512 | 5331 | 0.25 | 5.45 | 0.46 | 2.16 |
| 3d | 266, 295, 394 | 552 | 556 | 7265 | 0.34 | 2.85 | 1.19 | 2.31 |
| 3e | 280, 354 | 416 | 458 | 4210 | 0.10 | 1.80 | 0.55 | 4.95 |
The emission maximum of dye 3a was observed at 416 nm and showed a mirror image relationship with the respective lowest energy absorption band (see ESI Fig. 1†) and the corresponding Stokes shift value was calculated to be 3894 cm−1. The high Stokes shift values were due to the fact that significant structural perturbations occur during the transition from the ground to the excited state. In addition the presence of the styryl ring and a strong donor/acceptor group interaction connected to the phenanthridine moiety through intervening π-conjugation probably induces the intramolecular charge transfer (ICT) character,8e which would also be responsible for the observed large Stokes shift values. Similar to the absorbance profiles, the fluorescence spectra were found to be red shifted to different degrees depending on the nature of the substitution and the corresponding emission color changes are given in Fig. 2 (inset). In particular, the nitro derivative 3d shows a 136 nm red shifted (λfl = 552 nm) emission with respect to compound 3a (λfl = 416 nm, Δss = 3894 cm−1) with a Stokes shift value of 7265 cm−1. These observed features suggest the possibility of strong ICT interactions between the phenanthridine donor and nitro-substituted styryl acceptor. Furthermore, the electron donating N,N-dialkylamino group of 3c exhibited similar behavior to 3d with almost comparable magnitude, revealing the ICT interactions, wherein the N,N-dialkylamino styryl group acts as a donor and phenanthridine moiety as acceptor.
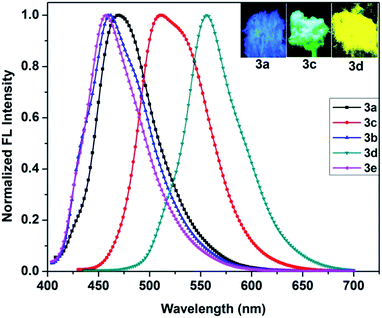
Next, the fluorescence quantum yields (ΦF) were measured with reference to quinine sulfate (ΦF = 0.55 in 0.5 M H2SO4) and found to be 0.09, 0.14, 0.25, 0.34, 0.10 for 3a, 3b, 3c, 3d and 3e, respectively, in chloroform. The nature of the substituent on the styryl segment at position 5 of the phenanthridine ring influenced ΦF to a significant extent. For instance, the presence of a dialkylamino group in the para position of the styryl ring enhanced the ΦF by ∼3 times for 3c compared to 3a. Markedly, dye 3d showed 4 times greater ΦF than 3a by replacing the H atom in the latter with the NO2 group. The solid-state emission spectra of dyes 3a–e exhibited major emission maxima between 458 and 556 nm, as shown in Fig. 3. Importantly, the solid-state emission maxima of the dyes were red shifted when compared to their emission maxima in solution by a factor of 26–54 nm. The broad shape of the emission band for dye 3d in solution became narrower in the solid whereas an opposite effect was observed in 3c, consequently making it strongly emissive in the solid state. Further, to understand the excited state properties, fluorescence lifetimes were measured by exciting the samples at 375 nm using a time-correlated single-photon-counting technique. The decay profiles were collected by monitoring the emission at the respective emission maximum wavelength and were fitted with a single exponential function. The fluorescence lifetime of 3a was measured to be 1.82 ns, which was increased by a factor of three to 5.45 ns upon substitution of the styryl ring in 3c, in concurrence with ΦF measurements. This behaviour concludes that the impact of donor or acceptor groups plays an important role in tuning the optical properties of such styryl phenanthridines.
Solvatochromism
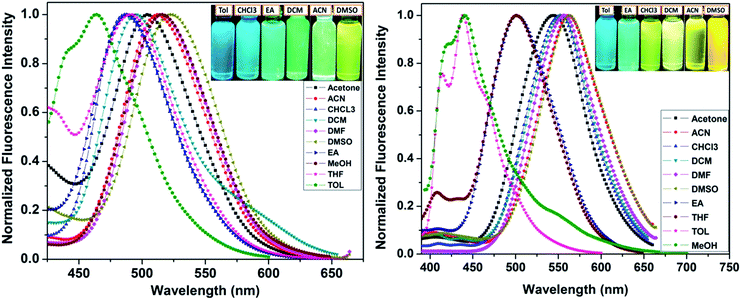
The possibility of ICT interactions in STHDPs derivatives can be understood from the solvent polarity dependent photophysical properties. The absorption spectra of all the dyes marginally depended on solvent polarity, with a slight red shift indicating negligible intramolecular interactions in the ground state. In contrast, the emission spectra displayed distinct solvent dependence and their corresponding optical data are summarized in Table 2. Significantly, a red shift of emission bands, along with an increase in ΦF, was observed on increasing the electron donating/withdrawing strength of the styryl ring. As far as the fluorescence maxima is concerned, while moving from toluene to DMSO, a red shift of 58 nm in emission was observed for dye 3c and the corresponding spectra are shown in Fig. 4. A similar bathochromic tendency with higher magnitude, i.e.124 nm red shift, was observed in DMSO for dye 3d, with greater electron withdrawing tendency reflected in the larger bathochromic shift. Though the emission of 3d was strong in non-polar solvents, its emission was blue shifted in protic polar solvents such as methanol. The blue shifted emission maximum of dye 3d suggests comparatively weak structural perturbations and stabilization between the ground and excited state geometries occurring in protic polar solvents. The dye 3b showed a marginal effect while no effect of polarity was observed for dyes 3a and 3e probably due to the lack of solvent induced interactions in the excited state (for spectra see ESI Fig. 3, ESI†).| Solvent | 3a | 3b | 3c | 3d | 3e | ||||||||||||
|---|---|---|---|---|---|---|---|---|---|---|---|---|---|---|---|---|---|
| λabsa,b | λflb (ΦF)c | Δss/cm−1 | λabs | λfl (ΦF) | Δss/cm−1 | λabs | λfl (ΦF) | Δss/cm−1 | τd/ns | λabs | λfl (ΦF) | Δss/cm−1 | τ/ns | λabs | λfl (ΦF) | Δss/cm−1 | |
| a Lower energy absorption maxima.b The absorbance and fluorescence spectra of dyes were recorded in 2 × 10⁻⁵ mol dm−3 solutions at different solvents.c The fluorescence quantum yields (ΦF) were estimated with quinine sulfate (ΦF) 0.55 in 0.5 M H2SO4 solution as a standard, λex = 366 nm.d Fluorescence lifetimes were measured by exciting the samples at 375 nm using time-correlated single-photon-counting technique using a 150 ps pulse nanoLED. | |||||||||||||||||
| Toluene | 357 | 414 (0.02) | 3857 | 367 | 436 (0.11) | 4312 | 393 | 464 (0.09) | 3894 | 1.55 | 391 | 438 (0.11) | 2744 | 1.37 | 357 | 414 (0.08) | 3857 |
| THF | 357 | 412 (0.03) | 3739 | 365 | 430 (0.16) | 4141 | 389 | 492 (0.16) | 5382 | 2.13 | 389 | 500 (0.24) | 5707 | 2.38 | 357 | 412 (0.09) | 3939 |
| DCM | 373 | 414 (0.11) | 2655 | 379 | 430 (0.17) | 3129 | 401 | 496 (0.17) | 4776 | 1.29 | 389 | 554 (0.32) | 7656 | 2.99 | 376 | 414 (0.13) | 2441 |
| Ethyl acetate | 355 | 410 (0.05) | 3779 | 363 | 428 (0.09) | 4184 | 386 | 488 (0.21) | 5415 | 1.59 | 387 | 502 (0.31) | 5919 | 1.03 | 354 | 412 (0.06) | 3977 |
| Acetone | 355 | 412 (0.08) | 3897 | 363 | 424 (0.15) | 3963 | 388 | 504 (0.29) | 5932 | 1.25 | 388 | 544 (0.36) | 7391 | 3.13 | 356 | 412 (0.03) | 3818 |
| MeOH | 351 | 412 (0.05) | 4218 | 358 | 430 (0.11) | 4677 | 383 | 516 (0.25) | 6730 | 4.32 | 380 | 440 (0.03) | 3589 | 3.53 | 348 | 412 (0.02) | 4464 |
| CH3CN | 358 | 412 (0.02) | 3661 | 366 | 430 (0.14) | 4067 | 386 | 512 (0.36) | 6375 | 1.63 | 394 | 562 (0.43) | 7587 | 3.01 | 357 | 410 (0.07) | 3621 |
| DMF | 358 | 416 (0.08) | 3895 | 366 | 434 (0.13) | 4281 | 395 | 516 (0.42) | 5937 | 1.80 | 394 | 556 (0.44) | 7395 | 3.09 | 358 | 414 (0.10) | 3778 |
| DMSO | 360 | 418 (0.09) | 3895 | 368 | 438 (0.17) | 4343 | 394 | 522 (0.51) | 6224 | 2.10 | 397 | 562 (0.47) | 7395 | 3.01 | 357 | 416 (0.12) | 3973 |
Furthermore, the Stokes shift values for dyes 3c and 3d were found to be 3894 and 2744 cm−1, respectively, in toluene and were raised by a factor of 2350 and 4651 cm−1, respectively, in DMSO and evidently reflected the increased ICT character in STHDPs. However, a systematic trend in this regard was not followed for compounds 3a, 3b and 3e. According to a Lippert–Mataga plot, the relationship between the Stokes shifts versus orientation polarizabilities gives a good linear relationship and was obeyed for dyes 3c and 3d as given in ESI Fig. 3 and 4.† Moreover, these dyes showed moderate ΦF in non-polar toluene, and this was significantly enhanced by increasing the solvent polarity. The lifetime of the compounds 3c and 3d was found to increase with the solvent polarity. Pronounced enhancement in fluorescence lifetime was observed in polar solvents and this observation was in line with ΦF measurements. The corresponding change in fluorescence lifetime data with respect to solvent polarity for compounds 3c and 3d is summarized in Table 2. This feature can be ascribed to emission arising from the charge transferred state.
Aggregation induced emission
To investigate the AIE properties of the dyes, we employed different ratios of THF–water mixtures. Only the emission spectra of 3c in THF and THF–water mixture solutions gave positive results. As shown in Fig. 5, maximum emission intensity of dye 3c in THF was observed at 494 nm. This was red shifted by 10 nm and showed higher intensity upon using a water fraction of 10 vol% in which the dye is no longer fully dissolved but shows aggregation. This is due to an aggregation induced enhancement of the emission of 3c and was favoured in 10 vol% solution. On increasing the water fraction to 50 vol%, the emission intensity was slightly decreased and was red shifted by ∼24 nm. The red shifted emission maximum caused a change in emission colour from bluish green to green and then to greenish yellow (Fig. 5 inset). The AIE feature was also confirmed by the intense fluorescence image of the solid (see Fig. 3) and the corresponding solid state ΦF of sensor 3c was determined as 55%, confirming its great prospects in solid-state lighting applications (vide infra).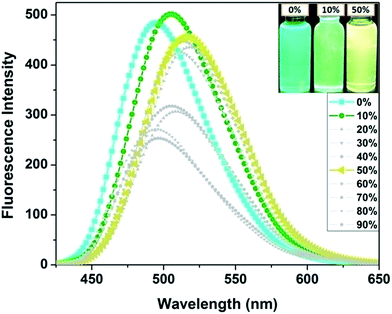 | ||
| Fig. 5 Aggregation induced emission spectra of 3c measured in different ratios of THF–water (v/v) mixtures, inset: photograph of 3c solutions with different water fractions under UV light (365 nm). | ||
Halochromism
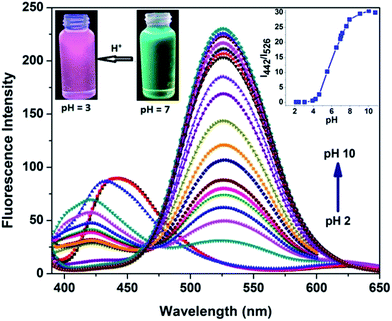
In order to study the optical response of dyes towards different pH levels, standard pH titrations were conducted in a 0.1 M potassium phosphate buffer (containing 50% ethanol as co-solvent) and it was found that dye 3c displayed a significant response towards different pH levels as shown in Fig. 6. On decreasing the pH from 10.75 to 2.16, the emission spectra of 3c exhibited a blue shift of 84 nm from 526 to 442 nm with gradual decrease in intensity along with growth of a red shifted very weak peak at 625 nm. The enhanced ICT effect is responsible for weak red shifted band around 626 nm and is due to H+ binding induced enhancement of the electron-withdrawing ability of pyridine in STHDP. The pronounced hypsochromic shift in emission spectra upon decreasing pH was due to H+ binding to the dialkyl amino group, providing a good platform to achieve ratiometric response towards various pH levels. Further, the emission ratio (I526![[thin space (1/6-em)]](https://www.rsc.org/images/entities/char_2009.gif) :
:![[thin space (1/6-em)]](https://www.rsc.org/images/entities/char_2009.gif) I442) changed progressively from 29.9 to 0.10 displaying a good linearity in the pH range of 4.1 to 6.8 (Fig. 6, inset right), testifying that sensor 3c could be used for the quantitative determination of pH within the acidic window. The pKa value of 3c was calculated to be 4.52 from analysis of the emission ratio as a function of pH and was close to the pKa value of 4.58 obtained using a pH meter. The significant large blue shift in the emission with decreasing pH caused an obvious variation in the emission colour of sensor 3c from green to magenta (Fig. 6, inset left).
I442) changed progressively from 29.9 to 0.10 displaying a good linearity in the pH range of 4.1 to 6.8 (Fig. 6, inset right), testifying that sensor 3c could be used for the quantitative determination of pH within the acidic window. The pKa value of 3c was calculated to be 4.52 from analysis of the emission ratio as a function of pH and was close to the pKa value of 4.58 obtained using a pH meter. The significant large blue shift in the emission with decreasing pH caused an obvious variation in the emission colour of sensor 3c from green to magenta (Fig. 6, inset left).
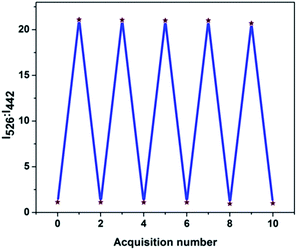
Similar to the changes in the emission spectra, decreasing the pH levels also caused a hyperchromic shift in intensity from 370 to 377 nm in absorption spectra, as outlined in ESI Fig. 7.† This resulted in detectable naked eye colour changes of the solution from pale yellow to orange. In order to check the reversibility of pH-dependent emission ratio changes; the pH of the solution was adjusted between the values of 6.9 and 4.2 by using concentrated hydrochloric acid and aqueous sodium hydroxide (10 M) and the respective changes are illustrated in Fig. 7. The sensor 3c responded to the variation in pH rapidly and also the emission ratios changed distinctly within a few seconds and these processes were fully reversible. Thus the sensors can be used to monitor the pH variation in real time applications and are stable in the assay conditions for monitoring pH fluctuations. Therefore, the sensors can also serve as “naked-eye” fluorescence indicators for acidic pH.
Acidochromism
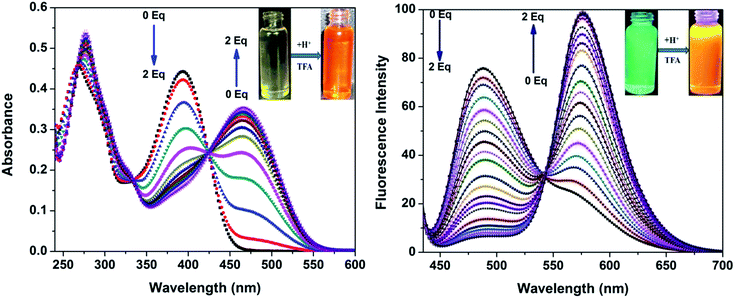
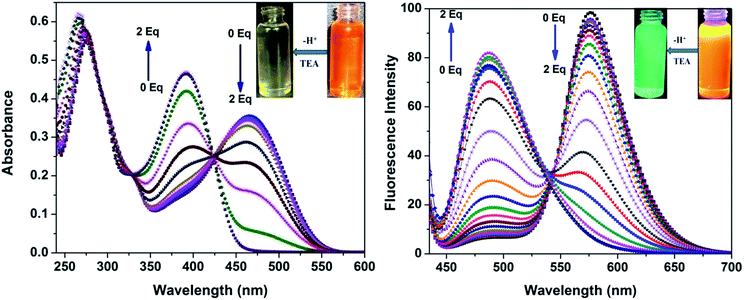
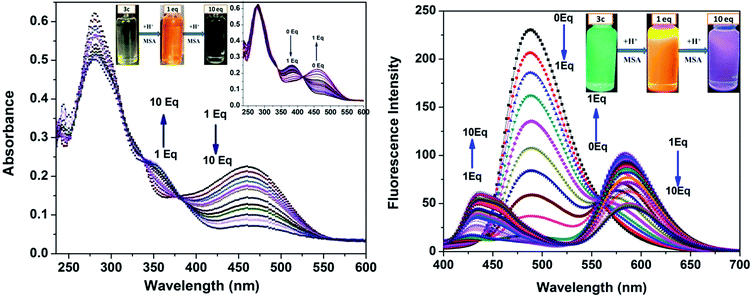
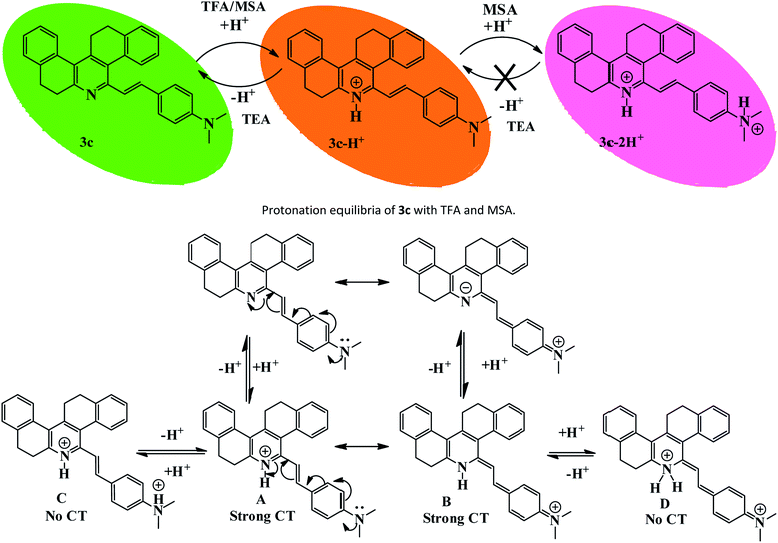
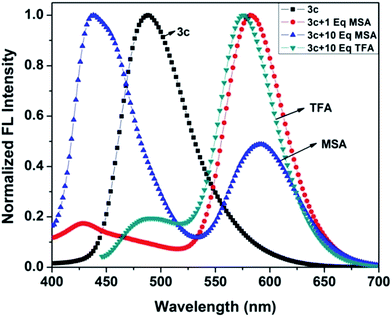
In our previous study, we demonstrated the ability of related 5-aryl THDPs to function as colorimetric and fluorescence H+ sensors due to the basic character of the nitrogen atom18 of the phenanthridine ring. In the current study we decided to evaluate the effect of extended-π-conjugation on the protonation properties of the prepared dyes. The absorption and emission spectra of dye 3c in chloroform solvent underwent significant spectral changes in the presence of trifluoroacetic acid (TFA) and the corresponding spectra are shown in Fig. 8. The gradual increase in the concentration of TFA led to the progressive attenuation of the absorption band for the neutral compound and the appearance of a new, more intense red-shifted band corresponding to the protonated species. The higher wavelength band at 393 nm was progressively changed to a 76 nm red shifted band at 469 nm with a colour change from pale yellow to orange. Similarly, the emission band at 488 nm was progressively decreased and the appearance of a new, more intense band with a 88 nm bathochromic shifted peak at 576 nm was observed. The protonation was completed on addition of 1 equiv. of TFA, and the addition of higher equivalents of TFA had no considerable impact on the absorbance and emission spectrum. Additionally, the emission colour of 3c changed from green to orange as shown in Fig. 8 (inset). This bathochromic shift in absorption and emission spectra can be explained by an increased charge transfer from the donor to the pyridine moiety. Clearly, the formation of a pyridinium ion triggered a facile intramolecular charge transfer between the amine donor and the phenanthridine acceptor segment, and these changes were completely reversible on neutralization with bases such as triethylamine (TEA). Representative absorption and emission spectral changes of 3c upon the gradual addition of TEA is shown in Fig. 9. The neutralization was completed on addition of 1 equiv. of TEA and the spectral pattern and colour of dye 3c was regenerated. In contrast, this behaviour is different for dyes 3a and 3d (see ESI for spectra of the other compounds, ESI Fig. 8–10†), for which a decrease in fluorescence intensity with TFA was observed, these changes being reversible for 3d but irreversible for dye 3a upon addition of TEA. This clearly suggests that, probably due to the protonation of the pyridine ring, it generated an electron poor pyridinium ion facilitated by more strongly basic dimethylamino group in 3c leading to an increased fluorescence ratiometric response. Whereas in dye 3d, protonation of the pyridine ring diminished ICT from the nitro acceptor to the phenanthridine moiety and thus decreased the emission response.A similar trend in protonation was observed with methanesulfonic acid (MSA) at lower concentrations. The protonation was completed on addition of 1.0 equiv. of MSA, which was completely reversible with 1.0 equiv. of TEA (see the reversible absorbance profile with TFA in ESI Fig. 11, ESI†) and colour changes follow a similar pattern to TFA (see the emission and reversible emission profile in ESI Fig. 12 and 13, ESI†). However, the gradual addition of MSA at higher equivalents had a distinct impact on both absorption and emission spectra, and the changes are shown in Fig. 10. Addition of 10 equiv. of MSA progressively decreased the absorbance band at 469 nm and a new band appeared at 356 nm with a 113 nm blue shift followed by colour change of the sensor 3c in solution from orange to colourless (Fig. 10, inset left). Furthermore, these changes were irreversible as shown on addition of TEA, suggesting secondary protonation of the dimethylamino group (Scheme 2, 3c-2H+). As shown in Fig. 10, the emission at 576 nm progressively decreased and a new band at 436 nm with a hypscochromic shift of 140 nm (see the emission profile at higher concentrations of MSA in ESI Fig. 14†) was observed. Following that, the emission colour of the sensor changed from orange to magenta (Fig. 9, inset right). Similar to the absorption profiles, the emission changes were also irreversible with the addition of TEA which strongly suggests the formation of secondary protonated species by rearrangement. With these spectral changes, we can differentiate sulfonic acid from carboxylic acids using sensor 3c by both colorimetric and ratiometric responses. Therefore, the sensor 3c can also serve as a “naked-eye” and ratiometric indicator for sulfonic acid discrimination from carboxylic acids. Attempts have been made to evaluate the selectivity of sensor 3c among various acids. Competitive experiments were performed with 10 equiv. of various other acids (ESI Fig. 15†) in chloroform solution. As can be seen, due to the fact that sulfonic acids are much stronger organic acids than carboxylic acids, the carboxylic acids did not cause any substantial colorimetric or ratiometric changes to sensor 3c, neither in the absorption nor in the emission spectra compared to the spectral changes with sulfonic acid. These results not only proved the excellent selectivity of the sensor 3c for selective discrimination of sulfonic acids (Fig. 11) but also showed its high potential utility for practical applications.
Prototropic equilibria with acids and protonation–deprotonation equilibria of compound 3c with TFA are shown in Scheme 2. The observed bathochromic shift of absorption and emission maxima of 3c can be explained by the initial protonation of pyridine ring leading to increased donor–acceptor reversible exchange between the dimethylamino functionality and the phenanthridine ion (Scheme 2, 3c-H+, A and B). Further, the addition of TFA (10 equiv.) caused no significant change in absorption or emission maxima due to the weak acidic strength of TFA (even though it is a more strongly acidic carboxylic acids with pKa value of 0.23). However, with 10 equiv. of MSA, the sensor was protonated at the dimethylamine functionality which led to the disorganization of donor–acceptor system (3c-2H+, C and D), and was irreversible. This could be explained based on the pKa strength of acids where the second protonation occurred only in the presence of a strong acid such as sulfonic acid (pKa = −1.92) which consequently disrupted the protonated ICT equilibrium and hence a hypscochromic shift in absorption and emission maxima was observed.
Applications
| Solvent | DL/μm | QL/μm |
|---|---|---|
| a Harima et al.19 designed and developed an anthracene–boronic acid ester as a new class of fluorescence PET sensors for the detection of a trace amount of water in organic solvents. A ratiometric enhancement in fluorescence intensity was observed with increasing acid content in various organic solvents. Hence, we employed dye 3c as ratiometric sensor for the detection of acid content in solvents. | ||
| Toluene | 3.68 | 11.15 |
| CHCl3 | 2.91 | 8.83 |
| Ethyl acetate | 4.16 | 11.98 |
| DCM | 2.39 | 7.25 |
| DCE | 2.45 | 7.89 |
| Acetone | 9.71 | 17.78 |
| MeOH | 8.19 | 24.84 |
| ACN | 5.25 | 9.59 |
| DMSO | 14.13 | 27.47 |
Conclusions
In summary, we have developed styryl tetrahydrodibenzophenanthridines starting from 2-tetralone and cinnamaldehydes with suitable donor and acceptor groups. The styryl phenanthridines displayed rich optical properties in the ground and excited states. The impact of the nature of the styryl segment on the optical properties was substantial; the emission spectra showed maxima in the range of 416–552 nm with good quantum yields. The dye 3d shows a more red shifted yellow emission at 552 nm compared to the others, with a large Stokes shift value of 7265 cm−1. Although the absorption spectra of the dyes were not influenced by the nature of the solvent, the emission spectra of the dyes showed distinct positive solvatochromism, suggestive of a more polarized excited state stabilized by polar solvents. The dye 3c showed an aggregation-induced emission (AIE) property, and it was efficiently fluorescent when induced by molecular aggregation in 10% THF–water mixture. With decreasing pH levels, the spectral pattern of the sensor 3c exhibited significant shifts with varying pH levels and the emission intensity ratio showed a good linearity in the pH range of 4.1 to 6.8. Thus, the quantitative determination of pH in the acidic pH window could be achieved using this sensor. Using this phenomenon the pH of biological fluid can be determined successfully. H+ binding with the N-atom of pyridine induced enhancement of the ICT process which was responsible for the ratiometric response of the sensor to acidic pH. Further, the addition of TFA led to the protonation of the phenanthridine segment, which could be reversed by the addition of a base such as TEA, so leading to acidochromism. The red-shifted spectra could be attributed to the protonation of the pyridine segment that generates a strongly electron-withdrawing phenanthrinium segment consequently triggering a facile intramolecular charge transfer process. Based on the pKa strength of acids, a second protonation at the dialkylamino functionality of phenanthrinium segment may occur. In the presence of strong acids with pKa < −1.0 such as sulfonic acid (pKa = −1.92), the protonated ICT equilibrium is disrupted and a blue shift in absorption and emission maximum was observed. A ratiometric enhancement in fluorescence was observed with increasing acid content in various organic solvents which could be attributed to the formation of a fluorescent ionic structure on protonation. The DL and QL of dye 3c in various solvents were measured and can be used for the detection of acid impurities in solvents.Experimental section
General information
All organic chemicals and solvents were purchased from Sigma Aldrich, TCI, SD Fine, AVRA and were used without further purification. 1H and 13C NMR spectra were taken on Bruker 400 MHz using CDCl3 as the solvent with TMS as an internal standard. Melting points were measured on Microprocessor based melting point apparatus and were not corrected. HRMS values were obtained on a Joel GC Mate II GC-Mass Spectrometer. FTIR spectra of the synthesized organic compounds were recorded using a Jasco-4100 spectrometer instrument. UV-visible spectra were taken using Hitachi U-2910 spectrophotometer. Fluorescence spectra in solution and in the solid state were measured using a Hitachi F-7000 fluorescence spectrometer. The fluorescence quantum yields (ΦF) were measured with quinine sulfate (ΦF) 0.55 in 0.5 M H2SO4 solution as a standard, λex = 366 nm. Analytical thin-layer chromatography (TLC) was performed on pre-coated plates (Merck, silica gel 60 F254). Silica gel (60–120 mesh) was used for column chromatography. Single-crystal X-ray diffraction data were taken on a Bruker kappa APEXII diffractometer. The structures were solved by direct methods. Fluorescence lifetimes of compounds were measured by the time correlated single photon counting method. The fluorescence decay curves were measured by exciting the molecules at 375 nm, in <200 ps light using Nano LED. The cyclic voltammetry experiments were performed using glassy carbon as working electrode, platinum wire as counter electrode and Ag/AgCl as reference electrode. 0.1 M tetrabutylammonium perchlorate was used as a supporting electrolyte. The pH measurements were recorded by ELICO LI120 pH digital meter.General procedure
![[thin space (1/6-em)]](https://www.rsc.org/images/entities/char_2009.gif) :
:![[thin space (1/6-em)]](https://www.rsc.org/images/entities/char_2009.gif) 1) as eluent to give the compounds (3a–e). Thus obtained solid was further purified by recrystallization from ethanol–tetrahydrofuran (1
1) as eluent to give the compounds (3a–e). Thus obtained solid was further purified by recrystallization from ethanol–tetrahydrofuran (1![[thin space (1/6-em)]](https://www.rsc.org/images/entities/char_2009.gif) :
:![[thin space (1/6-em)]](https://www.rsc.org/images/entities/char_2009.gif) 1).
1).Acknowledgements
Umamahesh B. thanks CSIR for providing a Senior Research Fellowship. The authors duly acknowledge DST-FIST NMR facility at VIT University and VIT management. The authors thank Dr R. Srinivasan, SSL-VIT for language editing.References
- (a) Y. Lin, Y. Li and X. Zhan, Chem. Soc. Rev., 2012, 41, 4245–4272 RSC; (b) M. Stolar and T. Baumgartner, Phys. Chem. Chem. Phys., 2013, 15, 9007–9024 RSC; (c) X. Hou, Y. Xia, S. C. Ng, J. Zhang and J. S. Chang, RSC Adv., 2014, 4, 37687–37690 RSC; (d) A. C. Arias, J. D. MacKenzie, I. McCulloch, J. Rivnay and A. Salleo, Chem. Rev., 2010, 110, 3–24 CrossRef CAS PubMed; (e) H. Chen, M. Josowicz, J. Janata and K. P. Kamloth, Chem. Mater., 2004, 16, 4728–4735 CrossRef CAS; (f) L. Sun, A. Yuri, D. Fernandez, A. Tina, A. Gschneidtner, F. Westerlund, S. L. Avilab and K. M. Poulsen, Chem. Soc. Rev., 2014, 43, 73–78 CAS; (g) A. Facchetti, Angew. Chem., Int. Ed., 2007, 46, 1367–1368 CrossRef CAS; (h) J. Sun, B. Zhang and E. K. Howard, Adv. Funct. Mater., 2011, 21, 29–45 CrossRef CAS.
- (a) A. Goel, S. Chaurasia, M. Dixit, V. Kumar, S. Prakash, J. K. Jai, V. M. Jain and R. S. Anand, Org. Lett., 2009, 11, 1289–1292 CrossRef CAS PubMed; (b) H. Uoyama, K. Goushi, K. Shizu, H. Nomura and C. Adachi, Nature, 2012, 492, 234–238 CrossRef CAS PubMed; (c) Y. Hong, J. Y. Liao, D. Cao, X. Zang, D. B. Kuang, L. Wang, H. Meier and C. Y. Su, J. Org. Chem., 2011, 76, 8015–8021 CrossRef CAS PubMed; (d) D. Yang, Q. Yang, L. Yang, Q. Luo, Y. Huang, Z. Lu and S. Zhao, Chem. Commun., 2013, 49, 10465–10467 RSC; (e) R. Capelli, F. Dinelli, M. Gazzano, R. D. Alpaos, A. Stefani, G. Generali, M. Riva, M. Montecchi, A. Giglia and L. Pasquali, Adv. Funct. Mater., 2014, 24, 5603–5613 CrossRef CAS; (f) H. Liu, Q. Bai, L. Yao, H. Zhang, H. Xu, S. Zhang, W. Li, Y. Gao, J. Li, P. Lu, H. Wang, B. Yang and Y. Ma, Chem. Sci., 2015, 6, 3797–3804 RSC; (g) C. Y. Jung, C. Y. Song, W. Yao, J. M. Park, I. H. Hyun, D. H. Seong and J. Y. Jaung, Dyes Pigm., 2015, 121, 204–210 CrossRef CAS.
- (a) W. Bentoumi, J. C. Mulatier, P. A. Bouit, O. Maury, A. Barsella, J. P. Vola, E. Chastaing, L. Divay, F. Soyer, P. L. Barny, Y. Bretonnière and C. Andraud, Chem.–Eur. J., 2014, 20, 8909–8913 CAS; (b) F. Dumur, R. C. Mayer, E. Dumas, F. Miomandre, M. Frigoli and F. S. Cheresse, Org. Lett., 2008, 10, 321–324 CrossRef CAS PubMed; (c) R. Andreu, E. Galán, J. Garín, J. Orduna, R. Alicante and B. Villacampa, Tetrahedron Lett., 2010, 51, 6863–6866 CrossRef CAS.
- (a) H. Tanaka, K. Shizu, H. Nakanotani and C. Adachi, Chem. Mater., 2013, 25, 3766–3771 CrossRef CAS; (b) T. Yoshihara, S. I. Druzhinin and K. A. Zachariasse, J. Am. Chem. Soc., 2004, 126, 8535–8539 CrossRef CAS PubMed; (c) M. Aydemir, G. Haykır, F. Türksoy, S. Gümüş, F. B. Dias and A. P. Monkman, Phys. Chem. Chem. Phys., 2015, 17, 25572–25582 RSC; (d) M. Scarongella, A. Laktionov, U. Rothlisberger and N. Banerji, J. Mater. Chem. C, 2013, 1, 2308–2319 RSC; (e) G. Kwak, S. Wang, M. S. Choi, H. Kim, K. H. Choi, Y. S. Han, Y. Hur and S. H. Kim, Dyes Pigm., 2008, 78, 25–33 CrossRef CAS; (f) S. Wang, X. Yan, Z. Cheng, H. Zhang, Y. Liu and Y. Wang, Angew. Chem., Int. Ed., 2015, 54, 13068–13072 CrossRef CAS PubMed; (g) F. Odobel, M. Séverac, Y. Pellegrin, E. Blart, C. Fosse, C. Cannizzo, C. R. Mayer, K. J. Elliott and A. Harriman, Chem.–Eur. J., 2009, 15, 3130–3138 CrossRef CAS PubMed.
- (a) P. F. Wang, Z. Y. Xie, Z. R. Hong, J. X. Tang, O. Y. Wong, C. S. Lee, N. B. Wong and S. T. Lee, J. Mater. Chem., 2003, 13, 1894–1899 RSC; (b) J. Chen, W. Liu, J. Ma, H. Xu, J. Wu, X. Tang, Z. Fan and P. J. Wang, J. Org. Chem., 2012, 77, 3475–3482 CrossRef CAS PubMed; (c) P. F. Wang, Z. Y. Xie, O. Y. Wong, C. S. Lee, N. B. Wong, L. S. Hung and S. T. Lee, Chem. Commun., 2002, 1404–1405 RSC; (d) M. Kim, D. R. Whang, J. Gierschner and S. Y. Park, J. Mater. Chem. C, 2015, 3, 231–234 RSC.
- (a) X. J. Feng, P. Z. Tian, Z. Xu, S. F. Chen and M. S. Wong, J. Org. Chem., 2013, 78, 11318–11325 CrossRef CAS PubMed; (b) A. Souibgui, A. Gaucher, J. Marrot, F. Aloui, F. M. Betzer, B. B. Hassine and D. A. Prim, Eur. J. Org. Chem., 2013, 4515–4522 CrossRef CAS; (c) Y. Q. He and Y. W. Zhong, Chem. Commun., 2015, 51, 3411–3414 RSC.
- (a) J. Gierschner and S. Y. Park, J. Mater. Chem. B, 2013, 1, 5818–5832 RSC; (b) Y. Ren and T. Baumgartner, Dalton Trans., 2012, 41, 7792–7800 RSC; (c) L. Moni, M. Denißen, G. Valentini, T. J. J. Müller and R. Riva, Chem.–Eur. J., 2015, 21, 753–762 CrossRef CAS PubMed; (d) P. J. Raj and D. Bahulayan, Tetrahedron Lett., 2015, 56, 2452–2455 Search PubMed.
- (a) Y. S. Park, D. Kim, H. Lee and B. Moon, Org. Lett., 2006, 8, 4699–4702 CrossRef CAS PubMed; (b) T. Mitsumori, M. Bendikov, J. Sedó and F. Wudl, Chem. Mater., 2003, 15, 3759–3768 CrossRef CAS; (c) S. Achelle, I. Nouira, B. Pfaffinger, Y. Ramondenc, N. Ple and J. R. Lopez, J. Org. Chem., 2009, 74, 3711–3717 CrossRef CAS PubMed; (d) B. Umamahesh and K. I. Sathiyanarayanan, Dyes Pigm., 2015, 121, 88–98 CrossRef; (e) S. Easwaramoorthi, B. Umamahesh, P. Cheranmadevi, R. S. Rathore and K. I. Sathiyanarayanan, RSC Adv., 2013, 3, 1243–1254 RSC; (f) J. Zhao, J. Wong, C. Wang, J. Gao, V. Z. Yun Ng, H. Ying Yang, S. C. Joachim Loo and Q. Zhang, Chem.–Asian J., 2013, 8, 665–669 CrossRef CAS PubMed; (g) S. Aftergut and G. P. Brown, Nature, 1961, 189, 827–828 CrossRef CAS; (h) S. Achelle, J. R. Lopez and F. R. Guen, J. Org. Chem., 2014, 79, 7564–7571 CrossRef CAS PubMed; (i) M. S. Schiedel, C. A. Briehn and P. Bäuerle, Angew. Chem., Int. Ed., 2001, 40, 4677–4680 CrossRef CAS; (j) M. Chen, L. Li, H. Nie, J. Tong, L. Yan, B. Xu, J. Z. Sun, W. Tian, Z. Zhao, A. Qin and B. Z. Tang, Chem. Sci., 2015, 6, 1932–1937 RSC; (k) B. Umamahesh and K. I. Sathiyanarayanan, Eur. J. Org. Chem., 2015, 5089–5098 Search PubMed.
- (a) H. Li, C. Wang, M. She, Y. Zhu, J. Zhang, Z. Yang, P. Liu, Y. Wang and J. Li, Anal. Chim. Acta, 2015, 900, 97–102 CrossRef CAS PubMed; (b) E. Kim, S. Lee and S. Park, Chem. Commun., 2011, 47, 7734–7736 RSC; (c) J. Han and K. Burgess, Chem. Rev., 2010, 110, 2709–2728 CrossRef CAS PubMed; (d) M. Yang, Y. Song, M. Zhang, S. Lin, Z. Hao, Y. Liang, D. Zhang and R. Peng, Angew. Chem., Int. Ed., 2012, 51, 7674–7679 CrossRef CAS PubMed; (e) Z. Yang, J. Cao, Y. He, J. H. Yang, T. Kim, X. Peng and J. S. Kim, Chem. Soc. Rev., 2014, 43, 4563–4601 RSC; (f) F. Miao, G. Song, Y. Sun, Y. Liu, F. Guo, W. Z. Ang, M. Tian and X. Yu, Biosens. Bioelectron., 2013, 50, 42–49 CrossRef CAS PubMed; (g) E. L. Que, D. W. Domaille and C. J. Chang, Chem. Rev., 2008, 108, 1517–1549 CrossRef CAS PubMed; (h) D. W. Domaille, E. L. Que and C. J. Chang, Chem. Biol., 2008, 4, 168–175 CAS; (i) R. T. Kennedy, L. Huang and C. A. Aspenwall, J. Am. Chem. Soc., 1996, 118, 1795–1796 CrossRef CAS; (j) K. R. Hoyt and I. J. Reynolds, J. Neurochem., 2002, 71, 1051–1058 CrossRef; (k) A. J. Janecki, M. H. Montrose, P. Zimniak, A. Zweibaum, C. M. Tse, S. Khurana and M. J. Donowitz, J. Biol. Chem., 1998, 273, 8790–8798 CrossRef CAS PubMed.
- (a) J. F. Hunt, K. Fang, R. Malik, A. Snyder, N. Malhotra, T. A. E. Platts-mills and B. Gaston, Am. J. Respir. Crit. Care Med., 2000, 161, 694–699 CrossRef CAS PubMed; (b) J. Chiche, K. Ilc, J. Laferrière, E. Trottier, F. Dayan, N. M. Mazure, M. C. Brahimi-Horn and J. Pouysse, Cancer Res., 2009, 69, 358–368 CrossRef CAS PubMed; (c) A. Rivinoja, N. Kokkonen, I. Kellokumpu and S. J. Kellokumpu, J. Cell. Physiol., 2006, 208, 167–174 CrossRef CAS PubMed; (d) J. Poschet, E. Perkett and V. Deretic, Trends Mol. Med., 2002, 8, 512–519 CrossRef CAS PubMed.
- (a) D. A. Russell, R. H. Pottier and D. P. Valenzeno, Photochem. Photobiol., 1994, 59, 309–313 CrossRef CAS PubMed; (b) M. G. Cogan, Fluid and Electrolytes, Appleton and Lange-Prentice Hall Publishers, Norwalk, CT, USA, 1991 Search PubMed; (c) L. Ferrari, L. Rovati, P. Fabbri and F. Pilati, Sensors, 2012, 13, 484–499 CrossRef PubMed; (d) H. S. Mogensen, D. M. Beatty, S. J. Morris and O. S. Jorgensen, NeuroReport, 1998, 9, 1553–1559 CrossRef CAS PubMed; (e) T. A. Davies, R. E. Fine, R. J. Johnson, C. A. Levesque, W. H. Rathbun, K. F. Seetoo, S. J. Smith, G. Strohmeier, L. Volicer and L. Delva, Biochem. Biophys. Res. Commun., 1993, 194, 537–543 CrossRef CAS PubMed.
- (a) V. S. Patil, V. S. Padalkar, K. R. Phatangare, V. D. Gupta, P. G. Umape and N. Sekar, J. Phys. Chem. A, 2012, 116, 536–545 CrossRef CAS PubMed; (b) S. Kappaun, T. Sovic, F. Stelzer, A. Pogantsch, E. Zojer and C. Slugovc, Org. Biomol. Chem., 2006, 4, 1503–1511 RSC; (c) P. Singh, A. Baheti and K. R. J. Thomas, J. Org. Chem., 2011, 76, 6134–6145 CrossRef CAS PubMed; (d) D. Aigner, B. Ungerbock, T. Mayr, R. Saf, I. Klimanta and M. S. Borisov, J. Mater. Chem. C, 2013, 1, 5685–5693 RSC; (e) B. Hu, X. Chen, Y. Wang, P. Lu and Y. Wang, Chem.–Asian J., 2013, 8, 1144–1151 CrossRef CAS PubMed; (f) S. Achelle, J. R. Lopez, F. Bures and F. R. Guen, Dyes Pigm., 2015, 121, 305–311 CrossRef CAS; (g) L. E. Santos-Figueroa, M. E. Moragues, E. Climent, A. Agostini, R. Martínez-Máñez and F. Sancenón, Chem. Soc. Rev., 2013, 42, 3489–3613 RSC; (h) F. Qu, N. B. Li and H. Q. Luo, Langmuir, 2013, 29, 1199–1205 CrossRef CAS PubMed; (i) H. F. Higginbotham, R. P. Cox, S. Sandanayake, B. A. Graystone, S. J. Langford and T. D. M. Bell, Chem. Commun., 2013, 49, 5061–5063 RSC; (j) B. He, J. Dai, D. Zherebetskyy, L. T. Chen, A. B. Zhang, J. S. Teat, Q. Zhang, L. Wang and Y. Liu, Chem. Sci., 2015, 6, 3180–3186 RSC; (k) M. Tian, X. Peng, J. Fan, J. Wang and S. Sun, Dyes Pigm., 2012, 95, 112–115 CrossRef CAS; (l) V. H. Huynh, X. He and T. Baumgartner, Chem. Commun., 2013, 49, 4899–4901 RSC.
- (a) J. María Marín, F. Galindo, P. Thomas and A. D. Russell, Angew. Chem., Int. Ed., 2012, 51, 9657–9661 CrossRef PubMed; (b) D. L. Longo, P. Z. Sun, L. Consolino, F. C. Michelotti, F. Uggeri and S. A. Aime, J. Am. Chem. Soc., 2014, 136, 14333–14336 CrossRef CAS PubMed; (c) L. Long, X. Li, D. Zhang, S. Meng, J. Zhang, X. Sun, C. Zhang, L. Zhou and L. Wang, RSC Adv., 2013, 3, 12204–12209 RSC; (d) T. Myochin, K. Kiyose, K. Hanaoka, H. Kojima, T. Terai and T. Nagano, J. Am. Chem. Soc., 2014, 136, 14333–14336 CrossRef PubMed; (e) J. Ma, C. Ding, J. Zhou and Y. Tian, Biosens. Bioelectron., 2015, 70, 202–208 CrossRef CAS PubMed; (f) J. Han and K. Burgess, Chem. Rev., 2010, 110, 2709–2728 CrossRef CAS PubMed; (g) Y. I. Park, O. Postupna, A. Zhugayevych, H. Shin, Y. S. Park, B. Kim, H. J. Yen, P. Cheruku, J. S. Martinez, J. W. Park, S. Tretiak and H. L. Wang, Chem. Sci., 2015, 6, 789–805 RSC.
- N. S. Karthikeyan, K. Sathiyanarayanan and P. G. Aravindan, Bull. Korean Chem. Soc., 2009, 30, 2555–2557 CrossRef CAS.
- (a) C. Hadad, S. Achelle, J. C. García-Martinez and J. Rodríguez-Lopez, J. Org. Chem., 2011, 76, 3837–3845 CrossRef CAS PubMed; (b) X. J. Feng, P. Z. Tian, Z. Xu, S. F. Chn and M. S. Wong, J. Org. Chem., 2013, 78, 11318–11325 CrossRef CAS PubMed; (c) A. Bergen, A. Granzhan and H. Ihmels, Photochem. Photobiol. Sci., 2008, 7, 405–407 RSC; (d) X. Peng, Y. Xu, S. Sun, Y. Wu and J. Fan, Org. Biomol. Chem., 2007, 5, 226–228 RSC; (e) S. Michael and P. Doz, Angew. Chem., Int. Ed., 2012, 51, 3532–3554 CrossRef PubMed.
- K. Sathiyanarayanan, N. S. Karthikeyan, P. G. Aravindan, S. Shanthi, R. S. Rathore and C. W. Lee, J. Heterocycl. Chem., 2009, 46, 1142–1144 CrossRef CAS.
- R. S. Rathore, N. S. Karthikeyan, K. Sathiyanarayanan and P. G. Aravindan, J. Mol. Struct., 2010, 963, 45–49 CrossRef CAS.
- B. Umamahesh, U. Sathiskumar, S. Easwaramoorthi and K. I. Sathiyanarayanan, Dyes Pigm., 2016, 130, 233–244 CrossRef.
- (a) O. Yousuke, M. Ai, O. Kazuyuki, N. Tomoya, S. Minako, K. Kenji, I. Ichiro and H. Yutaka, Chem. Commun., 2011, 47, 4448–4450 RSC; (b) O. Yousuke, M. Ai, N. Tomoya, O. Kazuyuki, K. Kohei, K. Kenji, I. Ichiro and H. Yutaka, J. Photochem. Photobiol., A, 2011, 222, 52–55 CrossRef; (c) Y. Ooyama, A. Matsugasako, Y. Hagiwara, J. Ohshita and Y. Harima, RSC Adv., 2012, 2, 7666–7668 RSC; (d) Y. Ooyama, K. Uenaka, A. Matsugasako, Y. Hagiwara and J. Ohshita, RSC Adv., 2013, 3, 23255–23263 RSC; (e) Y. Ooyama, M. Sumomogi, T. Nagano, K. Kushimoto, K. Komaguchi, I. Imae and Y. Harima, Org. Biomol. Chem., 2011, 9, 1314–1316 RSC.
Footnote |
| † Electronic supplementary information (ESI) available: 1H and 13C NMR spectra for all compounds and optical data and possible mechanism; CIF data for compound 4d. CCDC 1453322. For ESI and crystallographic data in CIF or other electronic format see DOI: 10.1039/c6ra09359k |
| This journal is © The Royal Society of Chemistry 2016 |

