Dual role of hydrogen peroxide on the oxidase-like activity of nanoceria and its application for colorimetric hydrogen peroxide and glucose sensing†
Ruochen Guo‡
,
Yanru Wang‡,
Shaoxuan Yu,
Wenxin Zhu,
Fangqing Zheng,
Wei Liu,
Daohong Zhang and
Jianlong Wang*
College of Food Science and Engineering, Northwest A&F University, Yangling, 712100, Shaanxi, China. E-mail: wanglong79@yahoo.com; Fax: +86 29 87092275; Tel: +86 29 87092275
First published on 15th June 2016
Abstract
Nanoceria (cerium oxide nanoparticles) exhibits excellent catalytic activity towards chromogenic substrate 3,3,5,5-tetramethylbenzidine (TMB) in the presence of hydrogen peroxide (H2O2), which has been reported. However, the understanding of the interaction between H2O2 and nanoceria is far from comprehensive. Herein, we further studied the interaction between H2O2 and dextran-coated nanoceria and found that H2O2 plays a dual role in nanoceria's oxidase activity both as an inhibitor and a promoter, depending on its concentration. At millimolar levels, H2O2 can promote nanoceria's oxidase activity; however, micromolar concentrations of H2O2 can inhibit its catalytic activity. In addition, this inhibiting effect is linearly dependent on the concentration of H2O2. Based on these findings, a simple, rapid and highly sensitive colorimetric method was established for the determination of H2O2 with a limit of detection (LOD) of 2.5 μM (3σ/slope) and a linear range from 4−40 μM. When coupled with glucose oxidase, glucose can be detected down to 2 μM in the linear range of 4−40 μM. Furthermore, this method was successfully applied in the determination of glucose in mouse serum samples. With the new understanding of the interaction between H2O2 and nanoceria, applications of nanoceria-based sensors in engineering, biotechnology and environmental chemistry can be further exploited.
Introduction
Nanomaterials with enzyme-like characteristics, which can be termed as nanoenzymes, have attracted much attention in a wide range of applications. Over the past few decades, a number of nanomaterials with unexpected enzyme-like activity have been explored, including FeS nanosheets,1 graphene,2 carbon nanotubes, Au NPs,3 V2O5 nanowires,4 carbon nanodots,5 multicolor luminescent carbon nanoparticles,6 Co3O4 NPs,7 Pt nanotubes,8 carbon nitrides,9 and hematite–silica,10 etc. Natural enzymes have many disadvantages, such as ease of denaturation, sensitivity to environmental conditions and relatively high costs in preparation and purification, which limit their application.11 In comparison, nanoparticle-based artificial enzymes exhibit the properties of low cost of preparation, high stability, ease of storage and treatment,12 making them ideal alternatives in a wide range of applications.Cerium is a rare earth element of lanthanide series with a crystalline structure and can coexist in two oxidation states of Ce3+ and Ce4+. The catalytic performance that reversibly switches between Ce3+ and Ce4+ ions and the presence of oxygen vacancies are considered to play a critical role in many chemically catalytic activities and biological applications.13–16 It is interesting that nanoceria have a dual role as an oxidation catalyst as well as reduction catalyst, depending upon the reaction conditions.17 Nanoceria with a high Ce3+/Ce4+ ratio were reported to exhibit superoxide oxidase (SOD) mimetic activity in a redox-state dependent manner,18 while with lower Ce3+/Ce4+ ratios were found to exhibits catalase mimetic activity.19 Besides, the oxidase mimetic activity of nanoceria has also been revealed, which can catalyze the oxidation of chromogenic substrate (e.g. ABTS, DOP and TMB) without H2O2.20 In the presence of H2O2, nanoceria could also catalyze the reaction of peroxidase substrate TMB, which serves as peroxidase mimetics.21 The ability of cerium oxide to act as different enzyme activity makes it a promising material in biosensing. However, our fundamental understanding on these is still far from complete. There are still massive untapped potential of nanoceria in biosensing that need to be developed.
As one of the reactive oxygen species (ROS), hydrogen peroxide (H2O2), is an important by-product of oxygen metabolism in all aerobic organisms.22,23 Its level is usually used as a major biomarker of oxidative stress, which is thought to be involved in the development of diseases, including arteriosclerosis, cancer, diabetes, reperfusion and respiratory injury, etc.24 In addition, H2O2 is also involved in some enzymatic reactions catalyzed by horseradish peroxidase (HRP), superoxide dismutase (SOD) and catalase (CAT) etc. From these backgrounds, novel sensors and detection methods for quantitative determination of H2O2 concentration is crucial in biology, medicine, industry and many other fields.
In this work, dextran-coated nanoceria was prepared and characterized by TEM, XPS and UV-vis spectrography. We studied the interaction between H2O2 and nanoceria and surprisingly discovered H2O2's dual role on the catalytic activity of nanoceria. Above millimolar level, it could promote nanoceria's oxidase activity, however, under micromolar level, hydrogen peroxide oxidation of TMB by nanoceria is inhibited. Moreover, this effect is linearly dependent upon H2O2 concentration in a certain range. Based on these findings, we constructed a colorimetric method for H2O2. By fabricating with glucose oxidase (GOx), a glucose sensing platform was also developed (Scheme 1). The proposed method exhibits high selectivity and sensitivity for both H2O2 and glucose detection.
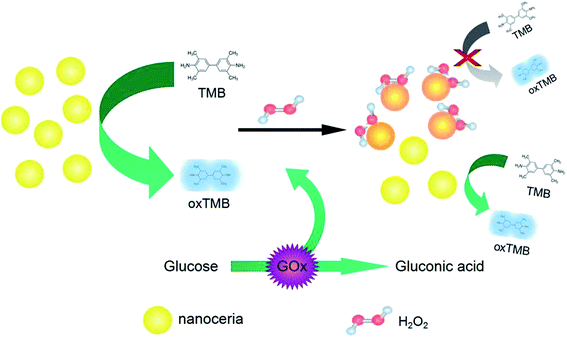 | ||
| Scheme 1 Schematic illustration of colorimetric sensor for glucose detection by using glucose oxidase (GOx) and nanoceria-catalyzed reactions. | ||
Materials and methods
Reagents and materials
Horseradish peroxidase (HRP), glucose oxidase (GOx), cerium(III) nitrate hexadrate (Ce(NO3)3·6H2O), 3,3,5,5-tetramethylbiphenyl dihydrochloride (TMB·2HCl) and glucose (HK) Assay Kit were purchased from Sigma-Aldrich. Dextran was purchased from Xiya Reagent. Hydrogen peroxide (30 wt%), acetic acid, hydrochloric acid, sodium acetate, sucrose and fructose were purchased from Sinopharm Group Chemical Reagent Co., Ltd. (Shanghai, China). Ammonium hydroxide (25–28 wt%, NH3·H2O), lactose, maltose and glucose were purchased from Guangdong Guanghua Sci-Tech Co., Ltd. (Guangdong, China). All reagents above were used without further purification and the ultrapure (UP) water (18.5 MΩ cm) was used in all experiments. Glasswares used in all procedures were soaked and cleaned in a bath of freshly prepared aqua regia, then rinsed thoroughly with ultrapure water, and dried in air prior to use.Synthesis and characterization of dextran-nanoceria
Dextran coated cerium oxide nanoparticles were prepared according to the Perez's method with some modifications.25 Briefly, cerium(III) nitrate (1 g) was dispersed in 15 mL deionized water and mixed with 0.05 M dextran. Under continuous stirring, 15.0 mL ammonium hydroxide solution was added to the mixture. After 12 h-stiring, the deep brown solution was centrifuged at 5000 rpm for 10 minutes to remove debris and large agglomerates. Finally, the supernatant was dialysed against water to obtain nanoceria.The size and morphology of nanoceria were characterized by transmission electron microscope (TEM, HT7700, Hitachi High-Tech, Japan). The sample was prepared by directly drying a drop of the pretreated nanoceria solution onto a carbon film coated copper grid. The micrographs were obtained at an accelerating voltage of 80 kV under TEM. X-ray photoelectron spectroscopy (XPS) was performed using an ESCALab 250 spectrometer (Thermo Scientific) with monochromatic Al Kα X-ray radiation (energy 1486.6 eV, 500 μm spot-size). The nanoceria sample was mounted on a carbon tape for analysis. A low energy electron gun was employed for the static charge compensation. The pass energy and step size were set at 150 and 1.0 eV for the survey scans and 20 and 0.1 eV for the narrow scans, separately. The absorbance value and spectra were monitored on a UV-2550 spectrometer (Shimadzu, Japan).
Mimetic oxidase activity and kinetic measurements
Oxidase-like activity of nanoceria was examined using TMB·2HCl as a chromogenic substrate. The experiments was carried out with 15 μL nanoceria (46 mg L−1) in 1 mL sodium acetate buffer (pH = 4), in the presence of 0.3 mM TMB·2HCl at room temperature. After 10 min-reaction, the color formation was monitored at 652 nm using a UV-2550 spectrometer. The influences of time, concentration of nanoparticles, pH and temperature on the relative activity of nanoceria were also measured.Kinetic measurements were carried out by recording the absorption spectra at 652 nm in scanning kinetics mode using a UV-2550 spectrometer. The experiments were performed using 46 mg L−1 nanoparticles in a reaction volume of 600 μL acetate buffer solution (pH = 4), in the presence of varied concentrations of TMB. The apparent kinetic parameters were calculated based on Michaelis–Menten equation: V = Vmax × [S]/(Km + [S]), where V is the initial velocity, Vmax is the maximal reaction velocity, [S] is the concentration of substrate and Km is the Michaelis constant.
Glucose detection
Glucose detection was performed as follows (a) various concentrations of glucose in 180 μL of Na2HPO4 buffer (pH 7.0, 0.5 mM) was incubated with 20 μL GOx (1 mg mL−1) at 37 °C for 30 min; (b) 50 μL of the above solution, 100 μL of TMB·2HCl (0.3 mM), and 100 μL of nanoceria (50 mg L−1) were added to 750 μL of acetate buffer (pH = 4); (c) the mixed solution was incubated at 45 °C for 10 min, followed by addition of 1 M H2SO4 to stop the reaction. The absorbance at 450 nm was then recorded. For glucose determination in mouse serum, the fresh serum samples were diluted 300-fold before use. A commercial glucose assay kit was also used to measure the glucose in serum samples following the product's instruction.Results and discussion
Characterization of nanoceria
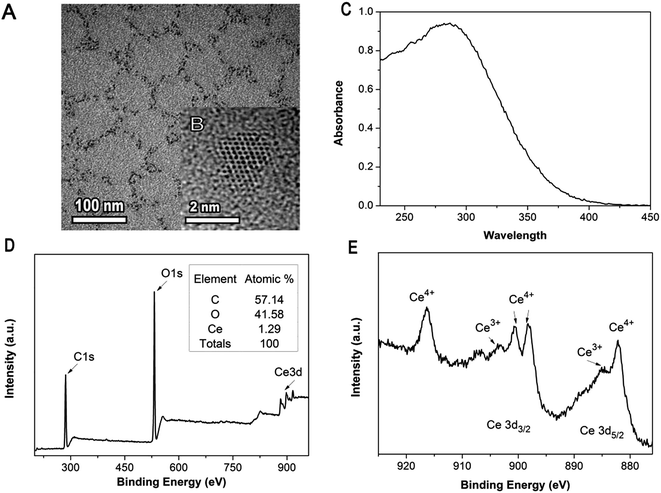
The aqueous solution of dextran-coated nanoceria displays good solubility in water and shows a clear yellow color (Fig. S1†). It keeps steady dispersion and remains stable for several months at room temperature. The presence of dextran in the formation of nanoceria makes nanoparticles with a small nanocrystal core surrounded by a thin polymeric coating. TEM analysis shows the obtained nanoparticles generally display a narrow-size distribution with average diameter about 2–4 nm (Fig. 1A and B). Previous studies indicated that two oxidation states of cerium (Ce III and Ce IV) forcefully absorb ultraviolet light and match up with two characteristic spectrophotometric absorbance peaks. These peaks are in the range of 230–260 nm and 300–400 nm separately which corresponds to cerium(III) and cerium(IV), respectively.26,27 As presented in Fig. 1C, the absorbance in the range of 230–400 nm reveals the coexistence of cerium(III) as well as cerium(IV) in the aqueous solution of the Ce NPs. The surface oxidation state of nanoceria is further confirmed by XPS analysis. The presence of C 1s peak at 286.17 eV in the XPS spectrum of dextran-nanoceria indicates that dextran has been successfully conjugated to the particles (Fig. 1D). From Fig. 1E, the high binding energy peaks at 898.2 and 916.8 eV are attributed to the final state of Ce(IV) 3d94f0O2p6. Peaks at 882.3 and 901.0 eV correspond to the state of Ce(IV) 3d94f2O2p4. These two pairs of spin–orbit doublets are characteristic of Ce4+ 3d final states. The peaks at 885.7 and 904.1 eV are assigned to the final state of Ce(III) 3d94f2O2p5, which are characteristic of Ce3+ species. These results indicate the presence of a mixed valence state for Ce3+ and Ce4+, which is in agreement with previous studies.25,28,29 It is obvious that Ce4+ characteristic peaks are much stronger than those of Ce3+, attributing to the high ratio of Ce4+ to Ce3+.Oxidase activity of nanoceria
To investigate the oxidase activity of nanoceria, we herein chose TMB as chromogenic substrate. As shown in Fig. S2,† nanoceria can effectively catalyze the oxidation of TMB to produce a blue color without H2O2. The resulting mixture shows a maximum absorbance peak at 652 nm, which originates from the oxidation product of TMB. Surprisingly, in the presence of low concentration of H2O2 (50 μM), a relatively lower absorbance was observed, which indicated that certain concentration of hydrogen peroxide might hamper the oxidase activity of Ce NPs.Analogous to natural enzymes, the catalytic activity of nanoceria was dependent on concentration, temperature and pH. We therefore monitored the oxidase-like activity of nanoceria via varying the catalyst concentration from 10–100 mg L−1, reaction time from 1–30 min, pH from 2–9 and temperature from 10–100 °C. As shown in Fig. S3,† the absorbance intensity of the system was enhanced with increasing of catalyst concentration and reaction time. The catalytic activity is improved with increasing of the reaction time and the upward trend slowed down after 15 min. Considering the detection speed and the catalytic activity of nanoceria, the oxidation reaction is stopped after 10 min for colorimetric determination of H2O2 and glucose. The effect of pH was then studied (Fig. S3C†). Nanoceria induces the highest absorbance at pH 4.0, and its activity decreases at least 10% at higher or lower pH. This property is similar to the natural peroxidase HRP and NPs-based peroxidase mimetics.30–32 The effect of temperature on the catalytic activity of nanoceria is also very pronounced. From Fig. S3D,† 50–70 °C is ideal for the reaction, which is similar to HRP (at 50 °C). Meanwhile, compared with HRP, nanoceria exhibited higher activity over a wide range of temperature (30–80 °C), while native enzyme HRP lost most of its activity (at least 20%) under harsh conditions. From these results, the optimal pH and temperature selected for nanoceria catalysis reaction are pH 4.0 and 50 °C.
In order to investigate the reaction mechanism of nanoceria as a mimetic enzyme, the steady-state kinetics for the reactions were performed. A noticed dependence relationship between the initial reaction rate and the substrate concentration was found, which is similar to that of natural enzyme (Fig. S4†). The reciprocal of initial velocities were calculated and applied to the Michaelis curve to investigate whether the catalytic reaction of Ce NPs followed the Michaelis–Menten behavior. By Michaelis–Menten equation fitting the curve, the expressions of the Michaelis constant and maximal reaction velocity were derived (inset of Fig. S4†). The results demonstrate that the oxidation reaction catalyzed by CeO2 is in accordance with the typical Michaelis–Menten behavior towards substrate TMB.
Effect of H2O2 on oxidase activity of nanoceria
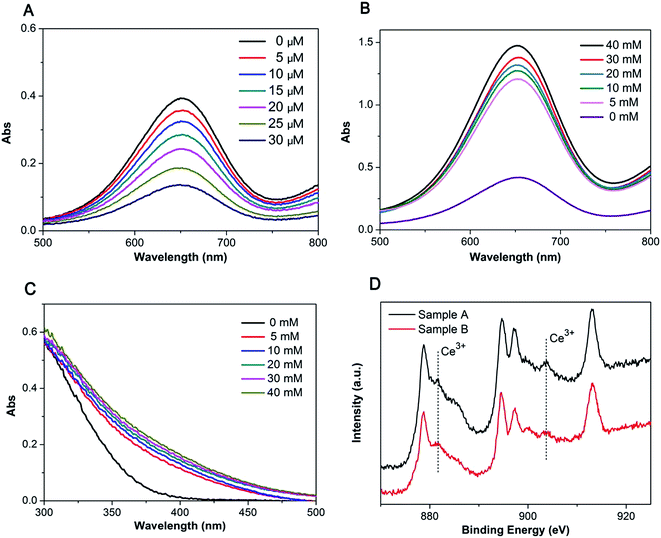
In contrast to peroxidase-catalyzed reactions, CeO2, possessing oxidase activity, could catalyze the oxidation of TMB in the absence of H2O2, where CeO2 serves as electron acceptors. Moreover, we have found that H2O2 plays a dual role, either inhibiting or promoting the catalysis reaction of dextran–CeO2 nanoparticles, depending on its concentration. From Fig. 2A, after adding a very small amount of hydrogen peroxide, an obvious decrease of absorbance is observed. When H2O2 in the mixture reaches millimolar concentrations, it becomes the promotion factor of catalyzing the oxidation of TMB. Fig. 2B reveals that with increasing concentration of hydrogen peroxide above millimolar levels, the oxidase activity of nanoceria is increased.To interpret this phenomenon, the valence state of nanoceria under various concentrations of H2O2 was determined. When nanoceria solution was mixed with H2O2 above millimolar level, its color changed to orange. From the UV-visible spectra of nanoceria (Fig. 2C), with increasing concentrations of H2O2, higher UV absorption value in the range of 300–500 nm was observed, which ascribed to a high amount of cerium(IV) and the orange color.33 This observed increase in absorbance is consistent with XPS results (Fig. 2D). The peaks at 885.7 and 904.1 eV are assigned to the final state of Ce(III) 3d94f2O2p5. It is obvious that sample A shows much stronger peaks at 885.7 and 904.1 eV than sample B does, indicating that 20 mM H2O2 generates significant levels of surface oxidation of Ce3+ to Ce4+ in ceria. These results suggest that high concentration of H2O2 oxidizes nanoceria from Ce3+ to Ce4+ via eqn (2), which is consistent with the mechanism for H2O2 induced DNA release proposed by Liu and co-workers.33 As a result, nanoceria with higher Ce4+/Ce3+ ratio exhibit a higher oxidase activity.
| Ce4+ + e− = Ce3+, E = 1.44 V | (1) |
| H2O2 + 2H+ + 2e− = 2H2O, E = 1.53 V | (2) |
| H2O2 = 2H+ + O2 + 2e−, E = −0.44 V | (3) |
At micromolar concentration of H2O2, oxidation of H2O2 by Ce4+ is thermodynamically favorable by 1.0 V, thus the surface of CeO2 should be rich in Ce3+, which may explain the decreasing oxidation of TMB. However, no significant changes to the oxidation state of Ce at the particle surface were observed based on the UV-visible measurement (data not shown). This phenomenon demonstrates that the loss of oxidase activity of nanoceria in H2O2 may not depend on the surface oxidation chemistry. Another possible explanation is that low concentration of H2O2 can be absorbed on the nanoparticle surface. The capping H2O2 prevent chromogenic substrate TMB from contact with CeO2, thus inhibit the oxidation of substrate. However, this theory need to be further proved in the future.
Colorimetric detection of H2O2 and glucose
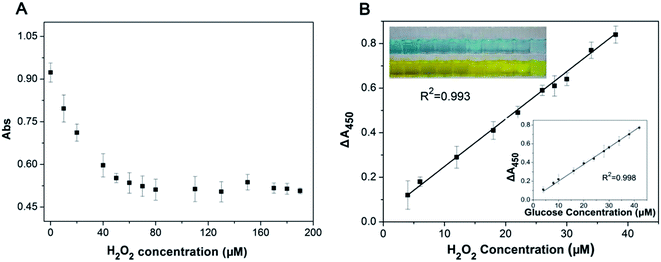
Direct detection of H2O2 based on nanoceria's color change or catalysis of TMB has been reported.21,34 However, the sensitivity is limited since high concentration of H2O2 is needed to produce an obvious color change. The inhibition of oxidase-like activity of nanoceria by micromolar concentration of H2O2 promotes our interest to develop a high sensitive detection system for H2O2. To achieve this, the effect of hydrogen peroxide on the oxidase-like activity of nanoceria was further investigated. With increasing concentration of H2O2, the solution turns from a dark blue to light blue (inset of Fig. 3B). And the color variation of TMB oxidation catalyzed by nanoceria is H2O2 concentration-dependent. After the addition of H2SO4, the catalysis reaction is stopped and solution color turns to yellow and showed a maximum absorption at 450 nm. As reveals in Fig. 3A, the absorbance at 450 nm has dropped significantly with increase of H2O2 concentration (from 0 μM to 60 μM). There was a linear relationship between the reduction value of absorbance (ΔA450) and H2O2 concentration in the range from 4 μM to 40 μM, with a limit of detection (LOD) of 2.5 μM (Fig. 3B).On account of H2O2 can be produced by oxidation of glucose using glucose oxidase (GOx) as a catalyst. A colorimetric detection system for glucose was designed by combining nanoceria and GOx. Since the activity of GOx is not optimal at pH 4.0 and 45 °C, the glucose detection was performed in two separated steps as mentioned in the experimental section. First is the GOx catalyzing glucose to produce hydrogen peroxide. Second, nanocria catalyze the oxidation of TMB with the interaction of H2O2 to produce optical signal. The inset of Fig. 3B illustrates the representative standard curve in a series of glucose concentrations under optimal experimental conditions. The linear response of the absorbance versus glucose concentration in the range from 4 to 40 μM (R2 = 0.998) and the limit of detection was 2.0 μM.
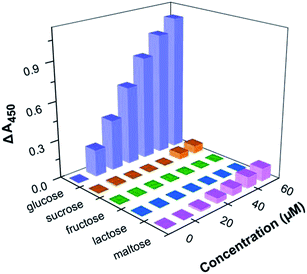
To investigate the selectivity of the system, control experiments were carried out under the same conditions using other potential interferents, including fructose, lactose, sucrose, and maltose. As shown in Fig. 4, there was no detectable signal procured from other saccharides, which demonstrated that this nanoceria-based glucose sensor system possesses high selectivity toward glucose.
The determination of glucose in real serum samples is important in clinical diagnosis. Thus, glucose in mouse serum was detected by using this method. The mouse serum samples were diluted 300-fold respectively to insure the concentration of glucose in samples in the range of glucose linear regression equation. According to the calibration curve, the concentrations of glucose in the serum samples are recorded in Table 1. The results are in good agreement with those obtained by glucose assay kit, indicating the proposed method could be used in real samples for the determination of glucose. Moreover, comparison with other nanoparticle-based sensors for H2O2 and glucose determination also reveals the high sensitivity and reliability of the proposed method (Table S1†).
| Mouse serum sample | Diluted 300 times (μM) | RSD (%) | Experimental result (mM) | Glucose assay kit (mM) |
|---|---|---|---|---|
| 1 | 20.86 | 3.59 | 6.26 | 6.23 |
| 2 | 28.18 | 3.40 | 8.45 | 8.08 |
| 3 | 32.41 | 2.84 | 9.72 | 9.47 |
Conclusion
For the first time, we discovered that hydrogen peroxide plays different impact on the oxidase-like activity of dextran-coated cerium oxide nanoparticles, which depends on its concentration. Micromolar concentration of H2O2 shows an inhibitory effect on the oxidase activity of Ce NPs, while above millimolar level, H2O2 promotes the catalysis activity. Besides, it shows a linear relationship between the inhibitory/promotion effect and the H2O2 concentration. Based on these findings, a novel, high sensitive platform for colorimetric determination of H2O2 and glucose was established. This study adds new knowledge to the interaction between nanoceria and H2O2, and also expands the application of nanoceria for sensor development.Acknowledgements
This research was financed by Grants from the New Century Excellent Talents in University (NCET-13-0483), Open Fund of State Key Laboratory of Electroanalytical Chemistry (SKLEAC201301), the Shaanxi Provincial Research Fund (2014KJXX-42, 2014K02-13-03, 2014K13-10), the Yangling district research fund (2014NY-35) and Fundamental Research Funds for the Northwest A&F University of China (2014YB093, 2452015257).References
- Z. Dai, S. Liu, J. Bao and H. Ju, Chemistry, 2009, 15, 4321–4326 CrossRef CAS PubMed.
- Y. Song, K. Qu, C. Zhao, J. Ren and X. Qu, Adv. Mater., 2010, 22, 2206–2210 CrossRef CAS PubMed.
- Y. J. Long, Y. F. Li, Y. Liu, J. J. Zheng, J. Tang and C. Z. Huang, Chem. Commun., 2011, 47, 11939 RSC.
- R. André, F. Natálio, M. Humanes, J. Leppin, K. Heinze, R. Wever, H.-C. Schröder, W. E. G. Müller and W. Tremel, Adv. Funct. Mater., 2011, 21, 501–509 CrossRef.
- W. Shi, Q. Wang, Y. Long, Z. Cheng, S. Chen, H. Zheng and Y. Huang, Chem. Commun., 2011, 47, 6695–6697 RSC.
- X. Wang, K. Qu, B. Xu, J. Ren and X. Qu, Nano Res., 2011, 4, 908–920 CrossRef CAS.
- J. Mu, Y. Wang, M. Zhao and L. Zhang, Chem. Commun., 2012, 48, 2540–2542 RSC.
- K. Cai, Z. Lv, K. Chen, L. Huang, J. Wang, F. Shao, Y. Wang and H. Han, Chem. Commun., 2013, 49, 6024–6026 RSC.
- T. Lin, L. Zhong, Z. Song, L. Guo, H. Wu, Q. Guo, Y. Chen, F. Fu and G. Chen, Biosens. Bioelectron., 2014, 62, 302–307 CrossRef CAS PubMed.
- C. Lu, X. Liu, Y. Li, F. Yu, L. Tang, Y. Hu and Y. Ying, ACS Appl. Mater. Interfaces, 2015, 7, 15395–15402 Search PubMed.
- H. Wei and E. Wang, Chem. Soc. Rev., 2013, 42, 6060 RSC.
- Y. Lin, J. Ren and X. Qu, Acc. Chem. Res., 2014, 47, 1097–1105 CrossRef CAS PubMed.
- I. Celardo, J. Z. Pedersen, E. Traversa and L. Ghibelli, Nanoscale, 2011, 3, 1411–1420 RSC.
- C. T. Campbell and C. H. F. Peden, Science, 2005, 309, 713 CrossRef CAS PubMed.
- E. P. Murray, T. Tsai and S. A. Barnett, Nature, 1999, 400, 649–651 CrossRef CAS.
- K. L. Heckman, W. Decoteau, A. Estevez, K. J. Reed, W. Costanzo, D. Sanford, J. C. Leiter, J. Clauss, K. Knapp, C. Gomez, P. Mullen, E. Rathbun, K. Prime, J. Marini, J. Patchefsky, A. S. Patchefsky, R. K. Hailstone and J. S. Erlichman, ACS Nano, 2013, 7, 10582–10596 CrossRef CAS PubMed.
- C. Xu and X. Qu, NPG Asia Mater., 2014, 6, e90 CrossRef CAS.
- A. Karakoti, S. Singh, J. M. Dowding, S. Seal and W. T. Self, Chem. Soc. Rev., 2010, 39, 4422–4432 RSC.
- T. Pirmohamed, J. M. Dowding, S. Singh, B. Wasserman, E. Heckert, A. S. Karakoti, J. E. S. King, S. Seal and W. T. Self, Chem. Commun., 2010, 46, 2736 RSC.
- A. Asati, C. Kaittanis, S. Santra and J. M. Perez, Anal. Chem., 2011, 83, 2547–2553 CrossRef CAS PubMed.
- X. Jiao, H. Song, H. Zhao, W. Bai, L. Zhang and Y. Lv, Anal. Methods, 2012, 4, 3261 RSC.
- A. R. Lippert, G. C. Van de Bittner and C. J. Chang, Acc. Chem. Res., 2011, 44, 793–804 CrossRef CAS PubMed.
- S. K. Maji, S. Sreejith, A. K. Mandal, X. Ma and Y. Zhao, ACS Appl. Mater. Interfaces, 2014, 6, 13648–13656 Search PubMed.
- J. W. M. Yuen and I. F. F. Benzie, Free Radical Res., 2010, 37, 1209–1213 CrossRef.
- J. M. Perez, A. Asati, S. Nath and C. Kaittanis, Small, 2008, 4, 552–556 CrossRef CAS PubMed.
- S. Singh, T. Dosani, A. Karakoti, A. Kumar, S. Seal and W. T. Self, Biomaterials, 2011, 32, 6745–6753 CrossRef CAS PubMed.
- A. I. Medalia and B. J. Byrne, Anal. Chem., 1951, 23, 453–456 CrossRef CAS.
- E. Bêche, P. Charvin, D. Perarnau, S. Abanades and G. Flamant, Surf. Interface Anal., 2008, 40, 264–267 CrossRef.
- L. Qiu, F. Liu, L. Zhao, Y. Ma and J. Yao, Appl. Surf. Sci., 2006, 252, 4931–4935 CrossRef CAS.
- L. Gao, J. I. E. Zhuang, L. Nie, J. Zhang, Y. U. Zhang, N. Gu, T. Wang, J. Feng, D. Yang, S. Perrett and X. Yan, Nat. Nanotechnol., 2007, 1–7 CAS.
- L. Han, L. Zeng, M. Wei, C. M. Li and A. Liu, Nanoscale, 2015, 7, 11678–11685 RSC.
- X. Jiang, C. Sun, Y. Guo, G. Nie and L. Xu, Biosens. Bioelectron., 2015, 64, 165–170 CrossRef CAS PubMed.
- B. Liu, Z. Sun, P. J. Huang and J. Liu, J. Am. Chem. Soc., 2015, 137, 1290–1295 CrossRef CAS PubMed.
- M. Ornatska, E. Sharpe, D. Andreescu and S. Andreescu, Anal. Chem., 2011, 83, 4273–4280 CrossRef CAS PubMed.
Footnotes |
| † Electronic supplementary information (ESI) available. See DOI: 10.1039/c6ra09217a |
| ‡ Both Ruochen Guo and Yanru Wang rank as the first authors. |
| This journal is © The Royal Society of Chemistry 2016 |

