A fully automated portable gas chromatography system for sensitive and rapid quantification of volatile organic compounds in water

Menglian Zhou ab, Jiwon Leeab, Hongbo Zhuab, Robert Nidetzbc, Katsuo Kurabayashibc and Xudong Fan*ab
aDepartment of Biomedical Engineering, University of Michigan, 1101 Beal Avenue, Ann Arbor, Michigan 48109, USA. E-mail: xsfan@umich.edu
bCenter for Wireless Integrated MicroSensing and Systems (WIMS2), University of Michigan, Ann Arbor, MI 48109, USA
cDepartment of Mechanical Engineering, University of Michigan, 2350 Hayward, Ann Arbor, Michigan 48109, USA

Received 9th April 2016 , Accepted 8th May 2016

First published on 9th May 2016


Abstract

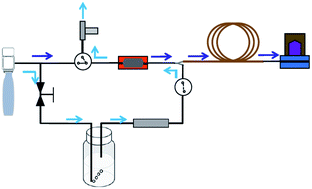
This paper presents the design, assembly and characterization of a fully automated portable gas chromatography system coupled with a purge-and-trap system for the sensitive and rapid field analysis of volatile organic compounds (VOCs) in water samples. The VOCs were firstly purged by helium gas in the micro-fabricated preconcentrator/injector and then injected into the downstream capillary column and photoionization detector for separation and detection. The purge-and-trap conditions were optimized to efficiently extract VOCs from water samples. The calibration of 6 VOCs with concentrations ranging from 1 μg L−1 to 500 μg L−1 showed excellent linearity (R2 > 0.99). Detection limits (3σ) of sub-μg L−1 (or sub-parts-per-billion level) were achieved, which are orders of magnitude lower than the maximum contaminant level (MCL) established by the US Environmental Protection Agency (EPA). The separation of 26 analytes (in a vapor pressure range from 0.087 Torr to 180 Torr) in a water sample in less than 15 minutes was also demonstrated. Finally, the optimized system was applied to field analysis of a groundwater sample in an environmental remediation site. The quantified results agreed well with those obtained by an analytical lab using standard analytical methods and instruments. Our system offers a lab-on-a-chip solution for sensitive and rapid water analysis compliant with the EPA sample collection method. It will have a wide range of applications in environmental monitoring, industries and healthcare.

Introduction

Contamination of natural water by volatile organic compounds (VOCs) is a major environmental issue due to their toxicity and various adverse effects on human health.1,2 Possible sources of those compounds include industrial effluents, waste disposal, solvents, gasoline or oil spills on the ground surface, pesticides and herbicides used in agriculture, and disinfection processes.3 To protect the public from contaminated water, the Environmental Protection Agency (EPA) established the maximum contaminant level (MCL), which is the highest level of a contaminant allowed in drinking water. Since the MCLs for many VOC contaminants are very low (μg L−1 or parts-per-billion in terms of mass), sensitive and quantitative analytical methods are greatly needed for long-term monitoring and remediation applications.

In recent years, sensor arrays or electronic noses have made significant progress in VOC mixture analysis, including surface acoustic waves (SAWs),4 quartz crystal microbalances (QCMs),5 metal–oxide–semiconductor field-effect transistors (MOSFETs)6 and colorimetric sensors.7 These sensor arrays are cost effective and compact in size, some of which have also achieved low detection limits; however, with an increased number of compounds, the complexity of multivariate analysis or pattern recognition for reading the response patterns of the sensor arrays increases. On the other hand, gas chromatography (GC) coupled with spectrometers (such as mass spectroscopy (MS)8–12 and ion mobility spectroscopy (IMS)13,14) or other vapor detectors (such as flame ionization detectors (FIDs),15 photoionization detectors (PIDs),16 thermal conductivity detectors (TCDs)17 and electron capture detectors (ECDs)18) are more suitable for complex analysis, where VOC mixtures are separated and subsequently detected and quantified individually. Nowadays, the well-established analytical method for quantification of VOCs is the EPA Method 5030C/8260B,19,20 by which samples are first collected to canisters and then taken to a well-equipped analytical chemistry laboratory for GC-MS analysis. This process is time consuming (from a few days to over a week) and costly. Additionally, volatilization losses and contamination of the samples may occur during shipment and storage.

Field-portable GCs15,21–28 and MEMS-based micro scale gas chromatography (μGC) systems17,29–33 have been developed for analyzing VOCs on-site. Most portable GC/μGC systems consist of a micro-preconcentrator/injector (μPCI),34 an injection port, a separation column, a detector and a pump or a carrier gas cartridge, all of which are fluidically interconnected. Various detectors have been integrated in these systems, such as chemiresistors,21,23 ion trap mass spectrometers,23,25,26 SAW microsensors,26,35 micro-FIDs15 and bubble based microfluidic sensors.36 However, most of these portable GC and μGC systems are focused on air sampling, and only a few systems can be used to analyze VOCs in water samples, such as the portable GC/SAW system with liquid extraction25 or static headspace sampling,26 the portable GC–μFID systems coupled with headspace solid-phase extraction (HS-SPME),15 the μPE (micro purge extraction)–μGC–μTCD system32 and static headspace sampling with a micro-helium discharge photoionization detector.29 Those systems have achieved compact sizes and fast analysis (a few seconds to several minutes, including sampling and analyzing time). However, due to the difficulty in stationary phase coating, the microcolumns used in these systems are usually too short to have sufficient separation capability for complex samples (usually fewer than 10 VOCs are analyzed in these systems). In addition, without an efficient sample extraction method, only a small fraction of the VOCs in the water samples can be injected into these systems, so the sensitivity of these systems are also limited (usually hundreds of μg L−1).

Here, we report a fully automated portable gas chromatography system integrated with a purge-and-trap water sampling system, a μPCI, a 10 meter separation column and a flow-through PID (portable P&T–GC–PID) for sensitive and rapid VOC quantification in water. This system has achieved a detection limit of sub μg L−1 (or sub-ppb in terms of mass) for VOCs in water, a short analysis time (∼10 minutes, depending on the target VOCs, and can be shortened further) with a light weight (less than 4 kg) and compact size (40 cm × 30 cm × 10 cm). Field studies using a groundwater sample from a recovery well showed that the VOC results obtained with our portable GC system quantitatively matched those generated with standard procedures and instruments by an analytical lab.

Experimental

Materials and sample preparation

All the analytes used in the experiment were purchased from Sigma (St. Louis, MO) or Fisher Scientific (Pittsburgh, PA) and had a purity greater than 97%. Carbopack™ X, adsorbent material for μPCI, was purchased from Supelco (Bellefonte, PA). Universal quick seal connectors, universal “Y” connectors, 20 mL vials, and Rtx-VMS capillary columns (10 m × 0.25 mm i.d., 1.4 μm film thickness) were purchased from Restek (Bellefonte, PA). Two-port and three-port solenoid valves were purchased from Lee Company (Westbrook, CT). A mini-diaphragm pump was purchased from Gast Manufacturing (Benton Harbor, MI). Nickel wire (0.32 mm diameter, 1.24 ohm m−1), used as a heating wire for the capillary column, was purchased from Lightning Vapes (Bradenton, FL). Disposable helium cartridges (95 cm3, 2500 psig) were purchased from Leland (South Plainfield, NJ). A commercial PID with a built-in lamp drive circuit and amplifier was purchased from Baseline-Mocon (Lyons, CO). A type K thermocouple was purchased from Omega Engineering (Stamford, CT). A data acquisition card, USB-6003 (16 bits) and a USB-TC01 (for thermocouple measurement) were purchased from National Instruments (Austin, TX).

Water samples at various concentration levels (from 1–500 μg L−1 for each analyte) were prepared by serial dilution with ultrapure water obtained from a Milli-Q water purification system (Thermo Fisher Scientific, Wayne, MI). All solutions were stored in 20 mL vials, each of which contained 10 mL of water samples and 10 mL of air-filled headspace. Groundwater samples were collected by Quantum Environmental Inc. (Ann Arbor, MI) from a recovery well (an environmental remediation system). All water samples were stored in a 4 °C refrigerator before use.

Methods

Fig. 1 presents a photograph of the portable GC system. The system is housed in an approximately 40 cm (L) × 30 cm (W) × 10 cm (H) plastic case and weighs less than 4 kg. It operates on 110 V AC power with an average power consumption of 25 W for the entire operation. Battery operation is also possible for field applications. The disposable helium cartridge provides purging gas during the sampling mode and carrier gas during the analyzing mode. Each cartridge can provide enough helium for more than 25 analyses. A LabView™ control program developed in-house is used for automated operation of the system, including flow routing, μPCI injection, column temperature ramping and data logging. Once started, the program panel shows the status of the system (such as valve on/off and pump on/off), column temperature and PID detector signal.
image file: c6ra09131h-f1.tif
Fig. 1 Photo of a portable GC system. Components on the diagram: (1) 12 V DC–DC converter; (2) 24 V power supply; (3) 36 V power supply; (4) data acquisition card; (5) home-made photoionization detector; (6) scrubber; (7) printed circuit board; (8) μ-preconcentrator/injector; (9) thermocouple data acquisition card; (10) GC column with thermocouple; (11) 3-port solenoid valve; (12) 2-port solenoid valve; (13) regulating valve; (14) helium cartridge; (15) flow buffer; (16) diaphragm pump; and (17) needle valve.

The μPCI was used to trap and accumulate low-concentration VOCs and then inject them into the downstream separation column as a sharp peak by thermal desorption. Briefly, a channel with tapered inlet and outlet ports was etched on a Si wafer by deep-reactive-ion-etching (DRIE), and then anodically bonded to a Pyrex plate. A platinum microheater and a resistance temperature detector (RTD) were evaporated onto the backside. Carbopack™ X granules were loaded into the cavity between the etched channel and Pyrex plate through a third port, which was sealed after loading. For fluidic connection, a guard column was inserted into each port and secured with silicone adhesive. For electrical connection, the microheater and RTD were wire-bonded to a printed circuit board (customarily designed and manufactured by M.A.K.S., Inc.). The μPCI was preconditioned initially at 300 °C for 12 hours under helium flow.

The Rtx-VMS capillary column and nickel wire (both 10 meters long) were placed in parallel and wrapped by Teflon tape,37 and then coiled into a helix of 10 cm in diameter and 1 cm in height. A type K thermocouple was inserted into the coil to read the column temperature via USB-TC01. To achieve a programmed temperature ramping profile, a pulse-width-modulated signal (4.0 Hz square wave) output via USB-6003 and was applied to the heater power relay on the printed circuit board. The duty cycle of the square wave was calculated by a proportional-integral-derivative controller in the LabView™ program and updated every 0.4 s based on the set-point temperature and measured temperature at that moment.38

A PID module used in this work was assembled using the commercial PID with a built-in lamp drive circuit and amplifier and a home-made flow-through ionization chamber, which has a small dead volume and hence provides sharp chromatographic peaks in comparison with a regular ionization chamber.16 As shown in Fig. S1, a 2 cm long straight microfluidic channel was created by a 380 μm gap between two conductive silicon wafers with a resistivity of 0.001–0.005 Ω cm and a thickness of 380 μm. The bottom and top of the microfluidic channel was covered by a Krypton UV lamp and a glass slide, respectively, which were then glued to the conductive silicon wafers with optical epoxy. Two guard columns (250 μm i.d. and 380 μm o.d.) were inserted into the inlet and outlet of the PID and sealed with optical epoxy. The output signal of PID was sampled at a rate of 40 kHz and averaged every 0.25 s for one data point on the chromatogram. The details of the PID assembly and characterization can be found elsewhere.39

The instrument operates in two modes, as illustrated in Fig. 2. The flow routing components, including the diaphragm pump and the solenoid valves, are controlled by solid state relays driven by the digital outputs from USB-6003. In the sampling mode, the two solenoid valves were actuated. Helium gas was bubbled from a 250 μm i.d. fused silica tubing through the water sample in a purging vial at ambient temperature and drawn by a diaphragm pump through a moisture filter and then a μPCI at a flow rate of 100 mL min−1. The vapors were adsorbed on the Carbopack X inside the μPCI during the sampling mode. The entire sampling took 5 minutes, which can be further shortened if needed.


image file: c6ra09131h-f2.tif
Fig. 2 Schematic of the portable GC system. Flow directions for sampling and analyzing are marked on the figure. Components on the diagram: (1) helium cartridge; (2) regulating valve; (3) 3-port solenoid valve; (4) diaphragm pump; (5) μPCI; (6) needle valve; (7) purging vial; (8) moisture filter; (9) 2-port solenoid valve; (10) universal “Y” connector; (11) GC column with thermocouple; and (12) PID module.

In the analyzing mode, the diaphragm pump and solenoid valves were closed. Helium gas was directed through the μPCI, and then the column and the PID module at a flow rate of 1 mL min−1. After 60 seconds of pressure stabilization and PID baseline recovery period, the μPCI was heated to 270 °C in 0.6 s and then kept at 250 °C for 5 s to allow thermal desorption. The column was first heated to and kept at 40 °C for 1 min, and then ramped to 120 °C at a rate of 5 °C min−1.

Theoretical analysis of purge efficiency

Unlike in air samples, a large fraction of VOCs in water samples are contained in the liquid phase rather than headspace. Therefore, several VOC extraction technologies have been developed, such as membrane extraction,30,40 static headspace techniques,25,29 purge and trap (P&T)11,32,41,42 and solid-phase microextraction (SPME).9,15,43 Compared to the static headspace and SPME techniques, P&T is capable of transferring all VOCs to the cryo- or sorbent-trap and thus has a better detection limit. In addition, P&T is in compliance with the EPA Method 8260B, which is commonly used by analytical labs in water sample analysis. Therefore, we adopted P&T in our portable GC system.

Purging organics out of water can be approximated as partitioning between the water and the purge gas. The purge efficiency (η) can be defined as:

 
image file: c6ra09131h-t1.tif(1)
where c0 (mol L−1) and cr (mol L−1) are the analyte concentrations of the water sample before and after the purge, respectively. Assuming that the analyte is under partition equilibrium during the purging process, the concentration ratio between the gas phase and the liquid phase is constant and can be related by Henry’s constant:44
 
image file: c6ra09131h-t2.tif(2)
where KH (mol L−1 atm−1) is the Henry’s law solubility constant for the analyte and pg (atm) is the vapor pressure of the analyte in the headspace. The temperature dependence of KH can be expressed as:
 
image file: c6ra09131h-t3.tif(3)
where K0H is Henry’s constant under standard conditions (T0 = 298.15 K) and ε (K) is the temperature dependent constant acquired by the experiment.

Since cr continuously decreases during the purging process, a differential model can be established. Assuming that the analyte concentration in the water sample decreases by Δcr after purge gas (e.g., helium) volume ΔVg passes through, and according to the ideal gas law and mass conservation, we have:

 
pgΔVg = RTΔng, (4)
 
Δng = −VlΔcr, (5)
where R (L atm mol−1 K−1) is the ideal gas constant, T (K) is the purging temperature, Vl (L) is the water sample volume, and Δng (mol) is the number of moles of the analyte that shifts from the liquid phase to the gas phase. Solving eqn (4) and (5), and considering the initial condition that cr = c0 when Vg = 0, we have:
 
image file: c6ra09131h-t4.tif(6)

Thus the purge efficiency is:

 
image file: c6ra09131h-t5.tif(7)

With eqn (3) and (7) and the constants K0H and ε listed in Table 1, the purge efficiencies for the six analytes used in our experiment, i.e., benzene, cis-1,2-dichloroethylene (cis-1,2-DCE), p-xylene, trichloroethene (TCE), tetrachloroethylene (PCE), and toluene under different purging conditions are presented in Fig. 3. For the water sample volume of Vl = 10 mL used in our experiment, a purge gas volume of 500 mL results in Vg/Vl = 50, which, according to Fig. 3(B), corresponds to a purge efficiency in excess of 99%, even at a temperature of 15 °C.

Table 1 Physical properties and calibration data summary of the six VOCs
Compound name Solubility in water (g L−1) at 25 °C K0H (mol L−1 atm−1)44 ε (K)44 R2 Detection limit at 3σ (μg L−1 or ppb) MCLa (μg L−1 or ppb) Potential health effects
a Maximum contamination level. The highest level of a contaminant that is allowed in drinking water defined by the United States Environmental Protection Agency.
cis-1,2-Dichloroethylene (cis-1,2-DCE) 3.5 0.27 4200 0.9997 0.11 70 Liver problems
Benzene 1.8 0.18 3200 0.9999 0.28 5 Anemia; decrease in blood platelets; increased risk of cancer
Trichloroethene (TCE) 1.1 0.11 4800 0.9997 0.31 5 Liver problems; increased risk of cancer
Toluene 0.52 0.15 3400 0.9962 0.13 1000 Nervous system, kidney, or liver problems
Tetrachloroethylene (PCE) 0.15 0.057 5100 0.9994 0.13 5 Liver problems; increased risk of cancer
p-Xylene 0.20 0.17 4500 0.9991 0.15 10[thin space (1/6-em)]000 (total xylenes) Nervous system damage


image file: c6ra09131h-f3.tif
Fig. 3 (A) Purge efficiency for p-xylene under different purge temperatures. For all VOCs with ε > 0, the purge efficiency increases with temperature. (B) Purge efficiency at 288.15 K for 6 VOCs with K0H ranging from 0.05 to 0.27 mol L−1 atm−1 (see Table 1). A theoretical purge efficiency over 99% can be achieved when Vg/Vl is 50 at 288.15 K.

Results and discussion

First, we characterized the purge efficiency of our system. Here we used p-xylene as a model compound. During the experiment, 10 mL of p-xylene solution with concentrations of 5 μg L−1, 5 μg L−1, 50 μg L−1 and 500 μg L−1 were placed in four 20 mL purging vials. The helium purging rate and pumping rate were adjusted to 40 mL min−1 for the first vial (Column (A) in Fig. 4) and 100 mL min−1 for the other three vials (Columns B–D in Fig. 4). The time for each purge was set to 5 minutes, thus making Vg/Vl = 20 for the first vial and Vg/Vl = 50 for the other three vials. All the purge efficiency experiments were performed under a lab environment and the purging temperature was 21 °C. Other experimental conditions are described in the Methods section.
image file: c6ra09131h-f4.tif
Fig. 4 Comparison of extraction profiles for various concentrations of p-xylene in water with different helium purging volumes. Under each set of purging conditions, the water sample was purged four times consecutively. The time for each purge was 5 minutes. The helium flow rate was 40 mL min−1 for Column (A) and 100 mL min−1 for Columns (B)–(D). Vg/Vl for each purge was 20 for Column A and 50 for Columns (B)–(D). Details of p-xylene detection can also be found in Fig. S2 in the ESI.

Each vial was purged and analyzed four times consecutively without changing the solutions within. Due to the fact that the concentration of the solution decreased after each purge, the system actually measured the analyte from a high concentration to low concentration during the four purges. To avoid the possible memory effect between the two adjacent purges, the system was cleaned by trigging the μPCI injection (heated to 270 °C in 0.6 s, and then kept at 250 °C for 5 s at 1 mL min−1 helium flow) three times.

The experimental fraction of extraction for each purge presented in Fig. 4 is defined as:

 
image file: c6ra09131h-t6.tif(8)
where n is the number of consecutive purges and Ai is the peak area for the ith purge. Column (A) in Fig. 4 shows that with Vg/Vl = 20, a purge efficiency of only 59.6% was obtained from the first purge. With the increased purge flow rate so that Vg/Vl = 50, a significant improvement in the purge efficiency (85.2%) can be achieved. Although the experimental purge efficiency at Vg/Vl = 50 (85.2%, 92.8%, and 92.1% for the first purge in Columns (B), (C), and (D), respectively) is slightly lower than the corresponding theoretical efficiency (all 99.9%), it is adequate for the system to extract and analyze VOCs in water. Therefore, in the following experiments, we used Vg/Vl = 50 with a purge flow rate of 100 mL min−1 and a purge time of 5 minutes. The possible reason for the discrepancy between the experimental and theoretical purge efficiency could be that the equilibrium partitioning between the water sample and the helium bubbles was not fully reached.45,46

Linear range, detection limit, and precision

The linearity, detection limit, and detection precision of the portable GC system mentioned above were characterized under the sampling and analyzing conditions previously described in the Methods section at an ambient temperature (21 °C) using the six VOCs listed in Table 1 as model systems. The corresponding chromatographic peaks (raw response data) of those six VOCs in water with concentrations of 1 μg L−1 and 20 μg L−1 are presented in Fig. 5(A) and (B), respectively. The full-width-at-half-maximum (fwhm) of these VOCs at 1 μg L−1 varies from 2.25 s to 3 s.
image file: c6ra09131h-f5.tif
Fig. 5 Representative chromatograms for the six different compounds at the concentrations of (A) 1 μg L−1 and (B) 20 μg L−1. Note that each chromatographic peak is horizontally shifted to be aligned and centered around 4 seconds. (C) Linearity test for the six compounds in (A) and (B). Peak areas as a function of concentrations are plotted on a log–log scale. Error bars are obtained with three measurements. The solid lines are the linear fit on the log–log scale. The slopes are 1.008, 0.986, 1.003, 0.998, 1.019, and 0.948 for benzene, cis-1,2-DCE, p-xylene, TCE, PCE and toluene, respectively. The dashed line shows the curve with a unity slope to guide the eye. The details of the linearity, detection limit, and detection precision for those compounds are given in Table 1 and Fig. S3.

The detection limit LOD for those compounds presented in Table 1 are calculated based on eqn (9):

 
image file: c6ra09131h-t7.tif(9)
where σ is the standard deviation of the baseline noise and Ph is the peak height at 1 μg L−1 in Fig. 5(A). Since the LODs (sub-μg L−1 level) of these VOCs are at least one order of magnitude lower than the MCLs listed in Table 1, the sensitivity of our portable GC system is sufficient for field analysis of water samples. Fig. 5(C) presents a set of calibration curves for the six VOCs with water sample concentrations ranging from 1 μg L−1 to 500 μg L−1. The peak area in Fig. S3 shows an excellent linear response with R2 above 0.99 in the linear regression analysis (forced zero Y-intercept on a linear–linear scale). The precisions were calculated using three measurements.

Analysis of a complex VOC mixture

In most applications, the water samples are complex mixtures of target VOCs and many unrelated VOCs. In this scenario, a strong separation capability is required for the system. To test the separation capabilities of the portable GC system, a water sample containing 26 organic compounds, all selected from the EPA Method 8260B19 analyte list (with vapor pressure ranging from 0.087 Torr to 180 Torr), was analyzed. The concentration for each compound was 5 μg L−1 in water. The representative chromatogram is presented in Fig. 6, which provides a retention time reference library for us to identify VOCs. It is shown that the six VOCs discussed earlier were eluted in less than 6 minutes and the whole mixture was eluted in 15 minutes. Better separations can be achieved by optimizing the column temperature ramping profile and the analyzing flow rate; and a shorter analysis time can be achieved by increasing the temperature ramping rate at the cost of loss of resolution.
image file: c6ra09131h-f6.tif
Fig. 6 Chromatogram of a mixture of 26 VOCs in water at a concentration of 5 μg L−1 for each analyte. (1) cis-1,2-Dichloroethylene; (2) benzene; (3) trichloroethene; (4) toluene; (5) tetrachloroethylene; (6) 1,2-dibromoethane; (70 chlorobenzene; (8) ethylbenzene; (9) p-xylene; (10) styrene; (11) bromobenzene; (12) propylbenzene; (13) 2-chlorotoluene; (14) mesitylene; (15) 4-chlorotoluene; (16) tert-butylbenzene; (17) 1,2,4-trimethylbenzene; (18) sec-butylbenzene; (19) 1,3-dichlorobenzene; (20) 1,4-dichlorobenzene; (21) butylbenzene; (22) 1,2-dichlorobenzene; (23) nitrobenzene; (24) hexachlorobutadiene; (25) 1,2,3-trichlorobenzene; and (26) naphthalene.

Quantification of VOC concentration in groundwater samples

To test the practical utility of our portable GC system, a groundwater sample obtained from a recovery well located in Pinckney, MI, was field analyzed by our portable GC system with assistance from a local environmental service company. The recovery well is a groundwater remediation system, by which groundwater is pumped through one or more vessels containing activated carbon to adsorb the organic contaminants in the groundwater. The field technicians from Quantum Environmental collect water samples on a monthly basis from the outlets of the vessel and send them to an analytical chemistry lab (Brighton Analytical, Brighton, MI) for determination of VOCs in the water under the EPA Method 5030C/8260B in order to decide whether the vessels can still effectively adsorb pollutants from the groundwater or need to be replaced. The whole procedure (sample collection, transportation, and analysis) normally takes about two weeks.

In our test, as shown in Fig. 7, a 10 mL groundwater sample collected from the outlet of the vessels (inset of Fig. 7) was placed in the purging vials and analyzed by our portable GC system. cis-1,2-DCE, TCE, and PCE were identified based on their respective retention times provided in Fig. 6 and their concentrations were calculated using the calibration curves in Fig. 5(C). The whole procedure took 11 minutes (5 minutes of sampling, 1 minute of holding and 5 minutes of analysis). Table 2 presents the quantitative results, precisions and LODs of these three VOCs by our portable GC system and by the bench-top GC system in an analytical chemistry lab. The performance comparison shows that our portable GC system provides faster and more sensitive capabilities for the quantification of VOCs in water samples.


image file: c6ra09131h-f7.tif
Fig. 7 Chromatogram of a groundwater sample collected from a recovery well. A comparison between the concentration results obtained with our portable GC system and by an analytical lab is given in Table 2. The inset shows that our portable GC system was used to test water samples on site. The three vessels presented in the photo are liquid phase carbon. The three organic compounds shown in the chromatogram are: (1) cis-1,2-dichloroethylene; (2) trichloroethene; and (3) tetrachloroethylene, which can be identified by their respective retention times in Fig. 6.
Table 2 Performance comparison of the portable GC system and a benchtop GC system from a local analytical chemistry lab
Compound name Qualification result (μg L−1) Precision at 50 μg L−1 (%) LOD (μg L−1)
Pa Ab Pc A P A
a Portable GC results.b Analytical chemistry lab results.c Based on Fig. 5(C) and S3.
cis-1,2-Dichloroethylene 7.2 7 8.4 2.9 0.11 1
Trichloroethene 2.6 3 9.2 4.0 0.31 1
Tetrachloroethylene 1.7 2 5.8 2.1 0.13 1


Conclusions

We have developed and characterized the performance of a portable GC system for the highly sensitive, rapid and in situ VOC quantification in water. Our results show that our portable GC system is able to complete analytical testing in less than 20 minutes with a sub-μg L−1 level detection limit. Quantitative comparison with results obtained with standard procedures and instruments further validated the deployability of the portable GC system in the field. Further development includes the integration of a PID detector with higher sensitivity16 to achieve a lower VOC detection limit down to ng L−1 in water samples. A multiple stage μPCI loaded with different adsorbents can also be implemented to trap VOCs with a wider range of volatilities.47,48 A shorter purge time (<1 minute) will be explored to further shorten the overall analysis time. Finally, a multi-dimensional portable GC system will be pursued in order to handle more complicated mixtures. Our ultimate goal is to be able to analyze and quantify all the VOCs (>100) listed in the EPA Method 8260B19 in situ in less than 20 minutes. It should be noted that, like many other field-deployed devices, our portable GC system will be best used for rapid in situ screening when the target VOCs are known. For further confirmation of the VOCs that the portable GC system identifies, or when more complex samples need to be analyzed, another technique (such as mass spectrometry or Fourier transform infrared spectroscopy) should be employed along with portable GC.

Acknowledgements

We would like to thank the Environmental Protection Agency (83564401) and the National Science Foundation (IIP-1342917) for financial support, the Lurie Nanofabrication Facility for assistance in chip fabrication, and Quantum Environmental Inc. for providing groundwater samples.

References

  1. B. L. Rowe, et al., Occurrence and potential human-health relevance of volatile organic compounds in drinking water from domestic wells in the United States, Environ. Health Perspect., 2007, 115(11), 1539 CrossRef CAS PubMed.
  2. M. Kampa and E. Castanas, Human health effects of air pollution, Environ. Pollut., 2008, 151(2), 362–367 CrossRef CAS PubMed.
  3. S. Risticevic, et al., Recent developments in solid-phase microextraction, Anal. Bioanal. Chem., 2009, 393(3), 781–795 CrossRef CAS PubMed.
  4. M. Penza and G. Cassano, Application of principal component analysis and artificial neural networks to recognize the individual VOCs of methanol/2-propanol in a binary mixture by SAW multi-sensor array, Sens. Actuators, B, 2003, 89(3), 269–284 CrossRef CAS.
  5. P. Si, et al., Polymer coated quartz crystal microbalance sensors for detection of volatile organic compounds in gas mixtures, Anal. Chim. Acta, 2007, 597(2), 223–230 CrossRef CAS PubMed.
  6. H. Sundgren, et al., Evaluation of a multiple gas mixture with a simple MOSFET gas sensor array and pattern recognition, Sens. Actuators, B, 1990, 2(2), 115–123 CrossRef CAS.
  7. L. Feng, et al., A colorimetric sensor array for identification of toxic gases below permissible exposure limits, Chem. Commun., 2010, 46(12), 2037–2039 RSC.
  8. P. A. Smith, et al., Detection of gas-phase chemical warfare agents using field-portable gas chromatography–mass spectrometry systems: instrument and sampling strategy considerations, TrAC, Trends Anal. Chem., 2004, 23(4), 296–306 CrossRef CAS.
  9. M.-R. Lee, C.-M. Chang and J. Dou, Determination of benzene, toluene, ethylbenzene, xylenes in water at sub-ng L−1 levels by solid-phase microextraction coupled to cryo-trap gas chromatography–mass spectrometry, Chemosphere, 2007, 69(9), 1381–1387 CrossRef CAS PubMed.
  10. M. E. Mahmoud and H. M. AlBishri, Identification of dissolved organic species in non-drinking tap water by solid-phase extraction and gas chromatography–mass spectrometry, J. Saudi Chem. Soc., 2010, 14(1), 105–115 CrossRef CAS.
  11. L. Zoccolillo, et al., Improved analysis of volatile halogenated hydrocarbons in water by purge-and-trap with gas chromatography and mass spectrometric detection, J. Chromatogr. A, 2005, 1077(2), 181–187 CrossRef CAS PubMed.
  12. F. Santos and M. Galceran, Modern developments in gas chromatography–mass spectrometry-based environmental analysis, J. Chromatogr. A, 2003, 1000(1), 125–151 CrossRef CAS PubMed.
  13. P. Aragon, J. Atienza and M. Climent, Analysis of organic compounds in air: a review, Crit. Rev. Anal. Chem., 2000, 30(2–3), 121–151 CrossRef CAS.
  14. J. Dewulf and H. Van Langenhove, Anthropogenic volatile organic compounds in ambient air and natural waters: a review on recent developments of analytical methodology, performance and interpretation of field measurements, J. Chromatogr. A, 1999, 843(1), 163–177 CrossRef CAS.
  15. J. Ji, et al., Field analysis of benzene, toluene, ethylbenzene and xylene in water by portable gas chromatography–microflame ionization detector combined with headspace solid-phase microextraction, Talanta, 2006, 69(4), 894–899 CrossRef CAS PubMed.
  16. H. Zhu, et al., Flow-through microfluidic photoionization detectors for rapid and highly sensitive vapor detection, Lab Chip, 2015, 15(14), 3021–3029 RSC.
  17. A. Garg, et al., Zebra GC: a mini gas chromatography system for trace-level determination of hazardous air pollutants, Sens. Actuators, B, 2015, 212, 145–154 CrossRef CAS.
  18. C. V. Antoniou, E. E. Koukouraki and E. Diamadopoulos, Determination of chlorinated volatile organic compounds in water and municipal wastewater using headspace–solid phase microextraction–gas chromatography, J. Chromatogr. A, 2006, 1132(1), 310–314 CrossRef CAS PubMed.
  19. A. P. Techniquea, Method 8260B Volatile Organic Compounds by Gas Chromatography/Mass Spectrometry (GC/MS), 1996 Search PubMed.
  20. C. C. No, Method 5030C Purge-And-Trap For Aqueous Samples, 2003 Search PubMed.
  21. Q. Zhong, W. H. Steinecker and E. T. Zellers, Characterization of a high-performance portable GC with a chemiresistor array detector, Analyst, 2009, 134(2), 283–293 RSC.
  22. R.-S. Jian, et al., Field investigations and dynamic measurements of process activity induced VOCs inside a semiconductor cleanroom, Building and Environment, 2015, 94, 287–295 CrossRef.
  23. J. A. Contreras, et al., Hand-portable gas chromatograph-toroidal ion trap mass spectrometer (GC-TMS) for detection of hazardous compounds, J. Am. Soc. Mass Spectrom., 2008, 19(10), 1425–1434 CrossRef CAS PubMed.
  24. C. V. Thompson and M. G. Goedert, Field-Portable Instrumentation for Gas and Vapor Samples, Encycl. Anal. Chem., 2009 Search PubMed.
  25. E. J. Staples, T. Matsuda, and S. Viswanathan, Real time environmental screening of air, water and soil matrices using a novel field portable GC/SAW system. in Environmental Strategies for the 21st Century, Asia Pacific Conference, 1998 Search PubMed.
  26. G. W. Watson, E. J. Staples and S. Viswanathan, Performance evaluation of a surface acoustic wave analyzer to measure VOCs in air and water, Environ. Prog., 2003, 22(3), 215–226 CrossRef CAS.
  27. S. K. Kim, H. Chang and E. T. Zellers, Microfabricated gas chromatograph for the selective determination of trichloroethylene vapor at sub-parts-per-billion concentrations in complex mixtures, Anal. Chem., 2011, 83(18), 7198–7206 CrossRef CAS PubMed.
  28. F. Haghighi, Z. Talebpour and A. Sanati-Nezhad, Through the years with on-a-chip gas chromatography: a review, Lab Chip, 2015, 15, 2559–2575 RSC.
  29. M. Akbar, M. Restaino and M. Agah, Chip-scale gas chromatography: from injection through detection, Microsystems Nanoengineering, 2015, 1, 15039 CrossRef.
  30. A. Segal, et al., Development of membrane extraction with a sorbent interface–micro gas chromatography system for field analysis, J. Chromatogr. A, 2000, 873(1), 13–27 CrossRef CAS PubMed.
  31. Y. Qin and Y. B. Gianchandani, iGC1: An Integrated Fluidic System for Gas Chromatography Including Knudsen Pump, Preconcentrator, Column, and Detector Microfabricated by a Three-Mask Process, J. Microelectromech. Syst., 2014, 23(4), 980–990 CrossRef.
  32. M. Akbar, et al., A purge and trap integrated microGC platform for chemical identification in aqueous samples, Analyst, 2014, 139(13), 3384–3392 RSC.
  33. H. Kim, et al., A micropump-driven high-speed MEMS gas chromatography system, in Solid-State Sensors, Actuators and Microsystems Conference, 2007. TRANSDUCERS 2007. International, IEEE, 2007 Search PubMed.
  34. E. Zellers, et al., A micro gas chromatograph for high-speed determinations of explosive markers, in Solid-State Sensors, Actuators and Microsystems Conference (TRANSDUCERS), 2011 16th International, IEEE, 2011 Search PubMed.
  35. W. Groves, A. Grey and P. O’shaughnessy, Surface acoustic wave (SAW) microsensor array for measuring VOCs in drinking water, J. Environ. Monit., 2006, 8(9), 932–941 RSC.
  36. A. Bulbul and H. Kim, A bubble-based microfluidic gas sensor for gas chromatographs, Lab Chip, 2015, 15, 94–104 RSC.
  37. E. Ehrmann, et al., Novel column heater for fast capillary gas chromatography, J. Chromatogr. Sci., 1996, 34(12), 533–539 CAS.
  38. S. Reidy, et al., Temperature-programmed GC using silicon microfabricated columns with integrated heaters and temperature sensors, Anal. Chem., 2007, 79(7), 2911–2917 CrossRef CAS PubMed.
  39. Lee, J., et al., In situ calibration of micro-photoionization detector in multi-dimensional micro-gas chromatography system. under review.
  40. H. T. Ming, Novel microextraction techniques for aqueous environmental analysis, 2012 Search PubMed.
  41. A.-S. Allonier, et al., Determination of trihalomethanes in chlorinated sea water samples using a purge-and-trap system coupled to gas chromatography, Talanta, 2000, 51(3), 467–477 CrossRef CAS PubMed.
  42. C. Saridara, R. Brukh and S. Mitra, Development of continuous on-line purge and trap analysis, J. Sep. Sci., 2006, 29(3), 446–452 CrossRef CAS PubMed.
  43. J. F. Menéndez, et al., Static headspace, solid-phase microextraction and headspace solid-phase microextraction for BTEX determination in aqueous samples by gas chromatography, Anal. Chim. Acta, 2000, 415(1), 9–20 CrossRef.
  44. R. Sander, Compilation of Henry’s law constants (version 4.0) for water as solvent, Atmos. Chem. Phys., 2015, 15(8), 4399–4981 CAS.
  45. H. Gvirtzman and S. M. Gorelick, The concept of in situ vapor stripping for removing VOCs from groundwater, Transp. Porous Media, 1992, 8(1), 71–92 CrossRef CAS.
  46. M. Driss and M. Bouguerra, Analysis of volatile organic compounds in water by purge-and-trap and gas chromatography techniques: operational parameters optimization of the purge step, Int. J. Environ. Anal. Chem., 1991, 45(3), 193–204 CrossRef CAS.
  47. W.-C. Tian, et al., Microfabricated preconcentrator-focuser for a microscale gas chromatograph, J. Microelectromech. Syst., 2003, 12(3), 264–272 CrossRef CAS.
  48. W.-C. Tian, et al., Multiple-stage microfabricated preconcentrator-focuser for micro gas chromatography system, J. Microelectromech. Syst., 2005, 14(3), 498–507 CrossRef.

Footnotes

Electronic supplementary information (ESI) available. See DOI: 10.1039/c6ra09131h
Equal contribution.

This journal is © The Royal Society of Chemistry 2016
Click here to see how this site uses Cookies. View our privacy policy here.