Biodiesel production waste as promising biomass precursor of reusable activated carbons for caffeine removal

Mary K. S. Batista*ab, Ana S. Mestrea, Inês Matosb, Isabel M. Fonsecab and Ana P. Carvalho*a
aCentro de Química e Bioquímica, Faculdade de Ciências, Universidade de Lisboa, 1749-016 Lisboa, Portugal. E-mail: mkbatista@fc.ul.pt; ana.carvalho@fc.ul.pt; Fax: +351 217500888
bLAQV-REQUIMTE, Departamento de Química, Faculdade de Ciências e Tecnologia, Universidade Nova de Lisboa, Quinta da Torre, 2829-516 Caparica, Portugal

Received 7th April 2016 , Accepted 28th April 2016

First published on 28th April 2016


Abstract

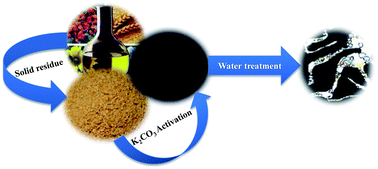
Biodiesel production generates low particle size rapeseed waste (recovered from warehouse air filtration systems) that was herein explored as promising biomass precursor of chemically activated carbons. The influence of several experimental parameters on the porosity development was investigated. No benefit was observed when solution impregnation was made nor a significant dependence of the biomass[thin space (1/6-em)]:[thin space (1/6-em)]K2CO3 ratio was observed and, as expected, high porosity development was obtained only for treatments at 700 °C. Microporous materials with apparent surface area around 1000 m2 g−1 were obtained comparing favorably with literature data regarding activated carbons from rapeseed processing by-products. A selected lab-made sample and two commercial carbons were tested as adsorbents of caffeine from aqueous solution. Although commercial materials present a quicker adsorption rate, regarding adsorption capacity the lab-made sample reaches the same value attained by a benchmark material. The regeneration tests made over the rapeseed derived carbon through heat treatments at 600 °C for 1 hour under N2 flow proved that at least two exhaustion–regeneration cycles can be made since the material retains a caffeine adsorption capacity similar to that of the fresh carbon. Therefore, a waste management problem of biodiesel industry – rapeseed residue – can be transformed in a valuable material with promising properties for environmental remediation processes.

1. Introduction

The depletion of fossil resources turned the exploitation of renewable biomass feedstocks into a research hot topic, since the use of renewable raw materials is essential to move towards sustainable development. In this sense, green catalytic processes which convert renewable commodities into chemicals, including environmentally friendly biofuels, are being extensively studied by the scientific community.

Biodiesel is an alternative diesel fuel produced by transesterification of vegetable oils using methanol or ethanol, under basic catalysis conditions.1–3 The most studied biodiesel fuel raw materials are vegetable oils obtained from palm,4 soybean,5 sunflower,6 coconut,7 rapeseed8 and tung oils.9 Unfortunately, in terms of sustainability there are still some issues to be solved since, for example, the use of inedible vegetable oils for biodiesel production generates a great amount of solid residues, which represents an environmental problem related with their adequate disposal. To turn this process more environmentally friendly, uses for such biomass waste need to be further explored.

The production of activated carbon is a promising option to convert this type of residues into valuable products. This strategy was already explored for rapeseed or canola (rapeseed variety type) processing by-products, namely meal or oil cake10–12 and stalks.13 These rapeseed-derived porous carbons were obtained by chemical (Na2CO3 and KOH) or physical (CO2 and steam) activation methodologies.10–15 However, it must be mentioned that meal or oil cake derived from low erucic acid and low glucosinolate rapeseed varieties have an important economic value, since their high protein content makes them suitable feed for livestock and poultry.16–18 Moreover, as edible and inedible oil cakes are rich in fibre, protein and energy contents they are applied in the industrial production of enzymes, antibiotics, bio-pesticides, fertilizers, vitamins, and other bio-chemicals.19

In the case of our study, the rapeseed waste used as activated carbon raw material was the solid residue recovered from the warehouse air filtration system which due to its low particle size cannot be used for biodiesel production.

The transformation of renewable biomass into carbons materials has been explored by our research group in the last years. In this context several wastes have been considered as activated carbons precursors and the results obtained with the samples prepared from cork,20,21 sisal,22 or peach stones23 showed properties similar, or even better, than those of the activated carbons currently available in the market.

This communication reports the results on the preparation and characterization of rapeseed activated carbons prepared by chemical activation with K2CO3, for the removal of caffeine. The possibility of several re-uses was also investigated. The choose of K2CO3 as activating agent was made considering previous results on various biomasses (cork or sisal) and chars (sugar-derived hydrochars or gasification chars) that proved the effectiveness of K2CO3 activation over KOH activation to tune the micropore network for an enhanced adsorption of caffeine onto activated carbons.22,24–26

Caffeine is a stimulant found in a variety of beverages, as coffee, tea, caffeinated soft drinks and numerous food products, as chocolate, pastries, and dairy desserts, being also of further importance in pharmaceuticals. Due to its high consumption in daily life products caffeine is considered a potential chemical marker for domestic wastewater contamination.27

Lastly, it must be mention that this work is a part of a larger study aiming the valorization of biodiesel by-products and so the rapeseed based activated carbons are also being assayed as catalyst for the esterification of glycerol, another residue of the biodiesel production. Thus the approach followed is in line with the concept of circular economy since the waste generated by the biodiesel industry is transformed in a new product – activated carbon – that can be used in decontamination or catalytic processes in other economic sectors.

2. Experimental section

2.1 Preparation of rapeseed based activated carbons

The activated carbon precursor used in this study was low particle size rapeseed waste (RS) recovered from the warehouse air filtration system of a biodiesel producer. The rapeseed (fraction of particles <0.297 mm) was chemically activated with K2CO3 (Aldrich, 99%) using two types of impregnation: (i) physical impregnation: the rapeseed was grinded with K2CO3; (ii) impregnation with solution: the raw material was soaked with the adequate amount K2CO3 dissolved in ca. 5 cm3 of water, at room temperature for 2 h, then dried at 100 °C until complete evaporation. Different activation temperatures (600 and 700 °C) and rapeseed[thin space (1/6-em)]:[thin space (1/6-em)]K2CO3 weight ratios (between 1[thin space (1/6-em)]:[thin space (1/6-em)]0.25 and 1[thin space (1/6-em)]:[thin space (1/6-em)]1) were used. The mixtures were activated in a horizontal furnace (Thermolyne, model 21100) under N2 flow (5 cm3 s−1). The temperature was raised (10 °C min−1) up to the activation temperature and kept for 1 h. After cooling, under N2 flow, samples were thoroughly washed with distilled water and dried at 100 °C. The materials will be named according to the expression: RS/rapeseed[thin space (1/6-em)]:[thin space (1/6-em)]K2CO3 weight ratio/activation temperature (°C). In the case of the sample obtained using impregnation with solution, an “s” is added at the end of the designation.

For benchmarking two activated carbons commercialized for water treatment were also assayed. Activated carbon designated by NS, is the material Norit SAE Super from Cabot-Norit, and activated carbon designated by CP, is the material CCP 900 from ChiemiVall.

2.2 Nanotextural and chemical characterization

The nanotextural characterization of the samples was made by N2 and CO2 adsorption isotherms at, respectively, −196 °C and 0 °C. Nitrogen data were obtained in a NOVA 2200e (Quantachrome) automatic equipment and CO2 assays were performed in a conventional volumetric apparatus equipped with a MKS-Baratron (310BHS-1000) pressure transducer (0–133 kPa). Before the isotherms acquisition the samples (≈50 mg) were outgassed overnight at 120 °C, under vacuum better than 10−2 Pa.

The surface chemistry of the samples was characterized by the determination of the pH at the point of zero charge (pHPZC), following the reversed mass titration procedure28 and the ash content of the activated carbons was evaluated according to the procedure described in ref. 29 (see ESI for detailed description).

Elemental analysis of the rapeseed based carbons was carried out in a CHNS Analyser (Thermofinnigan Flash, EA, 1112 series). Oxygen content was obtained by difference between the total percentage (100 wt%) and the sum of percentages (wt%) of carbon, hydrogen and nitrogen, since sulfur was never detected.

The surface morphology of the carbons was analyzed by scanning electron microcopy with a field emission gun (FEG-SEM) Jeol JSM-7001F equipment using an accelerating voltage of 25 kV.

2.3 Liquid phase adsorption

A selected rapeseed based activated carbon (RS/1:1/700) and the two commercial materials (CP and NS) were tested as adsorbents of caffeine (Normapur: batch 08J300011) from aqueous solution through kinetic and equilibrium studies. For kinetic studies, ca. 6.6 mg of carbon, were mixed with 10 cm3 of caffeine solution (180 mg dm−3) prepared with ultra-pure water (Milli-Q water purification systems) in glass vials. A magnetic stir bar was introduced before the vials were placed in a water bath at 30 °C (Grant GD100 controller). Time recording started when the solution was added. Stirring rate was kept at 700 rpm (multipoint agitation plate Variomag Poly) and samples were collected between 5 min and 24 h. The residual concentration of solute was determined by UV-Vis spectrophotometry (Genesys 10S UV-Vis spectrophotometer), at λmax = 273 nm. Caffeine uptake was calculated according to eqn (1)
 
image file: c6ra09006k-t1.tif(1)
where qt is the amount (mg g−1) of caffeine adsorbed at time t, C0 is the caffeine initial concentration (mg dm−3), Ct is the caffeine concentration at time t (mg dm−3), V is the volume (dm3) of the caffeine solution, and W is the weight (g) of dried carbon.

Equilibrium adsorption studies were carried out at 30 °C using always the same adsorbent dose (ca. 6 mg), varying the solution volumes (9–30 cm3) and the caffeine concentration (20–240 mg dm−3). After stirring for 6 h, equilibrium time selected from kinetic results, the concentration of caffeine remaining in solution was determined and the uptake calculated according to eqn (1). All the equilibrium adsorption assays were made in triplicate at free solution pH (≈5).

2.4 Regeneration assays

Regeneration assays were made over the exhausted RS/1:1/700 sample (in the following designated as RSCexh) obtained in the following experimental conditions: 6 mg of carbon for 30 cm3 of 180 mg dm−3 caffeine solution. After equilibrium (6 h of contact time) the solid was recovered by filtration and dried at 100 °C for 24 h. Thermal regeneration was then carried out in a horizontal furnace (Thermolyne, model 21100) under N2 flow of 5 cm3 s−1 (heating rate of 10 °C min−1). After cooled down to room temperature the sample was weighted and re-exhausted using the experimental conditions above mentioned.

The regeneration treatments were made at different temperatures 400 °C, 500 °C and 600 °C, always for 1 h, except in the case of treatments at 400 °C where regeneration for 0.25 and 1.5 h were also tested. These experimental conditions were selected considering the results of the thermogravimetric analysis of the exhausted sample. This assay was made on a TA Instruments SDT 2960 simultaneous DSC-TGA apparatus under N2 flow (30 cm3 min−1) and a heating rate of 10 °C min−1. The regenerated samples were characterized by N2 adsorption, determination of the pH at the point of zero charge, and elemental analysis. The morphology was also investigated by FEG-SEM (see Section 2.2). To complement the samples characterization infrared spectra were recorded on a Nicolet 6700 FTIR spectrometer (256 scans, resolution 4 cm−1). Samples were analyzed in the form of KBr supported pellets.

The samples obtained after each thermal regeneration will be named according to the expression: RSCexh/regeneration temperature (°C)/regeneration cycle.

The efficiency of each regeneration cycle was quantified by the regeneration efficiency (RE), defined as RE = Qi/Q0 × 100, where Qi is the adsorption capacity of the regenerated carbon in a given ith re-use cycle, and Q0 the adsorption capacity of the fresh carbon.

3. Results and discussion

3.1 Nanotextural and chemical characterization of the rapeseed based and commercial activated carbons

The N2 adsorption–desorption isotherms displayed in Fig. 1(a) are illustrative of the data obtained with all the rapeseed derived carbons showing that the materials have a micro + mesopore network. In fact, in the low relative pressure region the curves exhibit a round knee revealing the presence of a broad micropore size distribution. The mesopore network is disclosed by the upward deviation observed in the multilayer region.
image file: c6ra09006k-f1.tif
Fig. 1 (a) Nitrogen adsorption–desorption isotherms at −196 °C on the mentioned samples. Closed symbols represent desorption points. (b) SEM photograph of carbon RS/1:1/700.

From the N2 adsorption data, apparent area, ABET, was evaluated through BET equation (0.05 < p/p0 < 0.15).30 The microporosity was analysed by αS method, taking as reference the isotherm reported by Rodríguez-Reinoso et al.31 This method allowed to assess the total micropore volume, VαTOTAL, from the back extrapolation of the high relative pressure region of the αS plots, i.e. the linear region defined by experimental points correspondent to αS ≥ 1. The volume of narrow micropores (ultramicropores, width < 0.7 nm) was evaluated by the intercept of the linear range defined by the points determined between p/p0 around 0.02 and, at maximum, 0.4. The volume corresponding to this porosity is designated as VαULTRA. The volume of the larger micropores (supermicropores, width between 0.7 and 2.0 nm) was obtained by the difference VαTOTALVαULTRA.

The results obtained are presented in Table 1, along with the total pore volume, VTOTAL (estimated from volume of N2 adsorbed at p/p0 = 0.95), and mesopore volume, VMESO (obtained from the difference VTOTALVαTOTAL).

Table 1 Nanotextural characteristics of the rapeseed-based activated carbons and commercial samples used in the liquid phase assays
Sample ABET (m2 g−1) VTOTALa (cm3 g−1) VMESOb (cm3 g−1) αs method
VαTOTAL (cm3 g−1) VαULTRA (cm3 g−1) VαSUPER (cm3 g−1)
a Evaluated by the amount adsorbed at p/p0 = 0.95 in the N2 adsorption isotherm.b Calculated by the difference between VTOTAL and VαTOTAL.
Impregnation with solution
RS/1:1/700s 1165 0.57 0.09 0.48 0.29 0.19
[thin space (1/6-em)]
Physical mixing
RS/1:0.25/600 558 0.32 0.10 0.22 0.16 0.06
RS/1:0.5/600 546 0.28 0.06 0.22 0.16 0.06
RS/1:0.25/700 997 0.49 0.08 0.41 0.28 0.13
RS/1:0.5/700 1070 0.52 0.07 0.45 0.27 0.18
RS/1:0.75/700 1078 0.52 0.07 0.45 0.30 0.15
RS/1:1/700 1031 0.53 0.10 0.43 0.26 0.17
[thin space (1/6-em)]
Commercial
CP 907 0.43 0.03 0.40 0.16 0.24
NS 1065 0.70 0.30 0.40 0.02 0.38


The first conclusion that can be undertaken from the analysis of the textural parameters is that chemical activation of rapeseed with K2CO3 is a suitable methodology to obtain materials with high developed microporosity. Actually, the textural characteristics of the samples compare very favorably with those reported in literature for carbons prepared in the same experimental conditions using cork32 or sisal22,33 as raw materials.

Regarding the influence of the impregnation methodology on the textural characteristics of the carbons, the results reported in the literature for other carbon precursors (e.g. cork powder residues or sucrose-derived hydrochars) show that physical impregnation with K2CO3 leads to smaller porosity development than that achieved with impregnation with solution.25,32 The results of the rapeseed derived samples show the same trend but much smaller differences in the total and micropore volumes are observed. The values of VTOTAL and VαTOTAL presented by sample RS/1:1/700s are only, respectively, 7% and 10% smaller than those estimated for the sample RS/1:1/700s. Therefore, the study was focused only on samples obtained through physical impregnation, as this is a less energy and time consuming methodology.

Considering the influence of the different synthesis parameters in the textural properties of the lab-made materials, the results show that much higher ABET and pore volumes were always obtained for the materials prepared at 700 °C. The results demonstrate that, regardless the amount of K2CO3 present, at 600 °C the reactions between the activating agent and the matrix occur in a smaller extension, what is in agreement with the K2CO3 activation mechanism that considers that the first step of the process, i.e. K2CO3 decomposition into CO2 and K2O is significant only at temperatures higher than 700 °C.34,35

Even though the micropore volume attained dependent of the experimental conditions, especially of the calcination temperature, with samples treated at 700 °C attaining micropore volumes practically double of those presented by 600 °C treated materials, the micropore network composition of the samples is very similar. In fact, regardless the preparation conditions used the volume of the narrow micropores accounts to ca. 60–70% of the total micropore volume.

The mesopore network present in all the samples is in some cases an important fraction of the pore volume. For example in the carbon RS/1:1/700 VMESO represents almost 20% of the total pore volume.

The results obtained in the present study compare very favorably with the values reported in the literature for carbons derived from other rapeseed processing by-products, as is the case of ​ the carbons produced by Na2CO3 activation of rapeseed oil cake in the study developed by Uçar et al., that attain a BET value of 850 m2 g−1.10

The BET surface area of the carbon materials activated at 700 °C can also be compared with the values reported by Rambabu et al.11 for KOH activation of canola meal. Our values are only slightly lower (997–1078 m2 g−1 versus 1230 m2 g−1), but the micropore volume obtained with our methodology is higher (0.41–0.45 cm3 g−1 versus 0.29 cm3 g−1), as well as the percentage of narrower micropores (60% against 31% in the case of literature data). According to the literature a higher percentage of narrow micropores is a very important feature when caffeine adsorption is envisage.26

The work developed by Rambabu et al. allow us to make another type of comparison since these authors present an estimation of the carbons' production costs.11 The activation methodology followed by the authors used 3 g of KOH per gram of raw material while in our work only 0.25 g to 1 g of K2CO3 per gram of raw material was used. Concerning energy consumption, our procedure is more economic since the thermal treatment lasts only for 128 min against around 440 min, in the case of the thermal protocol followed by Rambabu et al.11

Following the rational reported by Rambabu et al.11 we estimated the production cost of material RS/1:1/700 considering its preparation yield (18%), assuming a similar cost for the rapeseed residue ($400 per ton), and considering $1000 per ton for K2CO3. The labor costs (plant work force and supervision), as well as utility costs (electricity and natural gas consumption), were calculated according with the duration of our synthesis methodology. The cost estimated is 30% lower than the value reported by Rambabu et al. for a material obtained by KOH activation of canola meal.

Both commercial activated carbons, used as benchmark in the liquid phase assays, have highly developed micropore structures. However, while in the case of sample NS the micropore structure presents almost exclusively supermicropores, sample CP has high volumes of both ultra and supermicropores. The mesopore network of the samples is also different since only sample NS has a developed mesopore network, corresponding to 43% of the total pore volume.

The micrographs depicted in Fig. S1 and 1(b) show the evolution of the rapeseed morphology for a homogeneous sponge-like aspect of the carbon material, as it was expected considering the high porosity development promoted by the preparation methodology. The morphology of carbon RS/1:1/700 has similarities with the one presented by the KOH-derived carbon obtained from canola meal by Rambabu et al.11 that looks like an organized honeycomb-like structure, however our material has higher amount of cavities with smaller dimensions.

Table S1 shows the elemental analysis of rapeseed precursor and rapeseed derived activated carbons. As it was expected the activation procedure resulted in the increase of the carbon content compared to the amount present in the pristine biomass. Simultaneously a decrease of the hydrogen, nitrogen and oxygen contents were observed. The carbon content of the rapeseed derived activated carbons is between 60.6 and 70.7%. Regarding heteroatoms, nitrogen accounts for 1.4–3.0%, and oxygen content ranges from 21.9% to 30.9%. While carbon and nitrogen percentages are similar to those reported in literature for activated carbons obtained from rapeseed by CO2 or KOH activation,11,15 the oxygen percentage is at least 10 percentual points higher. Compared to the values reported in ref. 22 for sisal based materials prepared in similar experimental conditions, the rapeseed derived carbons present a nitrogen content that is an order of magnitude higher, enlarging the range of applications of these materials. On the other hand, the high nitrogen content can explain the fact that, despite the high oxygen amount detected, the pHPZC values of the samples indicate that these materials have a neutral surface (pHPZC ∼ 7). So the acid properties associated to the surface oxygenated groups may be compensated by the basic character of the nitrogenated functionalities. It cannot also be disregarded that a fraction of the oxygen content may correspond to atoms that were incorporated within the carbonaceous matrix during the activation process, as it was suggested by the results obtained with carbons prepared from other lignocellulosic precursors.21,22,24 The commercial samples CP and NS are basic materials, in agreement with their low oxygen content, 5.6 and 4.0%, respectively.

The ash content of the rapeseed waste and activated carbon RS/1:1/700 is, respectively, 5% and 4%, being similar to the inorganic content of the commercial carbon CP (3.5%) and much lower to that of NS (13.8%).

3.2 Liquid phase adsorption

To evaluate the potentialities of rapeseed derived carbons as adsorbents of organic compounds from aqueous solutions, sample RS/1:1/700 was selected to perform kinetic and equilibrium caffeine adsorption assays. For comparison purposes commercial samples CP and NS were studied in parallel.

The kinetic curves (Fig. 2) show that in all the cases there is a very marked decay in the first 5 minutes of contact time, after what, and especially in the case of sample RS/1:1/700, the adsorption process proceeds slowly until 4 h, time at which equilibrium was attained. The results were confirmed by 24 h contact time assays that did not reveal further caffeine uptake. Concerning the removal efficiency, rapeseed derived carbon presented a value a comprised between those reached by the commercial materials, but in any case high caffeine uptakes were achieved.


image file: c6ra09006k-f2.tif
Fig. 2 Kinetic results of caffeine adsorption at 30 °C. Symbols correspond to the experimental data, whereas lines represent the fitting to the pseudo-second-order kinetic equation (6.6 mg carbon per 10 cm3 of caffeine solution with 180 mg dm−3). Error bars are included.

The experimental data were fitted to pseudo-first and pseudo-second order kinetic models.36 A better fitting to pseudo-second order model was obtained as proved, not only by correlation coefficients higher than 0.999, but also because the calculated caffeine uptakes at equilibrium, qe,calc, were similar to the experimental values, qe,exp, as quoted in Table 2.

Table 2 Pseudo-second order caffeine adsorption parameters for the rapeseed-based and commercial samples at 30 °C: qe,calc is the caffeine uptake at equilibrium, calculated by the pseudo-second order kinetic model and qe,exp is the caffeine uptake obtained directly from the experimental data
Sample R2 k2 (g mg−1 h−1) h (mg g−1 h−1) t1/2 (h) qe,calc (mg g−1) qe,exp (mg g−1) REa (%)
a RE = ((C0Ce)/C0) × 100.b Data from ref. 44.
RS/1:1/700 0.999 0.084 5000 0.049 243.9 239.1 84
CP 0.999 0.289 14[thin space (1/6-em)]286 0.016 222.2 221.5 78
NSb 0.999 0.385 23[thin space (1/6-em)]810 0.010 248.7 252.8 92


In agreement with the analysis of the decay curves configuration, the fitting of the data to the pseudo-second order kinetic model demonstrates that the initial adsorption rate (h) of the commercial carbons is one order of magnitude higher than the value computed for RS/1:1/700. According to this parameter the samples can be ordered as NS > CP > RS/1:1/700; which coincides with the sequence of the volume of larger micropores (VαSUPER). The same correlation was reported in ref. 26 being interpreted considering the molecular dimensions of caffeine (in nm) 1.06 (length) × 0.85 (width) × 0.45 (thickness) which justifies that no hindrance to caffeine diffusion within the larger micropores is expected to occur. So, once the material has a micropore network with a large percentage of supermicropores, the mesopore volume is not the key factor ruling the rate of the caffeine adsorption process.

The equilibrium adsorption isotherms of caffeine are presented in Fig. 3. The results show that for equilibrium concentrations higher than 40 mg dm−3 the behavior of the lab-made sample coincides with that of the commercial carbon CP, and that NS has the highest adsorption capacity. The results were fitted to the linear forms of Langmuir37 and Freundlich38 models, eqn (2) and (3), respectively.

 
image file: c6ra09006k-t2.tif(2)
 
image file: c6ra09006k-t3.tif(3)
where qe (mg g−1) and Ce (mg dm−3) are the caffeine uptake and the caffeine solution concentration at equilibrium, respectively, and qm (mg g−1) is the monolayer adsorption capacity. KL (dm3 mg−1) and KF (mg1−1/n (dm3)1/n g−1) are the Langmuir and Freundlich constants and 1/n is related to the adsorption affinity or surface heterogeneity.37,38


image file: c6ra09006k-f3.tif
Fig. 3 Caffeine adsorption isotherms on the mentioned carbons at 30 °C. Symbols correspond to the experimental data and lines the fitting to the Langmuir equation. Error bars are included.

The results presented in Table 3 demonstrate that in all cases the experimental data are best fitted to the Langmuir model (higher R2 and much lower χ2 values, these last ones computed following the procedure described in ref. 39). In Fig. S2 of the ESI the fitting of the experimental data to both theoretical models are presented.

Table 3 Langmuir and Freundlich isotherm parameters for the adsorption of caffeine onto the lab-made and commercial carbons, coefficients of correlation, R2, and chi-square test analysis, χ2, for the fittings
  RS/1:1/700 CP NS
a χ2 = ∑[(qeqe,m)2/qe,m], where qe is the experimental equilibrium uptake and qe,m is the equilibrium uptake calculated from the model of ref. 39.
Langmuir equation
qm (mg g−1) 226.4 227.6 296.3
b (dm3 mg−1) 0.814 2.30 0.388
R2 0.998 0.997 0.999
χ2a 4.53 8.05 2.03
[thin space (1/6-em)]
Freundlich equation
1/n 0.137 0.138 0.215
KF (mg1−1/n (dm3)1/n g−1) 120.8 140.7 115.9
R2 0.715 0.830 0.844
χ2a 11.23 38.09 28.45


In accordance with the analysis of the isotherms configuration, the values of the monolayer capacity, qm, show that the rapeseed based carbon and sample CP present similar results, which are around 75% of the value attained by sample NS. This sequence of values cannot be interpreted considering the micropore network characterization obtained through the N2 isotherms. Actually, if, for example, we consider the total micropore volume (see VαTOTAL in Table 1) we could expected that the highest qm would be obtained for sample RS/1:1/700 and no difference would be observed for the two commercial samples.

As proved in previous studies40,41 the interpretation of the liquid phase assays results implies a more detailed micropore network characterization through CO2 isotherms at 0 °C. Based on these results, the micropore size distribution of lab-made and commercial carbons was evaluated using the methodology developed by Pinto et al.42 The results displayed in Fig. 4 reveal that all the samples have bimodal distribution, with maxima at small pore diameters centered at around 0.60 nm for samples CP and RS/1:1/700, and at 0.70 nm for carbon NS.


image file: c6ra09006k-f4.tif
Fig. 4 Micropore size distribution of carbon RS/1:1/700 and commercial activated carbons, CP and VP.

According to these findings one could expected that sample RS/1:1/700 would present the highest monolayer adsorption capacity, since this is the only sample with pores in the all range of the microporosity, what would favor a more efficient packing of caffeine molecules. Considering the micropore size distribution, is was not predictable that the Langmuir constant (b) of sample CP would be one order of magnitude higher than the values estimated for sample RS/1:1/700. Actually, both materials have their maximum of the distribution close to the critical dimension of the adsorbate (∼0.45 nm) thus presenting textural properties to assure the maximization of the adsorption affinity.

The higher affinity of caffeine towards carbon CP over sample RS/1:1/700 points out the importance of surface chemistry in the adsorption mechanism of this molecule. This result is in line with previous studies26 where a high affinity of caffeine towards activated carbons with basic surface chemistry properties (as is the case of CP sample) was reported. Due to the larger difference between the experimental pH (∼5) and the pHPZC the materials have high density of surface positive charge, which enhances the interaction between the active adsorption sites with the lone pairs of the nitrogen atoms of caffeine molecule.

3.3 Regeneration assays

To select the experimental conditions to make the thermal regeneration assays the exhausted RS/1:1/700 sample (RSCexh) was characterized by thermogravimetry. The thermogram (continuous line in Fig. S3) shows that the thermal degradation occurs in two main steps: between 300 and 500 °C, where 68 wt% of the total mass loss is observed, and from 500 °C to 700 °C (the highest temperature tested), where the mass loss corresponds only to 21 wt%. The differential thermogravimetric curve (broken line in Fig. S3) clearly shows that the most import mass loss occurs when the sample is submitted to a temperature around 380 °C, which was attributed mainly to caffeine desorption. Nevertheless, the contribution of surface functionalities decomposition cannot be disregarded, due to the high oxygen content of the carbon (see Table S1). Therefore, temperatures of 400, 500 and 600 °C were selected to carry out the regeneration assays.

To establish the duration of the heat treatment three exhausted samples were regenerated at 400 °C for 0.25, 1 and 1.5 h. The N2 adsorption isotherms obtained for these samples (Fig. S4) show that upon regeneration more than half of the micropore volume of the sample was recovered. The results also show that if there is a slight benefit to extend the treatment up to 1 h, there is no advantage to continue until 1.5 h, so the duration of all further regeneration assays was 1 h.

The effect of two consecutive regeneration cycles on the adsorption behavior of the RS/1:1/700 carbon was assessed estimating the regeneration efficiency (RE), which, as defined in the experimental section, is the ratio between the amounts of caffeine adsorbed by the regenerated sample and the fresh adsorbent. The results are presented in Fig. 5 and allow to conclude that, under the experimental conditions used, thermal treatments at 400 °C does not allow an effective regeneration of the carbon since 30% of the original adsorption capacity was not recovered, conversely of what is observed when the regeneration was made at 500 or 600 °C. For these temperatures an almost complete recovery of the caffeine adsorption capacity was observed even after the second regeneration cycle. This is especially evident in the case of the sample regenerated at 600 °C.


image file: c6ra09006k-f5.tif
Fig. 5 Regeneration Efficiency (RE) of the rapeseed based activated carbon RS/1:1/700 after regeneration at 400 °C, 500 °C and 600 °C for 1 h. (RE = Qi/Q0 × 100, where Qi is the adsorption capacity of the regenerated carbon in a given re-use cycle i, and Q0 the adsorption capacity of the fresh).

The N2 adsorption isotherms of the samples obtained after the second regeneration step (Fig. S5(a)) reveal that, as expected, higher the regeneration temperature higher the micropore volume that becomes available. Actually, all the isotherms are parallel to the curve corresponding to the fresh carbon, in all relative pressure range. It is also important to note that even in the less favorable conditions (two regeneration cycles at 400 °C) more than 50% of the original microporosity is retained.

FTIR spectra of caffeine and sample RSCexh/600/2 are depicted in Fig. S5(b). The spectrum of the regenerated material presents a broad band centered at 3400 cm−1, two more define bands at 1650 cm−1 and a shoulder at around 1050 cm−1. The first can be assigned to some O–H groups of the carbon surface functionalities, and also to the stretching of N–H moiety of caffeine molecule. The other bands are assigned to the stretching of moieties present in caffeine, namely, C[double bond, length as m-dash]O and C–N.43 The observation of more intense bands characteristic of caffeine in the regenerated sample is in agreement with the results of elemental analysis which demonstrated that nitrogen amount of the regenerated sample corresponds to 12 wt% whereas in the fresh material it was only 1.5 wt%. The presence of some caffeine in the porous network is also reflected in the increase of the pHPZC towards a more basic material (8.0 instead of 7.0).

Regarding the morphology, the SEM image of sample RSCexh/600/2 reproduced in Fig. S5(c) reveals that the regeneration treatments did not lead to any change as the microphotograph is identical to that obtained with the fresh material (Fig. 1(b)).

4. Conclusions

The results obtained in this study demonstrated that chemical activation with K2CO3 is a suitable methodology to prepare rapeseed derived activated carbons with textural and surface chemistry properties appropriated to be applied as reusable adsorbents of caffeine from aqueous solution.

Regardless the amount of activating agent used, materials activated at 700 °C present apparent surface areas around 1000 m2 g−1, being the micropore network of the samples formed by a large percentage of narrow micropores.

Liquid phase assays results proved that the lab-made carbon tested is a valuable choice as adsorbent of caffeine from aqueous solution since even though the adsorption rate is slightly lower than that of the benchmark carbons tested, regarding the adsorption capacity it compares very favourably. It must also be stressed that after two exhaustion–regeneration cycles the rapeseed based carbon retains around 95% of the caffeine adsorption capacity presented by the fresh material, which is an important add-on to the advantages of this waste derived carbon material.

Finally it must be mentioned that compared with the cost production estimations reported in the literature11 the methodology followed in the present study is economically more advantageous.

Acknowledgements

The authors thank Fundação para a Ciência e Tecnologia (FCT, Portugal) for financial support through projects UID/MULTI/00612/2013 (CQB) and UID/QUI/50006/2013 (LAQV-REQUIMTE). I. M. thanks FCT for project Investigador FCT contract IF/01242/2014/CP1224/CT0008. M. K. S. B. (SFRH/PBD/84542/2012) and A. S. M. (SFRH/BPD/86693/2012) also thank FCT for their Post-doc grants. Quimitejo and Salmon & Cia, are acknowledged for providing commercial carbons CP and NS, respectively, and IBEROL – Sociedade Ibérica de Oleaginosas for supplying the rapeseed residues.

References

  1. L. Shen, H. Yin, A. Wang, Y. Feng, Y. Shen, Z. Wu and T. Fang, Chem. Eng. J., 2012, 180, 277–283 CrossRef CAS.
  2. Q. B. Liu, Z. Zhang, Y. Du, J. Li and X. Yang, Catal. Lett., 2009, 127, 419–428 CrossRef CAS.
  3. E. Tsukuda, S. Sato, R. Takahashi and T. Sodesawa, Catal. Commun., 2007, 8, 1349–1353 CrossRef CAS.
  4. S. Mekhilef, S. Siga and R. Saidur, Renewable Sustainable Energy Rev., 2011, 15, 1937–1949 CrossRef CAS.
  5. D. Yu, L. Tian, H. Wu, S. Wang, Y. Wang, D. Ma and X. Fang, Process Biochem., 2010, 45, 519–525 CrossRef CAS.
  6. D. Vujicic, D. Comic, A. Zarubica, R. Micic and G. Boskovic, Fuel, 2010, 89, 2054–2061 CrossRef CAS.
  7. J. Jiang and C. Tan, J. Taiwan Inst. Chem. Eng., 2012, 43, 102–107 CrossRef CAS.
  8. H. Shin, S. Lim, S. Kang and S. Bae, Fuel Process. Technol., 2012, 98, 1–5 CrossRef CAS.
  9. Y. Chen, J. Chen, C. Chang and C. Chang, Bioresour. Technol., 2010, 101, 9521–9526 CrossRef CAS PubMed.
  10. S. Uçar, M. Erdem, T. Tay and S. Karagöz, Clean Technol. Environ. Policy, 2015, 17, 747–756 CrossRef.
  11. N. Rambabu, V. S. K. Rao, V. R. Surisetty, U. Das and A. K. Dalai, Ind. Crops Prod., 2015, 65, 572–581 CrossRef CAS.
  12. E. David and J. Kopac, J. Anal. Appl. Pyrolysis, 2014, 110, 322–332 CrossRef CAS.
  13. O. Ioannidou and A. Zabaniotou, Renewable Sustainable Energy Rev., 2007, 11, 1966–2005 CrossRef CAS.
  14. O. A. Ioannidou, A. A. Zabaniotou, G. G. Stavropoulos, M. A. Islam and T. A. Albanis, Chemosphere, 2010, 80, 1328–1336 CrossRef CAS PubMed.
  15. J. M. Valentes Nabais, J. A. Gomes, Suhas, P. J. M. Carrot, C. Laginhas and S. Roman, J. Hazard. Mater., 2009, 167, 904–910 CrossRef PubMed.
  16. A. Rutkowski, J. Am. Oil Chem. Soc., 1971, 48, 863–868 CrossRef CAS.
  17. E. J. Booth and F. D. Gunstone, Rapeseed and Canola Oil: Production, Processing, Properties and Uses, Gunstone, USA, 2004 Search PubMed.
  18. A. C. Santos, V. E. Fabris, L. C. Basso and H. P. Haag, Composição Química e Qualidade Biológica da Torta de Colza, Piracicaba, 1988 Search PubMed.
  19. S. Ramachandran, S. K. Singh, C. Larroche, C. R. Soccol and A. Pandey, Bioresour. Technol., 2007, 98, 2000–2009 CrossRef CAS PubMed.
  20. A. P. Carvalho, B. Cardoso, J. Pires and M. Brotas de Carvalho, Carbon, 2003, 41, 2873–2884 CrossRef CAS.
  21. A. S. Mestre, J. Pires, J. M. F. Nogueira, J. B. Parra, A. P. Carvalho and C. O. Ania, Bioresour. Technol., 2009, 100, 1720–1726 CrossRef CAS PubMed.
  22. A. S. Mestre, A. S. Bexiga, M. Proença, M. Andrade, M. L. Pinto, I. Matos, I. M. Fonseca and A. P. Carvalho, Bioresour. Technol., 2011, 102, 8253–8260 CrossRef CAS PubMed.
  23. I. Cabrita, B. Ruiz, A. S. Mestre, I. M. Fonseca, A. P. Carvalho and C. O. Ania, Chem. Eng. J., 2010, 163, 249–255 CrossRef CAS.
  24. A. S. Mestre, R. A. Pires, I. Aroso, E. Fernandes, M. L. Pinto, R. L. Reis, M. A. Andrade, J. Pires, S. P. Silva and A. P. Carvalho, Chem. Eng. J., 2014, 253, 408–417 CrossRef CAS.
  25. A. S. Mestre, E. Tyszko, M. A. Andrade, M. Galhetas, C. Freire and A. P. Carvalho, RSC Adv., 2015, 5, 19696–19707 RSC.
  26. M. Galhetas, A. S. Mestre, M. L. Pinto, I. Gulyurtlu, H. Lopes and A. P. Carvalho, J. Colloid Interface Sci., 2014, 433, 94–103 CrossRef CAS PubMed.
  27. I. J. Buerge, T. Poiger, M. D. Muller and H. R. Buser, Environ. Sci. Technol., 2003, 37, 691–700 CrossRef CAS PubMed.
  28. J. S. Noh and J. A. Schwarz, J. Colloid Interface Sci., 1989, 130, 157–167 CrossRef CAS.
  29. A. S. Mestre, J. Pires, J. M. F. Nogueira and A. P. Carvalho, Carbon, 2007, 45, 1979–1988 CrossRef CAS.
  30. F. Rouquerol, J. Rouquerol and K. Sing, Adsorption by Powders and Porous Solids, Academic Press, London, 1999 Search PubMed.
  31. F. Rodríguez-Reinoso, J. M. Martin-Martinez, C. Prado-Burguete and B. McEnaney, J. Phys. Chem., 1987, 91, 515–516 CrossRef.
  32. A. P. Carvalho, M. Gomes, A. S. Mestre, J. Pires and M. Brotas de Carvalho, Carbon, 2004, 42, 672–674 CrossRef CAS.
  33. M. A. Andrade, R. J. Carmona, A. S. Mestre, J. Matos, A. P. Carvalho and C. O. Ania, Carbon, 2014, 76, 183–192 CrossRef CAS.
  34. A. S. Mestre, C. Freire, J. Pires, A. P. Carvalho and M. L. Pinto, J. Mater. Chem. A, 2014, 2, 15337–15344 CAS.
  35. J. Wang and S. Kaskel, J. Mater. Chem., 2012, 22, 23710–23725 RSC.
  36. Y. S. Ho, J. Hazard. Mater., 2006, 136, 681–689 CrossRef CAS PubMed.
  37. I. Langmuir, J. Am. Chem. Soc., 1918, 40, 1361–1403 CrossRef CAS.
  38. H. M. F. Freundlich, Phys. Chem.: Indian J., 1906, 45, 797–798 Search PubMed.
  39. Y. S. Ho, Carbon, 2004, 42, 2115–2116 CrossRef CAS.
  40. A. S. Mestre, M. Machuqueiro, M. Silva, R. Freire, I. M. Fonseca, M. S. C. S. Santos, M. J. Calhorda and A. P. Carvalho, Carbon, 2014, 77, 607–615 CrossRef CAS.
  41. M. Galhetas, M. A. Andrade, A. S. Mestre, E. Kangni-foli, M. L. Pinto and A. P. Carvalho, Phys. Chem. Chem. Phys., 2015, 17, 12340–12349 RSC.
  42. M. L. Pinto, A. S. Mestre, A. P. Carvalho and J. Pires, Ind. Eng. Chem. Res., 2010, 49, 4726–4730 CrossRef CAS.
  43. A. K. Brisdon, Inorganic Spectroscopic Methods, Oxford Science Publications, Oxford, 1998 Search PubMed.
  44. A. S. Mestre, S. C. R. Marques and A. P. Carvalho, Ind. Eng. Chem. Res., 2012, 51, 9850–9857 CrossRef CAS.

Footnote

Electronic supplementary information (ESI) available. See DOI: 10.1039/c6ra09006k

This journal is © The Royal Society of Chemistry 2016
Click here to see how this site uses Cookies. View our privacy policy here.