1,10-Phenanthroline-2,9-dicarboxamides as ligands for separation and sensing of hazardous metals

M. Alyapyshev*ab, J. Ashinab, D. Dar’inc, E. Kenfa, D. Kirsanovbc, L. Tkachenkoa, A. Leginbc, G. Starovac and V. Babainbd
aKhlopin Radium Institute, 28, 2nd Murinskiy pr., 194021, St. Petersburg, Russia. E-mail: malyapyshev@khlopin.ru; mikkaly@gmail.com
bITMO University, 49, Kronverksky pr., 197101, St. Petersburg, Russia
cInstitute of Chemistry, St. Petersburg State University, 7-9, Universitetskaya nab., 199034, St. Petersburg, Russia
dThreeArc Mining Ltd., 5, StaryTolmachevskiy per., 115184, Moscow, Russia

Received 7th April 2016 , Accepted 28th June 2016

First published on 30th June 2016


Abstract

1,10-Phenanthroline-2,9-dicarboxamides of various structures were synthesized and studied as ligands for separation and sensing of d- and f-metals. It was found that the extraction ability of dialkyl-diaryl-diamide to lanthanides decreases from La to Lu and extraction of Am is close to light lanthanides (La–Pr). Tetraalkyl-diamide are not selective to lanthanides, instead exhibiting moderate selectivity in Am/Ln separation. The diamide complexes with lanthanides and d-elements were synthesized and characterized by XRD analysis. All diamides demonstrated good extraction ability to environmentally hazardous metals (cadmium, lead and copper). The synthesized compounds were also tested as ionophores in PVC-plasticized potentiometric sensor membranes. Such sensors displayed no perceptible response to lanthanides but exhibited high sensitivity towards copper, zinc, cadmium and lead. These compositions can be considered as promising cross-sensitive sensors for multisensor systems.

Introduction

Removal of heavy metals from wastes and soils is a very urgent environmental and technological problem. Solvent extraction is one of the most popular methods for hazardous metal concentration1 and for radioactive waste processing.2 One of the most challenging tasks in HLW processing is the separation of Am and Cm from lanthanides. High selectivity of An/Ln separation has been achieved when polynitrogen extractants were employed.3,4 However, in spite of very high separation factors for americium–europium separation, all ligands proposed so far have demonstrated some disadvantages such low chemical stability, slow kinetics and limited solubility in diluents.

Recently diamides of heterocyclic acids were proposed as promising ligands for An/Ln separation.5 It was shown that pyridinedicarboxamides and dipyridyldicarboxamides are selective to actinides and can extract americium and curium from nitric acid solutions. Diamides of dipyridyldicarboxylic acid also display very high extraction capacity to cadmium along with ensuring high sensitivity and selectivity to cadmium being applied as ionophores in potentiometric membranes.6,7

Phenanthroline is a good basis for the design of preorganized ligands.8,9 Thus, 1,10-phenanthroline-2,9-dicarboxylic acid was actively studied as a complexone for actinides10–13 and also for d-elements.14 Some of hydrophilic 1,10-phenanthroline-2,9-dicarboxamides were also studied as water-soluble complexones.15,16

The complex formation of 1,10-phenanthroline-2,9-dicarboxamides with actinides, lanthanides and some other metals was modelled. It was found that these ligands possess the highest affinity to large metal ions with an ionic radius close to 1.0 Å including An(III) and Ln(III) ions, as well as other An cations such as Th(IV) and UO22+,17 and Cd(II), Bi(III) and In(III).14

Diamides of 1,10-phenanthroline-2,9-dicarboxilyc acid were recently proposed as selective extractants for americium and curium. The mixture of N,N,N′,N′-tetraoctyl-diamide of 1,10-phenanthroline-2,9-dicarboxilyc acid and Br-Cosan effectively extracts Am with a separation factor (SFAm/Eu) over 40.18 The extraction of actinides19,20 and some fission products21 by a 0.01 M solution of N,N′-diethyl-N,N′-ditolyl-2,9-diamide-1,10-phenanthroline (Et-Tol-DAPhen) in cyclohexanone was studied and a SFAm/Eu of 67 was observed. According to DFT calculations the complexation ability of diamides and actinides obeys the following order Pu(IV) > U(VI) > Pu(VI) > Np(V). These results are in good agreement with experimental data. High SFAm/Eu (up to 51) values were also demonstrated for metal extraction by 1,10-phenanthroline-2,9-dicarboxamides from perchloric media.22

Recently, it was shown23 that the extraction ability of N,N′-diethyl-N,N′-di(para-hexyl-phenyl)-1,10-phenantholine-4,7-dichloro-2,9-dicarboxamide to lanthanides decreases from La to Lu. The results of DFT modelling were in good agreement with experimental data.

It was especially interesting to study the effect of a rigid phenanthroline ligand structure on the extraction ability of tetraalkyl- and dialkyldiaryl-diamides, e.g. in Am–Ln separation and their selectivity to lanthanides. Previous data suggested that one could expect high extraction ability not only to actinides, but also to d-elements.

Complex formation of a lipophilic ligand and a metal ion is a chemical process standing behind separation in liquid extraction and sensitivity of polymeric membrane sensors. This common feature allows for wide translation of substances and research results from liquid extraction into the field of chemical sensor development. There are several reports exploring this idea.24–26 Potentiometric sensor membranes of this type are typically made of plasticized polyvinyl chloride with the addition of 2–3% of a ligand and ion-exchanger. Diamides of 1,10-phenanthroline-2,9-dicarboxilyc acid were studied as active compounds in anion and cation sensing.27–31 The idea of employing the ligands earlier, suggested in liquid extraction for sensor development, is very attractive since these substances are already well characterized and their structure–activity relationship in extraction is usually widely studied. This information significantly facilitates the development of novel sensors with required sensitivity and selectivity patterns.

The aim of this research was to research the extraction ability of several new diamides of 1,10-phenanthroline-2,9-dicarboxilyc acid towards lanthanides and other hazardous metals such as cadmium, lead, zinc and copper. Another objective was to study these new diamides as potential ionophores in potentiometric sensor membranes to produce sensors with pronounced response to lanthanides and hazardous metals. One more interesting targeted problem was the difference in the behaviour of tetraalkyldiamides and dialkyldiaryldiamides, which was observed earlier for diamides of other heterocyclic diacids.32,33

Experimental

Synthetic procedures

1,10-Phenanthroline-2,9-dicarboxylic acid (1) was prepared according to the slightly modified literature procedures.34 Diamides of 1,10-phenanthroline-2,9-dicarboxylic acid (2) were synthesized according to Scheme 1.
image file: c6ra08946a-s1.tif
Scheme 1 Synthesis of the ligands.

Acid 1 (7.0 g, 26.1 mmol) was refluxed with 120 ml of thionyl chloride for 3 hours. The excess of thionyl chloride was removed under reduced pressure. The crystalline residue was treated with n-hexane, filtered and dried in vacuo to give dichloroanhydride in quantitative yield. The obtained dichloroanhydride was added portion wise to a stirred ice-cooled solution of secondary amine (57.0 mmol) and DIPEA (60.0 mmol) in 100 ml of acetonitrile–dichloromethane (1[thin space (1/6-em)]:[thin space (1/6-em)]1). The mixture was stirred at room temperature for 1 hour followed by refluxing for 2 hours. After evaporation of solvents the residue was treated with water, the obtained crystals were filtered, washed with 2 N citric acid, sat. NaHCO3 and water, dried on air and purified by recrystallization from an appropriate solvent.

The NMR spectra of diamides 2b–d at room temperature are not informative for the structure confirmation due to dynamic rotational processes in the molecule. Thus, the spectra of these diamides were registered at 80 °C providing the normal spectral view with narrow informative signals.

N2,N2,N9,N9-Tetrabutyl-1,10-phenanthroline-2,9-dicarboxamide (2a, TBuPhen). Recrystallized from MeOH–H2O (3[thin space (1/6-em)]:[thin space (1/6-em)]1), yield 88%, colourless solid; mp 91–93 °C; 1H NMR (400 MHz, CDCl3, δ, ppm) 0.68 (6H, t, J = 7.4 Hz, CH3), 1.04 (6H, t, J = 7.4 Hz, CH3), 1.08 (4H, m, CH2CH3), 1.48 (4H, m, CH2CH3), 1.70–1.81 (8H, m, CH2CH2CH3), 3.60 (4H, m, NCH2), 3.67 (4H, m, NCH2), 7.84 (2H, s, 5-H and 6-H), 8.00 (2H, d, J = 8.3 Hz, 3-H and 8-H), 8.33 (2H, d, J = 8.3 Hz, 4-H and 7-H); 13C NMR (400 MHz, CDCl3, δ, ppm) 13.59 (CH3), 14.01 (CH3), 19.92 (CH2CH3), 20.45 (CH2CH3), 29.85 (CH2CH2CH3), 31.18 (CH2CH2CH3), 46.52 (NCH2), 49.09 (NCH2), 123.18 (3-C and 8-C), 127.11 (5-C and 6-C), 128.86 (4a-C and 6a-C), 136.77 (4-C and 7-C), 144.37 (10a-C and 10b-C), 154.69 (2-C and 9-C), 168.59 (CO). HRMS (ESI): MH+, found 491.3379. C30H42N4O2 requires 491.3381.
N2,N9-Diethyl-N2,N9-diphenyl-1,10-phenanthroline-2,9-dicarboxamide (2b, EtPhPhen). Recrystallized from MeOH, yield 74%, colourless solid; mp 200–202 °C;1H NMR (400 MHz, DMSO-d6, 80 °C, δ, ppm) 1.28 (6H, t, J = 7.1 Hz, CH3), 4.01 (4H, q, J = 7.1 Hz, CH2), 7.10 (2H, t, J = 7.3 Hz, p-Ph), 7.22 (4H, t, J = 7.3 Hz, m-Ph), 7.32 (4H, d, J = 7.3 Hz, o-Ph), 7.74 (2H, d, J = 8.1 Hz, 3-H and 8-H), 7.88 (2H, s, 5-H and 6-H), 8.36 (2H, d, J = 8.1 Hz, 4-H and 7-H); 13C NMR (400 MHz, DMSO-d6, 80 °C, δ, ppm) 13.51 (CH3), 44.97 (CH2), 122.56 (3-C and 8-C), 127.14 (p-Ph) 127.43 (5-C and 6-C), 128.58 (4a-C and 6a-C), 128.73 (o-Ph), 129.18 (m-Ph), 136.97 (4-C and 7-C), 142.31 (i-Ph), 144.51 (10a-C and 10b-C), 155.12 (2-C and 9-C), 168.32 (CO). HRMS (ESI): MH+, found 475.2125. C30H26N4O2 requires 475.2129.
N2,N9-Diethyl-N2,N9-bis(4-ethylphenyl)-1,10-phenanthroline-2,9-dicarboxamide (2c, Et(pEtPh)Phen). Recrystallized from MeOH, yield 74%, colourless solid; mp 96–97 °C; 1H NMR (400 MHz, DMSO-d6, 80 °C, δ, ppm) 1.04 (6H, br.t, J = 7.1 Hz, 4′-CH2CH3), 1.27 (6H, t, J = 7.1 Hz, NCH2CH3), 2.45 (4H, br.q, J = 7.1 Hz, 4′-CH2CH3), 3.99 (4H, q, J = 7.1 Hz, NCH2CH3), 7.05 (4H, br.d, J = 7.3 Hz, 3′-H and 5′-H), 7.24 (4H, d, J = 7.3 Hz, 2′-H and 6′-H), 7.72 (2H, d, J = 8.1 Hz, 3-H and 8-H), 7.87 (2H, s, 5-H and 6-H), 8.35 (2H, d, J = 8.1 Hz, 4-H and 7-H); 13C NMR (400 MHz, DMSO-d6, 80 °C, δ, ppm) 13.53 (NCH2CH3), 15.30 (4′-CH2CH3), 27.91 (4′-CH2CH3), 45.06 (NCH2CH3), 122.48 (3-C and 8-C), 127.38 (5-C and 6-C), 128.46 (3′-C and 5′-C), 128.55 (4a-C and 6a-C), 128.60 (2′-C and 6′-C), 136.92 (4-C and 7-C), 139.84 (1′-C), 142.74 (4′-C), 144.58 (10a-C and 10b-C), 155.29 (2-C and 9-C), 168.37 (CO). HRMS (ESI): MH+, found 531.2757. C34H34N4O2 requires 531.2755.
N2,N9-Diethyl-N2,N9-bis(4-fluorophenyl)-1,10-phenanthroline-2,9-dicarboxamide (2d, Et(pFPh)Phen). Recrystallized from MeCN, yield 65%, colourless solid; mp 225–226 °C; 1H NMR (400 MHz, DMSO-d6, 80 °C, δ, ppm) 1.28 (6H, t, J = 7.1 Hz, NCH2CH3), 4.02 (4H, q, J = 7.1 Hz, NCH2CH3), 7.02 (4H, t, J = 8.5 Hz, 3′-H and 5′-H), 7.38 (4H, d.d, J = 5.0 and 8.5 Hz, 2′-H and 6′-H), 7.80 (2H, d, J = 8.2 Hz, 3-H and 8-H), 7.91 (2H, s, 5-H and 6-H), 8.40 (2H, d, J = 8.2 Hz, 4-H and 7-H); 13C NMR (400 MHz, DMSO-d6, 80 °C, δ, ppm) 13.43 (NCH2CH3), 45.15 (NCH2CH3), 115.81 (d, 2JCF = 22.6 Hz, 3′-C and 5′-C), 122.65 (3-C and 8-C), 127.50 (5-C and 6-C), 128.68 (4a-C and 6a-C), 130.84 (d, 3JCF = 8.7 Hz, 2′-C and 6′-C), 137.07 (4-C and 7-C), 138.72 (d, 4JCF = 3.1 Hz, 1′-C), 144.46 (10a-C and 10b-C), 154.86 (2-C and 9-C), 160.93 (d, 1JCF = 244.5 Hz, 4′-C), 168.32 (CO). HRMS (ESI): MH+, found 511.1940. C30H24F2N4O2 requires 511.1940.

Extraction procedures

The extraction experiments were carried out at 20 ± 2 °C. One milliliter of organic phase and one milliliter of aqueous phase were placed in 5 ml polypropylene vials. The organic phase was pre-equilibrated by nitric acid solution with the desired concentration before extraction experiments. In extraction experiments the aqueous phase contained nitric acid of the desired concentration spiked with 241Am or 152Eu. 241Am and 152Eu tracer solutions were obtained from “Isotope” company (Russia). In americium or europium extraction the aqueous phase additionally contained 10−5 M of europium nitrate. Samples were vigorously agitated for 3 minutes. Phases were separated after a short centrifugation for 5–10 min and aliquots (0.4 ml) were taken for analysis.

The distribution ratios (D) were determined radiometrically. A DeskTop InSpector-1270 scintillation γ-spectrometer designed on the base of a well-type NaI-detector 51 × 51 mm “Canberra” Co was used for determination of americium and europium activity. The measurement error did not exceed 15%.

The extraction of lanthanides and d-elements was carried out from a multi-component solution and studied by the ICP-MS method using ELAN® DRC-e ICP-MS (Perkin Elmer, USA). The multi-component solution contained 21 metals in nitric acid of the desired concentration (Table 1).

Table 1 Composition of the multi-component solution
Metal Concentration, mg L−1 Metal Concentration, mg L−1
La 10 ± 1 Tm 8 ± 1
Ce 10 ± 1 Yb 14 ± 1
Pr 10 ± 1 Lu 10 ± 1
Nd 13 ± 1 Fe 5.4 ± 0.5
Sm 14 ± 1 Cu 8 ± 1
Eu 12 ± 1 Zn 8 ± 1
Gd 14 ± 1 Zr 6.4 ± 0.5
Tb 8 ± 1 Mo 0.6 ± 0.1
Dy 12 ± 1 Pd 8 ± 1
Ho 11 ± 1 Cd 14 ± 1
Er 12 ± 1 HNO3 1–3 M


The distribution ratio (D) was calculated as the ratio of concentrations (radioactivity counts) in organic phase and aqueous phase. The separation factor (SF) was further calculated as the ratio of D values of two metal ions.

Sensor procedures

The screening experiment with potentiometric sensors was performed first. In this experiment all four ligands (TBu-Phen, EtPh-Phen, EtpEtPh-Phen, EtpF-Phen) were incorporated into polymer sensor membranes plasticized with o-nitrophenyloctyl ether (NPOE) or with 2-fluorophenyl 2-nitrophenyl ether (2F2N). The membranes were prepared by solvent casting using freshly distilled tetrahydrofurane (THF). A membrane cocktail contained 50 mmol kg−1 of the ligand, 10 mmol kg−1 of potassium tetrakis[3,5-bis(trifluoromethyl)-phenyl borate (KTFPB) as a cation-exchanger, poly(vinylchloride) (PVC) high molecular weight (31% wt) and the rest was a solvent-plasticizer. PVC, plasticizers and KTFPB were purchased from Sigma Aldrich (Munich, Germany).

Table 2 shows the composition of the prepared sensor membranes.

Table 2 Sensor membrane compositions
Sensor type Ligand Solvent-plasticizer
s1 TBu-Phen NPOE (d4-1)
s2 TBu-Phen 2F2N (d4-2)
s3 EtPh-Phen NPOE (d1-1)
s4 EtPh-Phen 2F2N (d1-2)
s5 EtpEtPh-Phen NPOE (d2-1)
s6 EtpEtPh-Phen 2F2N (d2-2)
s7 EtpF-Phen NPOE (d3-1)
s8 EtpF-Phen 2F2N (d3-2)


After THF evaporation the membranes of 8 mm diameter were cut from the parent membrane and glued onto the top of PVC tubes (sensor bodies) with the PVC/cyclohexanone mixture. Three sensors of each composition (Table 2) were prepared. Potentiometric measurements were performed using 32-channel digital mV-meter HAN-11 (Sensor Systems LLC, St. Petersburg, Russia) against standard Ag/AgCl reference electrode ESR-10103 (Izmeritelnaya Tekhnika, Moscow, Russia) in the following galvanic cell:

Ag|[A with combining low line][g with combining low line][C with combining low line][l with combining low line], KClsat‖sample solution|sensor membrane|NaCl, 0.01 M, [A with combining low line][g with combining low line][C with combining low line][l with combining low line]|Ag.

Prior to measurements all sensors were conditioned overnight in 0.01 M NaCl. A standard glass pH-sensor ES-10601/7 (Izmeritelnaya Tekhnika, Moscow, Russia) was employed to control pH during the measurements.

Sensor sensitivity towards metal ions (Co2+, Ni2+, Cu2+, Zn2+, Cd2+, Pb2+) was studied in corresponding nitrate solutions in the concentration range 10−3 to 10−7 mol l−1. All samples were prepared by serial dilution of 1 M stock solutions by distilled water. All metal salts were from Sigma Aldrich (Munich, Germany).

Sensitivity towards lanthanide ions was studied in Nd3+, Sm3+ and Lu3+ solutions in nitric acid at pH 2 to prevent hydrolysis and to provide for the presence of Ln3+ ions in solutions. The concentration range was from 10−7 to 10−3 M of lanthanide. Sample solutions were provided by Khlopin Radium Institute (St. Petersburg, Russia).

The sensor readings (emf values in mV) were recorded after 3 minutes of measurement in each solution. Sensor sensitivity values were calculated as the slopes of the linear parts of the calibration curves (typically in 10−6 to 10−3 M range). All data presented below are averaged over 3 sensors of the same composition. After each calibration, the sensors were washed 5–7 times by the distilled water until constant potential values were reached. Sensor selectivity coefficients were calculated using the fixed interference method.35

XRD procedures

Single crystals of C68H68LaN10O10·0.75(CH2Cl2)·2(NO3), C34H34N7O11Nd·CH2Cl2 and C34H34N7O11Gd·CH2Cl2 were grown from CH2Cl2–PhCH3 (1[thin space (1/6-em)]:[thin space (1/6-em)]1) by slow evaporation at 5 °C. C68H68N8O4Cd·0.5(C6H6)·3(NO3) was grown from CH2Cl2–C6H6 (1[thin space (1/6-em)]:[thin space (1/6-em)]2) by slow evaporation at 5 °C. C68H68N8O4Cu·CH2Cl2·NO3 was grown from CH2Cl2–EtOAc (1[thin space (1/6-em)]:[thin space (1/6-em)]2) by slow evaporation at 5 °C. C68H68N8O4Zn·CH2Cl2·2(NO3)·H2O was grown from CH2Cl2–PhCH3 (1[thin space (1/6-em)]:[thin space (1/6-em)]3) by slow evaporation at 5 °C.

For single crystal XRD experiments the studied crystals were fixed on a micro mount and placed on a diffractometer and measured at 100 K using monochromated MoKα radiation. A SuperNova (Dual, Cu at zero, Atlas) diffractometer was used for crystals of La, Gd, Cd and Cu complexes. The crystals of Nd and Zn complexes were studied using a Xcalibur, Eos diffractometer.

The structure was solved using Olex2 (ref. 36) with the Superflip37 structure solution program using charge flipping for crystals of La, Cd, Nd, Gd complexes and using direct methods for crystals of Cu and Zn complexes and refined with the ShelXL38 refinement package using least squares minimization.

The carbon-bound H atoms were placed in calculated positions and were included in the refinement in the ‘riding’ model approximation with Uiso(H) set to 1.5Ueq(C) and C–H 0.96 Å for the CH3 groups and with Uiso(H) set to 1.2Ueq(C) and C–H 0.97 Å for the CH2 groups.

Results and discussion

Solubility in meta-nitrobenzotrifluoride

Diamides of heterocyclic dicarboxylic acids demonstrate the best extraction properties when polar fluorinated liquids are used as diluents as was shown in our previous works. In this study we used meta-nitrobenzotrifluoride (F-3), which is traditionally used in the radiochemical industry in Russia. Solubility of studied Phen-diamides in F-3 (at 20 °C) is as follows: ∼0.5 M for TBuPhen; ∼0.1 M for EtPhPhen; ∼0.5 M for Et(pEtPh)Phen and <0.01 M for Et(pFPh)Phen.

Et(pFPh)Phen is practically insoluble in F-3, thus it was not further studied. TBuPhen and Et(pEtPh)Phen possess the highest solubility in F-3 among all Phen-diamides (more than 0.5 mol L−1). These two compounds were selected for extraction experiments.

Extraction of f-elements (Am and lanthanides)

The extraction of Am and Eu from nitric acid solutions was studied. The dependence of distribution ratios of americium and europium on the concentration of nitric acid is presented in Fig. 1. The extraction ability of diamides to metals increases with the increase of nitric acid concentration from 0.5 to 3 M. At the same time the distribution ratios values are practically constant for extraction from 3–6 M nitric acid.
image file: c6ra08946a-f1.tif
Fig. 1 The dependence of metals distribution ratios values on HNO3 concentration, solvent – 0.05 M diamide in F-3.

The data on metal extraction dependence on diamide concentration in the organic phase are presented in Fig. 2. The distribution ratios increase with the growth of ligand concentration. The solvation numbers of Am and Eu were calculated using these data. They appeared as 1.2 (Am) and 1.1 (Eu) for TBuPhen and 1.8 (Am) and 1.6 (Eu) for Et(pEtPh)Phen.


image file: c6ra08946a-f2.tif
Fig. 2 The dependence of metal distribution ratio values on diamide concentration in F-3, aqueous phase – 3 M HNO3.

The extraction ability of diamides strongly depends on their structure. Under the identical experimental conditions the extraction ability of dialkyl-diaryl-diamide Et(pEtPh)Phen is two orders of magnitude higher than that of tetraalkyl-diamide TBuPhen. This difference can be explained by the so-called «anomalous aryl strengthening» effect that was previously reported for other diamidic ligands and CMPO. This effect suggests the increase of D values on replacement of an alkyl substituent for amidic nitrogen or aryl substituent. Introduction of an aryl substituent instead of an alkyl one should cause a decrease in the electronegativity of coordination centers (O and N) and, ultimately, to the decrease of complex stability. However, such a replacement increases the strength of the metal–ligand complex.

It was shown in ref. 39 that the reason for this effect is a lower value of “ligand pre-organization energy” of dialkyl-diaryl-diamides than that of tetraalkyl-diamides. This value is calculated as the difference in the energies of unfolded conformations of free ligands and synsyn-conformations of bound ligands.

The free ligand exists in a conformation where the carbonyl oxygen atoms are the most remote from each other. In case of 1,10-phenanthroline-2,9-dicarboxamides two nitrogens of the pyridine ring and two carboxylic oxygens may take part in complex formation with the metal. The ligand should be pre-organized and acquire another conformation to form a five-member chelate ring complex. The “pre-organization energy” necessary to acquire another conformation will be lower for Et(pEtPh)Phen than for TBuPhen. The difference of “pre-organization energy” values results in the difference of the ligand’s extraction ability.

This explanation is in a good agreement with the data published in ref. 20. The study of complexation mechanisms of phenanthrolinediamides with actinides revealed that all reactions of complex formation between actinides and 1,10-phenanthroline-2,9-dicarboxamides were energetically more favourable for dialkyl-diaryl-diamide than for tetraalkyl-diamide.

The extraction of other lanthanides was also investigated. The comparative data of lanthanides extraction from 3 M HNO3 are presented in Fig. 3.


image file: c6ra08946a-f3.tif
Fig. 3 Distribution ratio values for extraction from 3 M HNO3. Solvent – 0.05 M diamide in F-3.

The extraction ability of TBuPhen to trivalent metals is much lower: lanthanides distribution ratios do not exceed 0.1. The advantage of TBuPhen, however, is its high solubility in F-3. Therefore, D can be increased by elevated concentration of the ligand in the organic phase.

In the case of Et(pEtPh)Phen the distribution ratio values decrease with the decrease of metal ionic radii. Such dependence is in good agreement with DFT calculations published in our previous work.23 It was found there that metal-to-ligand binding energies in [(L)Ln(NO3)3] complexes decreased with the growth of lanthanide atomic number.

It should be noted that the extraction ability of Et(pEtPh)Phen toward Am and light lanthanides are very similar under selected conditions and it is not possible to separate Am from light lanthanides. The lanthanide’s extraction pattern remains the same for all nitric acid concentrations (Fig. 4).


image file: c6ra08946a-f4.tif
Fig. 4 Distribution ratio values for extraction from nitric acid. Solvent – 0.05 M Et(pEtPh)Phen in F-3.

The data on lanthanide extraction from nitric acid to 0.5 M TBuPhen in F-3 are presented in Fig. 5. The extraction ability of TBuPhen decreases from La to Gd and then increases from Gd to Lu. Such character of the extraction pattern with a breakpoint at Gd is traditional for lanthanide extraction. The increase of nitric acid concentration leads to a significant increase of heavy lanthanide extraction.


image file: c6ra08946a-f5.tif
Fig. 5 Distribution ratio values for extraction from nitric acid. Solvent – 0.5 M TBuPhen in F-3.

The selectivity of Am extraction changes with variation of acidity of the aqueous phase. The separation factors of Am and Ln are presented in Table 3. The selectivity of Am recovery increases with the increase of nitric acid concentration. The highest SF values were attained for extraction from 5 and 6 M nitric acid.

Table 3 Am/Ln separation factors
Aqueous phase SF (Am/Ln)
La Ce Pr Nd Sm Eu Gd Tb Dy Ho Er Tm Yb Lu
0.05 M Et(pEtPh)Phen in F-3
1 M HNO3 0.2 0.5 1.5 4.3 22 51 75 119 142 198 282 408 468 670
3 M HNO3 1.0 2.0 5.1 8.9 20 38 55 87 92 188 223 374 520 704
5 M HNO3 4.4 6.9 13 14 20 34 48 69 74 144 140 194 248 277
[thin space (1/6-em)]
0.5 M TBuPhen in F-3
1 M HNO3 1.0 1.0 1.2 1.3 1.6 1.7 2.0 1.8 1.9 2.0 2.4 2.1 2.1 2.3
3 M HNO3 3.3 4.1 4.1 5.2 7.3 8.9 14 12 9.2 8.4 8.4 8.8 9.5 12
5 M HNO3 6.9 6.7 6.6 7.3 8.3 8.9 14 10 6.6 5.9 5.2 4.9 4.4 4.1


The solvation numbers (SNs) were calculated using the experimental data. The SN values are presented in Table 4. Non-integer values of solvation numbers can be explained by the formation of several types of complexes in the organic phase. At least two particles such as Me(L)(NO3)3 and Me(L)2(NO3)3 can exist in the organic phase of TBuPhen, the complex with the Me[thin space (1/6-em)]:[thin space (1/6-em)]L ratio 1[thin space (1/6-em)]:[thin space (1/6-em)]1 prevailing. In the case of Et(pEtPh)Phen the same particles can be formed in the organic phase, however the predominant complex is Me(L)2(NO3)3. The process of complex formation can be described by the following equation, where n = 1 or 2:

Me3+ + 3NO3 + nL ↔ Me(L)n(NO3)3

Table 4 Solvation numbers of Am and Ln
Metal Ionic radius, Å TBuPhen Et(pEtPh)Phen
Am 0.975 1.1 ± 0.1 1.8 ± 0.1
La 1.032 1.5 ± 0.1 2.0 ± 0.1
Ce 1.010 1.4 ± 0.1 2.0 ± 0.1
Pr 0.990 1.3 ± 0.1 2.0 ± 0.1
Nd 0.983 1.1 ± 0.1 1.8 ± 0.1
Sm 0.958 1.1 ± 0.1 1.7 ± 0.1
Eu 0.947 1.1 ± 0.1 1.6 ± 0.1
Gd 0.935 1.1 ± 0.1 1.6 ± 0.1
Tb 0.923 1.2 ± 0.1 1.6 ± 0.1
Dy 0.912 1.2 ± 0.1 1.6 ± 0.1
Ho 0.901 1.2 ± 0.1 1.5 ± 0.1
Er 0.890 1.3 ± 0.1 1.6 ± 0.1
Tm 0.880 1.3 ± 0.1 1.8 ± 0.1
Yb 0.868 1.3 ± 0.1 1.7 ± 0.1
Lu 0.861 1.4 ± 0.1 1.8 ± 0.1


It should be noted that high level wastes (HLWs) may contain lanthanides from La to Gd and also Y. Americium could be recovered from HLW and transmuted in a fast neutron reactor but beforehand it should be separated from these lanthanides that are “neutron poisons”.

The obtained data confirm the high separation selectivity of americium from europium observed earlier. However, very different trends were observed for TBuPhen and Et(pEtPh)Phen. Et(pEtPh)Phen shows a significant difference in lanthanide extraction – bigger La(III) ions are 20–40 times extracted better in comparison with europium ones. This is in a good agreement with previous results for lanthanide extraction by N,N′-diethyl-N,N′-di(4-n-hexylphenyl)-4,7-dichloro-1,10-phenanthroline-2,9-dicarboxamide.23 Such trend limits the possibility of Am separation from HLW because its separation from light lanthanides is going to be unsatisfactory.

On the other hand, in spite of lower selectivity, TBuPhen Am/Eu demonstrates promising properties as a potential extractant for HLW processing. The extraction of Y with TBuPhen was also investigated. For extraction of Y from 3 M HNO3 with a 0.04 M solution of diamide in F-3, its distribution ratios do not exceed 0.02, which is enough for effective separation of Am from Y.

The solution of TBuPhen in polar diluents such as F-3 and phenyltrifluoromethyl sulfone (FS-13) exhibits high extraction ability for Am, significant metal loading capacity, fast kinetics and favourable hydrodynamic properties.

Extraction of d-elements (Cu, Zn, Cd) and Pb

The extraction of d-elements and Pb(II) by diamides from nitric acid solutions was studied. The comparative data on extraction of Cu, Zn Cd and Pb from 3 M HNO3 are presented in Fig. 6.
image file: c6ra08946a-f6.tif
Fig. 6 Metal distribution ratios for extraction from 3 M HNO3. Solvent – 0.01 M diamide in F-3. Aqueous phase – 1 × 10⁻⁴ M of each metal in 3 M HNO3.

Both ligands demonstrated very high extraction ability for Cu and Cd. Even if the concentration of diamides is as low as 0.01 M, the distribution ratios values for these metals are ≥100 for TBuPhen and Et(pEtPh)Phen. The extraction ability for Zn and Pb is much lower.

The extraction ability is somewhat different for the studied diamides. The distribution ratio values for extraction from 3 M HNO3 decrease in the row Cd > Cu > Pb > Zn for Et(pEtPh)Phen while the sequence is different (Cu > Cd > Zn > Pb) for TBuPhen.

The extraction of the same metals by a 0.01 M solution of N,N′-diethyl-N,N′-ditolyl-2,9-diamide-1,10-phenanthroline (Et-Tol-DAPhen) in cyclohexanone was studied in ref. 21. The extraction ability row of Et-Tol-DAPhen was found as follows, Cu > Pb > Zn and it coincides with the one of Et(pEtPh)Phen.

Stability constants of complex formation of unsubstituted 2,9-diamide-1,10-phenanthroline (PDAM) with different metals were determined in ref. 14. The values of log[thin space (1/6-em)]K decrease in the row Cd > Pb > Zn > Cu.

Thus, the structure of the ligand significantly influences complex formation ability with metals.

The dependence of extraction of d-elements on aqueous phase acidity was studied. The results for TBuPhen are presented in Fig. 7. Similar experiments were performed with Et(pEtPh)Phen but the data are not shown since the values of metal distribution ratios were very high and were obtained with relatively low accuracy.


image file: c6ra08946a-f7.tif
Fig. 7 Dependence of metal distribution ratios on nitric acid concentration; solvent – 0.01 M TBuPhen in F-3; aqueous phase – 5 × 10⁻⁴ M of each metal in HNO3.

The distribution ratio values of Cd, Cu and Zn increase with the increase of nitric acid concentration. In the case of Pb there is a maximum extraction ability in 1 M nitric acid.

The solvation numbers calculated on the basis of the data presented in Fig. 8 were 1.8 ± 0.1 for Cu, 1.5 ± 0.1 for Zn, 1.5 ± 0.1 for Cd and 1.0 ± 0.1 for Pb. The values of solvation numbers tend to decrease with the increase of metal ionic radius in the next row: Cu (0.57 Å), Zn (0.74 Å), Cd (0.96 Å) and Pb (1.19 Å).


image file: c6ra08946a-f8.tif
Fig. 8 Dependence of metal distribution ratio values on TBuPhen concentration; aqueous phase – 5 × 10⁻⁴ M of each metal in 0.5 M HNO3.

The structures of Ln(III) complexes

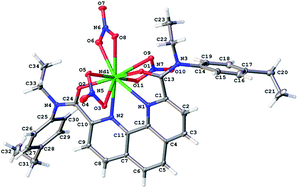
In order to understand the mechanism of metal–ligand complex formation and the differences between the solvation number values, we synthesized the solid complexes of Et(pEtPh)Phen with several lanthanides (La, Nd and Gd) and studied them by XRD analysis. Crystal structures of La(III)–ligand and Nd–ligand complexes are shown in Fig. 9 and 10, the structure of Gd(III)–ligand complex is presented in Fig. S1, ESI, and X-ray crystallographic data are summarized in Table S1, ESI.
image file: c6ra08946a-f9.tif
Fig. 9 X-ray crystal structure of the [La(L)2(NO3)2]+ complex L = Et(pEtPh)Phen. Selected bond lengths (Å): La–O1 2.578(2), La–O2 2.689(2), La–O3 2.709(2), La–O4 2.654(2), La–N1 2.833(3), La–N2 2.834(3). Dark blue, blue, red, gray and white colors denote La, N, O, C and H atoms, respectively.

image file: c6ra08946a-f10.tif
Fig. 10 X-ray crystal structure of the Nd(L)(NO3)3 complex. L = Et(pEtPh)Phen. Selected bond lengths (Å): Nd–O9 2.555(6), Nd–O3 2.533(6), Nd–O5 2.517(6), Nd–O1 2.510(6), Nd–O8 2.565(6), Nd–O11 2.600(6), Nd–O6 2.553(6), Nd–O2 2.389(6), Nd–N1 2.599(6), Nd–N2 2.636(7). Green, blue, red, gray, and white colors denote Nd, N, O, C and H atoms, respectively.

The crystal structure of the La–Et(pEtPh)Phen complex is presented in Fig. 9. A symmetrical complex is formed by two rigid ligands and two nitrate groups. La(III) is 12-coordinated and forms eight bonds with ligands (four bonds with nitrogen atoms of phenanthroline moieties and four bonds with oxygen atoms of carboxylic groups) and four bonds with oxygen atoms of two nitrates groups. It is remarkable that the deviation of carbonyl oxygen atoms from the phenanthroline plane is different. The deviation of O2 is higher than that of O1 (1.030(4) Å and 0.707(4) Å, correspondingly) and both carbon atoms of the carboxylic groups do not lie in a phenanthroline plane. Only two nitrate ions take part in complex formation while the third nitrate anion is in the second coordination layer for keeping the charge balance.

The crystal structure of Nd–Et(pEtPh)Phen complex is shown in Fig. 10. The neodymium complex is formed by one rigid ligand and three nitrate groups. Nd3+ is 10-coordinated and forms four bonds with the ligand (two bonds with nitrogen atoms of the phenanthroline moiety and two bonds with oxygen atoms of carboxylic groups) and six bonds with oxygen atoms of three nitrate ions. Just like in the case of the La complex the deviation of carbonyl oxygen atoms from the phenanthroline plane is different. The deviation of O1 is higher than that of O2 (0.886(9) Å and 0.20(1) Å, correspondingly). The carbon atom of the O2 lies in the phenanthroline plane. The metal is fully located in the phenanthroline plane.

The crystal structure of Gd–Et(pEtPh)Phen complex is shown in Fig. S1, ESI. Similar to neodymium, the complex of gadolinium is formed by one rigid ligand and three nitrate groups. Gd3+ is 10-coordinated and forms four bonds with ligand (two bonds with nitrogen atoms of the phenanthroline moiety and two bonds with oxygen atoms of the carboxylic groups) and six bonds with oxygen atoms of three nitrates. The deviation of O1 (0.894(8) Å) from the phenanthroline plane is higher than O2 (0.237(9) Å). A carbon atom of the O2 lies in the phenanthroline plane. The metal is fully located in the phenanthroline plane.

A similar trend was observed in the extraction and XRD data. Lanthanides solvate numbers calculated on the basis of the extraction data decrease with the decrease of the ionic size. Rather small ions of Nd3+ and Gd3+ form a complex with one molecule of Et(pEtPh)Phen, whereas the bigger La3+ ion produces a complex with two molecules of the ligand. Diamides act as tetradentate ligands in all lanthanide complexes.

Complexes of U(VI) and Th(IV) with phenanthrolinediamides were studied earlier.19 It was shown that 1[thin space (1/6-em)]:[thin space (1/6-em)]1 metal–ligand complexes were obtained and both complexes are tetradentate.

The structures of d-element complexes

We also synthesized Et(pEtPh)Phen complexes with d-elements such as Cu, Zn and Cd. Crystal structures of the Cu–ligand and Cd–ligand complexes are shown in Fig. 11 and 12. The crystal structure of the Zn–ligand complex is presented in Fig S2, ESI.
image file: c6ra08946a-f11.tif
Fig. 11 X-ray crystal structure of the [Cu(L)2]2+complex. L = Et(pEtPh)Phen. Selected bond lengths (Å): Cu–O2A 2.068(2), Cu–N1 1.971(2), C–N2 2.245(3), Cu–N1A 2.156(3), Cu–N2A 1.919(3). Green, blue, red, gray, and white colors denote Cu, N, O, C, and H atoms, respectively.

image file: c6ra08946a-f12.tif
Fig. 12 X-ray crystal structure of the [Cd(L)2]2+ complex. L = Et(pEtPh)Phen. Selected bond lengths (Å): Cd–O2A2 2.469(2), Cd–N1A2 2.362(2), Cd–O1A2 2.468(2), Cd–O1 2.499(2), Cd–N2 2.339(2), Cd–N2A2 2.353(2), Cd–N1 2.371(2). Dark blue, blue, red, gray, and white colors denote Cd, N, O, C, and H atoms, respectively.

The crystal structure of the Cu–Et(pEtPh)Phen complex is presented in Fig. 11. The copper complex is formed by two rigid ligands. Cu2+ is 5-coordinated (next nearest atom is O1A located at 2.531(4) Å): two nitrogen atoms of each of the phenanthroline moieties and one oxygen atom of the amide moiety are involved in this coordination. All five bonds form a distorted tetragonal pyramid with the N2 atom on the top. Thus, the ligands are bonded with Cu2+ in a different way.

The deviations of carbonyl oxygen atoms from phenanthroline planes are different. The O2A atom lies practically in the phenanthroline plane of its ligand while O1A, O1 and O2 atoms deviates by −0.903(4) Å, 0.632(3) Å and −1.0404(0.004) Å, correspondingly. Also all carbon atoms do not lie in phenanthroline planes. Nitrate ions are in the second coordination layer.

Such surroundings of copper in the studied complexes differ significantly from the one published in ref. 21 where the Cu2+ coordination number was 6 and the Phen–diamide–Cu complex was formed by two nitrogen atoms and one oxygen atom of each ligand (distorted octahedral structure). These differences in coordination numbers can be explained by the differences of the ligand’s structure (the substituents at C28 and C17 in the studied ligands are –CH2–CH3 groups and in the structure published in ref. 21 the substituents are the –CH3 group) and the presence of the CH2Cl2 molecule that was used as a solvent during crystal synthesis in the studied Cu-complex structure. The CH2Cl2 molecule was omitted in Fig. 12. At the same time the results of FTIR-spectroscopy investigations published in ref. 19 admitted the formation of a single crystal in which no oxygen atom or only one single oxygen atom coordinates with small copper ions.

The crystal structure of the Zn–Et(pEtPh)Phen complex is shown in Fig. S2, ESI. The complex is formed by two rigid ligands. The coordination number of Zn2+ in this complex is 5. Two nitrogen atoms of each phenanthroline moieties and one oxygen atom of one amide moiety are involved in the coordination. These bonds form a distorted tetragonal pyramid with N2A on top. Thus, the ligands are bonded with zinc in different ways.

The O1 atom lies practically in the phenanthroline plane of its ligand and O1A, O2A and O2 atoms deviates by 0.620(5) Å, −0.969(6) Å, and −0.833(5) Å, correspondingly. The carbonyl atom C13A lies in the phenanthroline plane of its ligand and the remaining carbon atoms deviate significantly from their ligand’s planes. Nitrate ions are in the outer coordination sphere.

The crystal structure of the Cd–Et(pEtPh)Phen complex is shown in Fig. 12. Two ligand molecules take part in complex formation. The coordination number of Cd2+in this complex is 7 (next nearest atom – O1A located at 2.655(2) Å). The four bonds are formed with nitrogen atoms of phenanthroline moieties and three bonds are formed with carbonyl oxygen atoms of both ligands. Thus, the ligands are bonded with Cd(II) differently: one of them forms the four bonds (two bonds with nitrogen atoms of phenanthroline and two bonds with oxygen atoms of both carbonyl groups), while the other forms three bonds only (two bonds with nitrogen atoms of phenanthroline and one bond with the oxygen atom of the one carbonyl group). All oxygen atoms of carbonyl groups are bonded with cadmium (O1A, O2A and O1) while unbounded O2 deviate from the phenanthroline planes of their ligands significantly. The deviations are −0.241(0.003) Å for O1A, −0.486(0.003) Å for O2A, −0.486(0.003) Å for O1 and −1.126(0.003) Å for O2. Carbon atoms of carbonyl groups (C13 and C13A) lie practically in phenanthroline planes but C24 and C24A are deviated (−0.311 (0.003) Å and −0.133(0.003) Å, correspondingly). Nitrate ions are in the outer coordination sphere.

Thus, the metal is coordinated with two ligands in all studied d-element complexes. The Et(pEtPh)Phen solvate number in all these crystals is equal to 2.

The metal’s coordination number values tend to increase with the increase of ionic radius. The coordination number is equal to 5 for Cu2+ (0.57 Å) and Zn2+ (0.74 Å) and in the case of the bigger Cd2+ ion (0.96 Å) the coordination number is 7.

It is likely that the better extraction ability of Cd compared to Zn can be explained not only by the soft character of Cd but also by the higher value of its coordination number.

Sensors

The observed behavior of the synthesized ligands as extractants for lanthanides and transition metals appears being very promising from the point of view of their employment as ionophores in chemical sensors. This application may be twofold: the ligands providing sharp selectivity towards particular metals can be used for construction of selective sensors for individual ions, while those without sharp selectivity can be still successfully applied in multisensor systems (“electronic tongues”).40

Since the designed ligands show high affinity towards lanthanide sensors, sensitivity to these ions was checked first. Calibration measurements in neodymium, samarium and lutetium solutions were performed for this purpose. None of the studied sensors displayed reasonable sensitivity towards lanthanides and all values of the slopes of calibration curves were below 7 mV dec−1, which is too low to be relevant for any practical application. Such a sharp difference between extraction and sensor behavior of the ligands may be attributed to the obvious difference in experimental conditions: solvent (solvent-plasticizer in the case of sensor membranes) polarity, media viscosity, etc.

A sensor’s sensitivity to transition metals was studied afterwards. The first measurements showed a high super-Nernstian response (exceeding the theoretical value of 29.5 mV dec−1 for Me2+) reaching up to 70 mV dec−1 in some cases. Such a performance can be attributed to non-compensated ion flux into the membrane due to formation of a very strong complex between the metal and ligand. Reproducibility of the sensors in the replicated measurements was quite poor (around ±5 mV dec−1). In order to improve this behavior we modified sensor compositions and measurement conditions. At this stage new sensor membranes based on TBuPhen and Et(pFPh)Phen were prepared with two solvent-plasticizers (NPOE and 2F2N). The content of the ion-exchanger (KTFPB) was increased up to 50 mmol kg−1 to minimize co-ion extraction. The inner electrolyte solution was 0.001 M CdCl2 and all new sensors were conditioned in this solution overnight prior to experiments. Sensitivity of the sensors was studied in Zn2+, Cu2+, Cd2+, Pb2+ solutions. The results are shown in Table 5.

Table 5 Sensitivity of the second set of sensors, mV dec−1
  TBuPhen-NPOE TBuPhen-2F2N Et(pFPh)Phen-NPOE Et(pFPh)Phen-2F2N
Zn2+ 17 ± 2 18 ± 3 22 ± 1 23 ± 1
Cu2+ 24 ± 2 18 ± 1 23 ± 3 26 ± 2
Cd2+ 26 ± 2 23 ± 3 27 ± 2 20 ± 1
Pb2+ 31 ± 1 29 ± 1 26 ± 2 34 ± 2


In this new experimental layout, the Nernstian response to cadmium and lead was observed for most of the sensors. No sensitivity to cobalt and nickel was found. The use of the 2F2N plasticizer, in general, provides for lower sensitivity values. Sensor selectivity was studied using the fixed interference method. Selectivity coefficients to zinc, copper and lead were measured in the presence of cadmium. No sharp selectivity towards a particular metal was observed, log[thin space (1/6-em)]KpotCd/Me were around zero for zinc and copper and around 0.5 for lead. When comparing these results with the data on potentiometric sensors based on 2,2’-dipyridyl-6,6-dicarboxylic acid diamides6,7 and dipicolinamide41,42 one can see that less rigid dipyridyldiamide and dipicolindiamide structures allow for more selective cadmium and lead sensors, correspondingly. This selectivity is lost with a planar phenantrolinediamide ligand and the latter ligand forms equally strong complexes with zinc, copper, cadmium and lead. These results are summarized in Table 6 below. The observed behavior (cross-sensitivity without sharp preferences) can be beneficial for the sensors intended for multisensor arrays.40

Table 6 Comparison of sensing properties of different diamidic ligands
Ligand Sensitivity towards lanthanides Sensitivity towards transition metals
Dipicolinic acid diamides41,42 Moderate sensitivity to all lanthanides (up to 10 mV dec−1) or no sensitivity High sensitivity towards all metals. Good selectivity to lead
2,2′-Dipyridyl-6,6-dicarboxylic acid diamides6,7 High sensitivity. Heavy lanthanides are preferred by sensors based on aryl-substituted ligands. No sharp preferences for alkyl-substituted ones High sensitivity towards all metals. Good selectivity to cadmium
Phenantroline dicarboxylic acid diamides No sensitivity to lanthanides High sensitivity towards all metals. No sharp selectivity towards particular metals


Conclusions

Four novel diamides of 1,10-phenanthroline-2,9-dicarboxylic acid were synthesized and characterized. Their performance as potential ligands for liquid extraction separation of hazardous metals including f-elements (Am, lanthanides), d-elements (Cd, Zn, Cu) and Pb was studied.

It was found that tetrabutyl-diamide shows the most promising behavior in separation of americium from lanthanides. In spite of a high (around 40) Am/Eu separation factor for diethyl-di(ethylphenyl)-diamide, it cannot provide separation of Am from La and Ce. Tetrabutyl-diamide possesses moderate Am/Ln separation factors (3–5). However, these values are sufficient for complete Am separation during the extraction process.

Crystalline complexes of diethyl-di(ethylphenyl)-diamide with lanthanides and d-elements were synthesized and characterized by XRD analysis. X-ray crystallographic structures confirm that the La3+ ion is coordinated with two ligands and smaller Gd3+ and Nd3+ ions form complexes in 1[thin space (1/6-em)]:[thin space (1/6-em)]1 coordination mode. All studied transition metals (Cu2+, Zn2+, Cd2+) form complexes with a 1[thin space (1/6-em)]:[thin space (1/6-em)]2 metal[thin space (1/6-em)]:[thin space (1/6-em)]ligand ratio.

The same four diamides were also studied as ionophores in PVC-plasticized potentiometric chemical sensors. No significant response to lanthanides was found, but rather high electrochemical sensitivity to toxic metal cations (such as zinc, copper, cadmium and lead) was observed. Selectivity values of these new sensors do not allow for selective determination of single ions by discrete sensors, however, the sensors appear to be promising for multisensor arrays due to their cross-sensitivity.

Acknowledgements

This work was partially financially supported by Government of Russian Federation, Grant 074-U01. XRD analysis was performed at the Research Centre for X-ray Diffraction Studies of St. Petersburg State University.

Notes and references

  1. Y. Li, X. Hu, X. Song, Y. Hou and Q. Guo, RSC Adv., 2015, 92, 75033 RSC.
  2. Solvent extraction principles and practice, revised and expanded, ed. J. Rydberg, CRC Press, 2004 Search PubMed.
  3. Z. Kolarik, Chem. Rev., 2008, 108, 4208 CrossRef CAS PubMed.
  4. M. J. Hudson, L. M. Harwood, D. M. Laventine and F. W. Lewis, Inorg. Chem., 2012, 52, 3414 CrossRef PubMed.
  5. M. Y. Alyapyshev, V. A. Babain and L. I. Tkachenko, Radiochemistry, 2014, 56, 565 CrossRef CAS.
  6. M. Alyapyshev, V. Babain, N. Borisova, I. Eliseev, D. Kirsanov, A. Kostin, A. Legin, M. Reshetova and Z. Smirnova, Polyhedron, 2010, 29, 1998 CrossRef CAS.
  7. D. O. Kirsanov, N. E. Borisova, M. D. Reshetova, A. V. Ivanov, L. A. Korotkov, I. I. Eliseev, M. Y. Alyapyshev, I. G. Spiridonov, A. V. Legin, Y. G. Vlasov and V. A. Babain, Russ. Chem. Bull., 2012, 61, 881 CrossRef CAS.
  8. A. Bencini and V. Lippolis, Coord. Chem. Rev., 2010, 254, 2096 CrossRef CAS.
  9. R. D. Hancock, Chem. Soc. Rev., 2013, 42, 1500 RSC.
  10. Y. Yang, Z. Zhang, S. Luo and L. Rao, Eur. J. Inorg. Chem., 2014, 2014, 5561 CrossRef CAS.
  11. A. B. Yusov, I. A. Charushnikova, A. M. Fedoseev and A. A. Bessonov, Radiochemistry, 2004, 56, 134 CrossRef.
  12. M. D. Ogden, S. I. Sinkov, M. Nilson, G. J. Lumetta, R. D. Hancock and K. L. Nash, J. Solution Chem., 2013, 42, 211 CrossRef CAS.
  13. D. Manna and T. K. Ghanty, Phys. Chem. Chem. Phys., 2012, 14, 11060 RSC.
  14. D. Merrill, J. M. Harrington, H. S. Lee and R. D. Hancock, Inorg. Chem., 2011, 50, 8348 CrossRef CAS PubMed.
  15. S. Scaravaggi, E. Macerata, M. Galletta, E. Mossini, A. Casnati, M. Anselmi, F. Sansone and M. Mariani, J. Radioanal. Nucl. Chem., 2015, 330, 1811 Search PubMed.
  16. R. T. Gephart III, N. J. Williams, J. H. Reibenspies, A. S. De Sousa and R. D. Hancock, Inorg. Chem., 2008, 47, 10342 CrossRef PubMed.
  17. D. Merrill and R. D. Hancock, Radiochim. Acta, 2011, 99, 161 CrossRef CAS.
  18. M. Galletta, S. Scaravaggi, E. Macerata, A. Famulari, A. Mele, W. Panzeri, F. Sansone, A. Casnati and M. Mariani, Dalton Trans., 2013, 42, 16930 RSC.
  19. C.-L. Xiao, C.-Z. Wang, L.-Y. Yuan, B. Li, H. He, S. Wang, Y.-L. Zhao, Z.-F. Chai and W. Q. Shi, Inorg. Chem., 2014, 53, 1712 CrossRef CAS PubMed.
  20. C.-L. Xiao, Q.-Y. Wu, C.-Z. Wang, Y.-L. Zhao, Z.-F. Chai and W.-Q. Shi, Inorg. Chem., 2014, 53, 10846 CrossRef CAS PubMed.
  21. C.-L. Xiao, Q.-Y. Wu, L. Mei, L.-Y. Yuan, C.-Z. Wang, Y.-L. Zhao, Z.-F. Chai and W.-Q. Shi, Dalton Trans., 2014, 43, 12470 RSC.
  22. D. Manna, S. Mula, A. Bhattacharyya, S. Chattopadhyay and T. K. Ghanty, Dalton Trans., 2015, 44, 1332 RSC.
  23. Y. A. Ustynyuk, N. E. Borisova, V. A. Babain, I. P. Gloriozov, A. Y. Manuilov, S. N. Kalmykov, M. Y. Alyapyshev, L. I. Tkachenko, E. V. Kenf and N. A. Ustynyuk, Chem. Commun., 2015, 51, 7466 RSC.
  24. A. V. Legin, V. A. Babain, D. O. Kirsanov and O. V. Mednova, Sens. Actuators, B, 2008, 131, 29 CrossRef CAS.
  25. V. P. Solov’ev, A. Varnek and G. Wipff, J. Chem. Inf. Comput. Sci., 2000, 40, 847 CrossRef.
  26. M. C. Aragoni, M. Arca, A. Bencini, S. Biagini, A. J. Blake, C. Caltagirone, F. Demartin, G. De Filippo, F. A. Devillanova, A. Garau, K. Gloe, F. Isaia, V. Lippolis, B. Valtancoli and M. Wenzel, Inorg. Chem., 2008, 47, 8391 CrossRef CAS PubMed.
  27. Y. H. Qiao, H. Lin and H. K. Lin, Can. J. Chem., 2006, 84, 1155 CrossRef CAS.
  28. M. S. Goodman, A. D. Hamilton and J. Weiss, J. Am. Chem. Soc., 1995, 117, 8447 CrossRef CAS.
  29. N. Kaur and P. Alreja, Tetrahedron Lett., 2015, 56, 182 CrossRef CAS.
  30. J. Shao, Y. H. Qiao, H. Lin and H. K. Lin, J. Lumin., 2008, 128, 1985 CrossRef CAS.
  31. G. M. Cockrell, G. Zhang, D. G. Van Derveer, R. P. Thummel and R. D. Hancock, J. Am. Chem. Soc., 2008, 130, 1420 CrossRef CAS PubMed.
  32. M. Y. Alyapyshev, V. A. Babain, L. I. Tkachenko, I. I. Eliseev, A. V. Didenko and M. L. Petrov, Solvent Extr. Ion Exch., 2011, 29, 619 CrossRef CAS.
  33. M. Y. Alyapyshev, V. A. Babain, L. I. Tkachenko, A. Paulenova, A. A. Popova and N. E. Borisova, Solvent Extr. Ion Exch., 2014, 32, 138 CrossRef CAS.
  34. S. T. Mullins, P. G. Sammes, R. M. West and G. Yahioglu, J. Chem. Soc., Perkin Trans. 1, 1996, 1996, 75 RSC.
  35. E. Bakker, P. Bühlmann and E. Pretsch, Chem. Rev., 1997, 97, 3083 CrossRef CAS PubMed.
  36. O. V. Dolomanov, L. J. Bourhis, R. J. Gildea, J. A. K. Howard and H. Puschmann, J. Appl. Crystallogr., 2009, 42, 339 CrossRef CAS.
  37. L. Palatinus and G. Chapuis, J. Appl. Crystallogr., 2007, 40, 786 CrossRef CAS.
  38. G. M. Sheldrick, Acta Crystallogr., Sect. A: Found. Crystallogr., 2008, 64, 112 CrossRef CAS PubMed.
  39. Y. A. Ustynyuk, I. P. Gloriozov, S. N. Kalmykov, A. A. Mitrofanov, V. A. Babain, M. Y. Alyapyshev and N. A. Ustynyuk, Solvent Extr. Ion Exch., 2014, 32, 508 CrossRef CAS.
  40. D. Kirsanov, V. Babain and A. Legin, Developing sensing materials for multisensor systems on the basis of extraction data, in Multisensor systems for chemical analysis: materials and sensors, ed. L. Lvova, D. Kirsanov, C. Di Natale and A. Legin, Pan Stanford Publishing Pte. Ltd, 2014, pp. 1–40 Search PubMed.
  41. I. G. Spiridonov, D. O. Kirsanov, V. A. Babain, M. Y. Alyapyshev, I. I. Eliseev, Y. G. Vlasov and A. V. Legin, Russ. J. Appl. Chem., 2011, 84, 1354 CrossRef CAS.
  42. D. O. Kirsanov, O. V. Mednova, E. N. Pol’Shin, A. V. Legin, M. Y. Alyapyshev, I. I. Eliseev, V. A. Babain and Y. G. Vlasov, Russ. J. Appl. Chem., 2009, 82, 247 CrossRef CAS.

Footnote

Electronic supplementary information (ESI) available: Crystal data. CCDC 1404514, 1404714, 1428486, 1413528, 1428488 and 1061119. For ESI and crystallographic data in CIF or other electronic formats see DOI: 10.1039/c6ra08946a

This journal is © The Royal Society of Chemistry 2016
Click here to see how this site uses Cookies. View our privacy policy here.