DOI:
10.1039/C6RA08900C
(Paper)
RSC Adv., 2016,
6, 51941-51956
Modelling of oxygen-evolving-complex ionization dynamics for energy-efficient production of microalgal biomass, pigment and lipid with carbon capture: an engineering vision for a biorefinery†
Received
6th April 2016
, Accepted 13th May 2016
First published on 17th May 2016
Abstract
The success of algal biotechnology research lies in the development of economically-and-environmentally sustainable biorefineries for food, feed, fuel, and value-added products with carbon capture. The spatiotemporal availability and utilization of light for photolysis of water, mediated by the oxygen-evolving-complex (OEC), are of core importance to algal biomass production, because electrogenesis drives photosynthesis. Therefore, a comprehensive Light Harvesting Model (LHM) was formulated in the present study, using first principles, to estimate the growth of the model-microalga Chlorella vulgaris in flat panel reactors (FPRs). LHM was found to accurately estimate algal growth, photoinhibition and photoacclimation, in light-sufficient and light-limited regimes, using experimental and literature data. Other major findings are that LHM could (a) accurately predict the specific growth rate of algae as a function of the number of photons supplied per unit time per unit FPR volume, (b) successfully track the photooxidation-induced loss of quantum yield and consequent algal death at high light intensities, (c) stochastically estimate the exacerbation of quantum yield losses due to bulk mixing, light attenuation and intercellular self-shading culminating in the cessation of algal growth at high biomass densities and (d) be used for photobioreactor scale-up. Finally, the utility of LHM in energy-efficient algal biorefineries (5.82% photosynthetic efficiency) for biomass (0.83 kg m−3 d−1), lipid (8.8 kg kg−1 biomass) and chlorophyll (8.5 g kg−1 biomass) production with associated carbon capture (50% biomass) was demonstrated. To the best of our knowledge, LHM is the first to successfully establish the role of OEC ionization dynamics during photoinhibition in algae.
Introduction
In recent years, microalgae have created a significant impact among scientists, industrialists and world leaders for the production of commercially valuable products including biofuels, carotenoids, biofertilizer and animal feed.1 In addition, algae have emerged as potential candidates for carbon dioxide (CO2) sequestration due to their innate potential to capture 50% carbon on a dry weight basis.2 The commercial cultivation of microalgae is generally carried out using photobioreactors. The techno-economic feasibility, life cycle analyses and energy ergonomics of algal biorefineries are principally determined by high biomass productivities at low operational costs. Thus, algal growth kinetic models (AGKMs), which are used for algal photobioreactor design, operation and productivities are of immense significance to the algal industry.3
Light is the primary energy source for photosynthesis and it directly influences the specific growth rate (μ) of phototrophic microorganisms. Many AGKMs exist in the literature of various complexities4 such as, (a) lump models where incident light intensity or average light intensity within the photobioreactor is used to determine μ of the entire vessel, (b) transport models where variation of flow, CO2–O2 concentrations, light gradients (and subsequently μ) are computed across vessel and (c) meso-scale models which are inclusive of algal biochemistry, flow and gas concentration fluctuations and light availability in the vicinity of algal cells. Lumped models are computationally inexpensive and easily integrated with optimization tools for photobioreactor design. However, they are the least accurate. Transport and meso-scale models, though more accurate, are computationally costly and it is difficult to use them for reactor design optimization. The models may also be empirical in nature.5,6
Recent AGKMs focus on the biochemistry at photosystem II (PSII) because the Mn4CaO5 cluster containing oxygen-evolving-complex (OEC) of PSII is the site of electrogensis.7 However, it is also the site for photoinhibition which limits photosynthesis.8,9 Many AGKMs10–14 have modelled the photosynthesis and degradation of PSII with some success. However, the decay of OEC ionization states during 0.5 ms exposure to dark after being exposed to light15 were disregarded during AGKM development. Furthermore, the models are unable to forecast photooxidative death of algae at high light intensities.16,17 Also, changes in algal growth caused by illumination duration are modelled independently of light intensity.18,19
The purpose of the present study is to develop and validate a stochastic model which incorporates some of the necessary aspects of transport and meso-scale models, for improved predictability, increased scientific rigor, higher accuracy and lower computational costs. The study analyzed the combined effects of incident light intensity, illumination time, photobioreactor geometry, light attenuation in the reactor, cell cycling frequencies (between light and dark) due to bulk mixing, PSII degradation, self-shading, OEC ionization dynamics and cell maintenance losses on μ. With the exception of self-shading, the remaining parameters were modelled via first principles. The model was also found valid when CO2 was externally supplied. To the best of our knowledge, this is the first report modelling the reduction in quantum yield of photosynthesis due to OEC state decay. Chlorella vulgaris was used as a model organism in this study and was cultivated in flat panel reactors (FPRs) of working volumes 0.002, 0.004 and 0.006 m3, at low and high algal biomass densities. Furthermore, the trends in photoinhibition, photoacclimation (change in chlorophyll content of algae) and death of algae due to photooxidation at high light intensities are also predicted by the model. The applicability of the model for energy-efficient biomass, lipid and chlorophyll production with associated CO2 capture was also investigated.
Model development
The derivation of the Light Harvesting Model (LHM) which analyzes the light conversion in macro, cellular and molecular levels is elaborated in Sections 1.1–1.5 of ESI.† Only the salient features of the model are described in the current section.
Basis
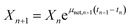
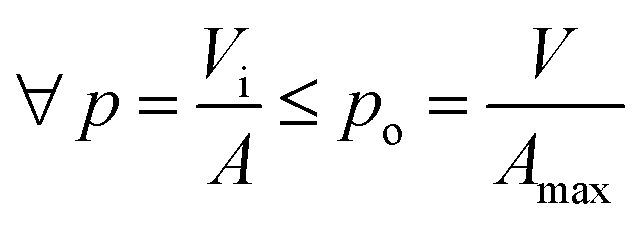
In the present study, we attempt to study algal growth in FPRs by analyzing the spatial distribution and metabolic utilization of light by algae in the same. FPRs were selected for this analysis due to their simplicity in reactor geometry. Fig. 1a shows a FPR of working volume V (m3) and illuminated surface area A (m2). The incident light is perpendicular to the illuminated surface and an opaque material is used to alter the area exposed to light. The maximum illuminated surface area is denoted as Amax (m2) and is limited by reactor configuration as seen in Fig. 1b. The average distance that light travels through the illuminated volume Vi (m3) is known as light penetration p (m)  . The average incident light intensity is Io (number of photons m−2 s−1). The algal biomass density X (kg m−3) is assumed to vary with time t (s), in a stepwise manner. The present analysis considers the (n + 1)th time interval where the biomass density is Xn (kg m−3) for tn ≤ t < tn+1 and changes instantly to Xn+1 by cell division at t = tn+1. The reactor is exposed alternately to light and darkness so that, the ratio of light to dark cycle is denoted by L
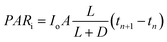
![[thin space (1/6-em)]](https://www.rsc.org/images/entities/char_2009.gif) :D. Xa,n = apparent density of algal cells in the (n + 1)th time interval which are exposed to light (kg m−3). The amount of algal cells exposed to light are given by ViXa,n and those experiencing self-shading is calculated by Vi(Xn − Xa,n). Hence, 0 ≤ Xa,n ≤ Xn. The algae are grown under nitrogen-and-phosphorus-sufficient conditions and in the optimal ranges of the physico-chemical parameters such as pH, temperature and salinity. The total amount of photons incident on the reactor and absorbed by the algae, in the (n + 1)th time interval, are PARi and PARa, respectively. The light supply rate (ρPARi) is the amount of photons incident on the surface of the FPR supplied per unit volume of the reactor per unit time (number of photons m−3 s−1). Mathematically,
:D. Xa,n = apparent density of algal cells in the (n + 1)th time interval which are exposed to light (kg m−3). The amount of algal cells exposed to light are given by ViXa,n and those experiencing self-shading is calculated by Vi(Xn − Xa,n). Hence, 0 ≤ Xa,n ≤ Xn. The algae are grown under nitrogen-and-phosphorus-sufficient conditions and in the optimal ranges of the physico-chemical parameters such as pH, temperature and salinity. The total amount of photons incident on the reactor and absorbed by the algae, in the (n + 1)th time interval, are PARi and PARa, respectively. The light supply rate (ρPARi) is the amount of photons incident on the surface of the FPR supplied per unit volume of the reactor per unit time (number of photons m−3 s−1). Mathematically,| |
 | (1) |
| |
 | (2) |
where, ka = molar light absorptivity coefficient of algae (kg−1 m2)| |
 | (3) |
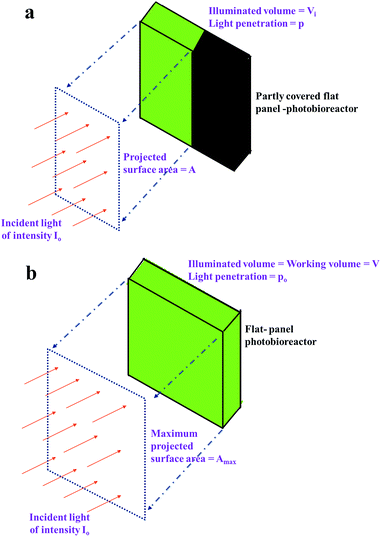 |
| | Fig. 1 Schematic of a flat pane reactor (a) with part surface covered and (b) completely exposed to light. | |
PSII degradation kinetics
The photons absorbed by algae are either used for glucose production (PARc) or lost via photoinhibition and non-photosynthetic quenching. The manganese hypothesis of photoinhibition8 suggests that the OEC is degraded by light at all Io (continuous or flashing) which leads to the decomposition of active PSII. Takahashi and Murata20 elaborated the PSII degradation process with a two-step mechanism suggesting that the loss of Mn from the OEC (rate limiting step) leads to PSII degradation. The subsequent repair of PSII occurs by pre-D1 protein synthesis and reassembly of PSII (Fig. 2a). Campbell and Tyystjärvi21 simplified the two-step mechanism via a first order reaction kinetics model (Fig. 2b). Additionally, we took into account the effects of intracellular PSII self-shading in an algal cell (Fig. 2c) and the inhibition of D1-protein repair mechanism by the reactive oxygen species released during the inactivation of OEC.9,22 The PSII degradation kinetics thus developed was used for estimating the quantum yield (QY) of photosynthesis or the amount of energy stored in the glucose produced per photon.
 |
| | Fig. 2 (a) Two-step mechanism of photodamage and recovery of chlorophyll20 (b) simplification of the two-step mechanism21 and (c) schematic of intracellular PSII shading in an algal cell. | |
If M = concentration of active PSII in an algal cell (mol mol−1 cell) and Mo = total concentration of active and inactive PSII (mol mol−1 cell), then (refer to Section 1.3.1 of ESI†)
| |
 | (4) |
where,
ρPARo is the value of
ρPARi so that

,
Kc = constant of proportionality for quantum yield (mol cell per mol PSII),
ηOEC,n+1 = efficiency of photolysis of water at OEC in the (
n + 1)
th time interval and
such that
kp and
kr are rate constants of PSII degradation and PSII repair, respectively.
To the best of the authors' knowledge the PSII degradation kinetics as described by eqn (4) has been developed for the first time. The novelty of eqn (4) lays in the fact that 0 ≤ M ≤ Mo (thus enabling 0 ≤ QY ≤ 1), ∀ ρPARi ∈ R (self-limitation) unlike models in literature where boundary conditions need to be imposed.10–12,21
Photooxidative death of algae occurs when ρPARi > 0 and M = 0.
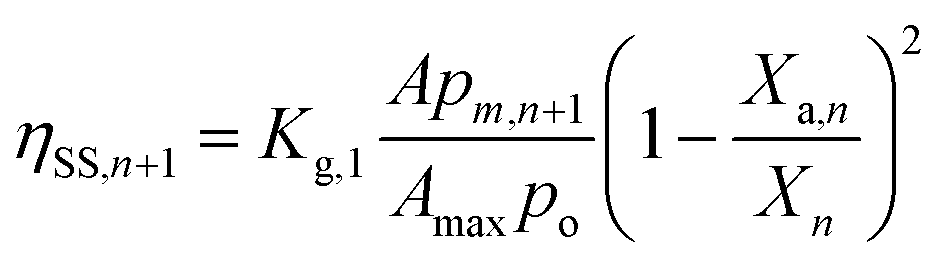
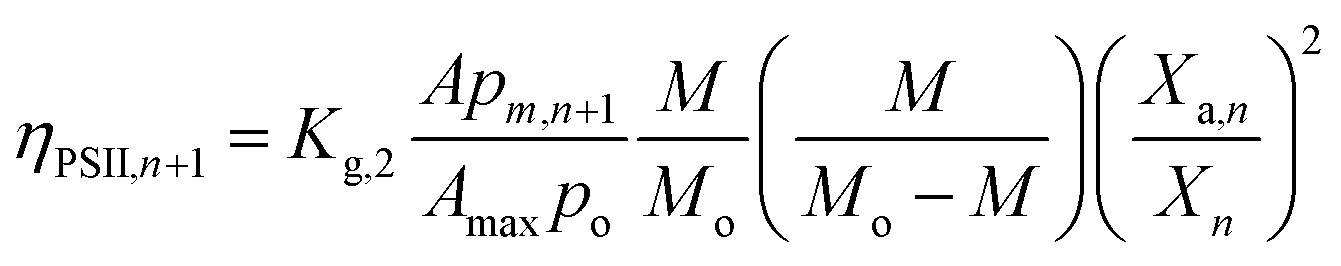
OEC ionization dynamics
According to Kok cycle,23 the OEC is present in four ionization states (S1, S2, S3 and S4) during photolysis of water and progresses from S1 to S4 with each successive photon entrapment. S1 is stable in dark and S4 immediately reduces to the ground state resulting in photolysis of water. Conversely, S2 and S3 decay into S1 and S2, respectively, if the subsequent photon does not impinge on them within 0.5 milliseconds of their formation.15,24 These photon losses lead to reduction in ηOEC,n+1 and are termed as OEC decay losses in the present study.
The S2 and S3 state decay would occur when (a) a light-exposed algal cell is transported to dark or dimly-lit region of the FPR, with local light intensity ≤ Im (or the minimum light intensity required to initiate photosynthesis), (b) an algal cell in the well-lit (local light intensity > Im) region of Vi is self-shaded (intercellular) by other algal cells and (c) an active PSII is self-shaded (intracellular) by other active PSII. The respective reduction in ηOEC,n+1 are labelled ηBM,n+1, ηSS,n+1 and ηPSII,n+1 and would be affected by bulk mixing and Brownian motion. Thus,
| ηBM,n+1, ηSS,n+1, ηPSII,n+1 ∝ duration of OEC exposure to dark. |
| ηBM,n+1, ηSS,n+1, ηPSII,n+1 ∝ the frequency of OEC/cell cycling between light and dark. |
| |
 | (7) |
| |
 | (8) |
| |
 | (9) |
| | |
ηOEC,n+1 = 1 − (ηBM,n+1 + ηSS,n+1 + ηPSII,n+1)
| (10) |
where,
Kg,0,
Kg,1 and
Kg,2 are the coefficients of OEC decay losses caused due to bulk mixing, intercellular self-shading and intracellular self-shading; respectively.
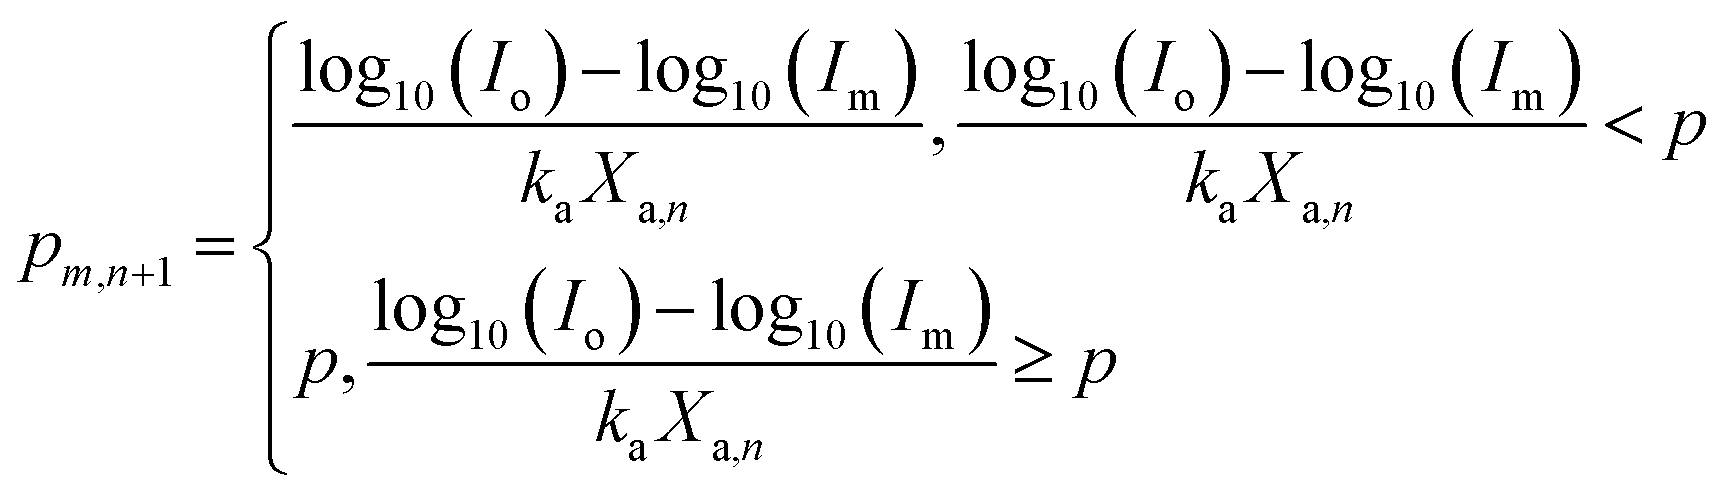
Eqn (11) was estimated using modified Beer–Lambert's law.
25| |
 | (11) |
where,
pm,n+1 = light penetration (m) beyond which OEC decay may occur in the dimly-lit zone of
Vi during the (
n + 1)
th time interval.
Cell maintenance
A part of the glucose synthesized during photosynthesis is used for cell maintenance comprised of (a) physiological maintenance which is defined as “the energy costs of osmoregulation, cell motility, defence mechanisms, and proofreading and internal turnover of macromolcular compounds”26 and (b) other non-growth energy expenditure involved in basic cell metabolism, polymer storage, cell death and extracellular losses. The former is proportional to amount of light converted into glucose27 and while the latter depends on Xn. The remainder glucose is utilized for cell growth and division. Thus, the amount of photons utilized for algal growth and cell division in the (n + 1)th time interval (PARg) is given by eqn (12).| |
 | (12) |
where, μd = the relative death rate (h−1) due to non-growth energy expenditure and Kg,3 is the coefficient of physiological maintenance.
Photosynthesis and biomass combustion
Photosynthesis and combustion of algal biomass can be represented as
Thus, it can be seen that PARg is released as heat (ΔH) during combustion of algae as explained in eqn (13).
| | |
ΔH = HcV(Xn+1 − Xn) = KlightPARg
| (13) |
where,
Hc = heat of combustion for algae (kJ kg
−1) and
Klight = energy content of a photon (kJ per photon).
Algal growth kinetics
Upon solving eqn (1)–(13), we get (refer to Section 1.5 of ESI†)| |
 | (14) |
and| |
 | (15) |
where, μnet,n+1 = net specific growth rate of algae in the (n + 1)th time interval (h−1), μmax = innate maximum cell division rate of algal species (h−1) and ρPARmax = value of ρPARi where μnet,n+1 is maximum.
Under ideal conditions,  and ηOEC,n+1 ≈ 1 ∀ n and eqn (14) reduces into the intrinsic kinetics of algal growth.
| |
 | (16) |
where,
μnet = net specific growth rate of algae (h
−1).
Materials and methods
Algal species and media composition
The microalgal species, Chlorella vulgaris, used in this experiment was received as a gift from National Environmental Engineering Research Institute, Nagpur, India.28 Bold's Basal Medium29 was used as nutrient medium in all the experiments. All chemicals used are of analytical grade and procured from Merck®. Initial pH of the medium was adjusted to 7.1 ± 0.1.
Inoculum development
The initial algal biomass concentrations (at t = t0) in the FPR were Xo = 0.05 ± 0.005 kg m−3. The inoculums (10% v/v) were cultured in conical flasks (Borosil®) in an orbital shaker (Labtech, Korea) at 40 μmol photons m−2 s−1, 25 °C and 120 rpm.
Reactor design
Indigenously designed FPRs were used in the present study (Fig. 3). A five mm thick sheet of Perspex® (polymethylacrylate) was used to construct the reactor having the following dimensions (excluding wall thickness): length = 0.3 m and height = 0.39 m, as described in Fig. 3. The working volume (V = 0.002 m−3) was divided into an illuminated zone of width (W) = 0.02 m and Vi = 0.0018 m−3 and a 0.0002 m−3 degassing zone (width = 0.04 m). The degassing zone was provided to reduce gas holdup in the system30 and it was covered with opaque material to ensure a constant maximum illuminated surface area to working volume ratio. Additional reactors of V = 0.004 m−3 and 0.006 m−3 were designed having illuminated zone widths 0.04 and 0.06 m and degassing zone widths 0.06 m and 0.08 m, respectively. The remaining dimensions were constant.
 |
| | Fig. 3 Schematic of flat panel reactors of width 0.02 m, 0.04 m and 0.06 m. All dimensions are in m. | |
Reactor operation
The photobioreactors were sterilized using 2% sodium hypochlorite solution.31 Air was supplied using air pumps (Seeboy, power = 3 W and pressure = 0.12 MPa) and filtered through 0.22 μm membrane (Whatmann). The volumetric flow rate (0.375 vvm) was pre-determined from gas holdup and mixing time experiments (data not shown). pH of the media varied from 7 to 11.3 during the experimental duration, which is well within the tolerance limit of Chlorella vulgaris.28 Reactor temperature was maintained between 32 ± 1.5 °C by air conditioning. Illumination was provided on both sides of the FPRs by using cool white fluorescent tube lights (Philips, 36 W) unless mentioned otherwise. Light intensity was measured using a luxmeter (HTC LX-102) and the quantity of photon supplied was calculated using: 1 μmol photons m−2 s−1 = 74 lux.32 The incident light intensity was adjusted such that the photon losses due to reflectance and absorption by reactor material were <5%.
Experimental design
LHM was initially validated at low biomass densities in FPR of V = 0.002 m−3 by studying the effect of light supply rates on the growth of Chlorella vulgaris (Table 1). ρPARi was controlled by varying Io, A and L:D individually while maintaining the other two as constant. Each experiment was run until 90% of sodium nitrate was consumed. The pre-requisite conditions18,19,33,34 of the experiments include: (a) the ranges of physico-chemical parameters (such as aeration, pH and temperature), used in the experiment, do not inhibit algal growth; (b) negligible intercellular self-shading by algal cells and (c) the experiments are performed in tolerable ranges of Io and L:D for the organism. Five mL of the working volume was sampled at 12 h intervals for experiments involving ρPARi ≤ 9 mmol photons m−3 s−1 and 8 h intervals for ρPARi > 9 mmol photons m−3 s−1. Additional samples were collected at beginning and end of light cycle, as required. Sterile water was added to make up the volume lost due to evaporation and sampling.
Table 1 Experimental design to study the growth of Chlorella vulgaris at different ρPARi at low biomass densities
| Variable parameters |
Io (μmol photons m−2 s−1) |
L:D |
A (m2) |
ρPARi (mmol photons m−3 s−1) |
| Constant parameters |
L:D = 24:0, A = 0.180 m2 |
A = 0.180 m2 |
L:D = 24:0 |
| Io = 100 μmol photons m−2 s−1 |
Io = 200 μmol photons m−2 s−1 |
Io = 300 mol photons m−2 s−1 |
Io = 100 μmol photons m−2 s−1 |
Io = 200 μmol photons m−2 s−1 |
Io = 300 μmol photons m−2 s−1 |
| Design of experiments |
300 |
— |
— |
24:0 |
— |
— |
0.180 |
27.00 |
| 250 |
— |
— |
— |
— |
— |
— |
22.50 |
| 200 |
— |
24:0 |
16:08 |
— |
0.180 |
0.120 |
18.00 |
| 175 |
— |
21:03 |
— |
— |
0.158 |
— |
15.75 |
| 150 |
— |
18:06 |
12:12 |
— |
0.135 |
0.090 |
13.50 |
| 125 |
— |
15:09 |
— |
— |
0.113 |
— |
11.25 |
| 100 |
24:0 |
12:12 |
08:16 |
0.180 |
0.090 |
0.060 |
9.00 |
| 66.67 |
16:08 |
08:16 |
— |
0.120 |
0.060 |
— |
6.00 |
| 50 |
12:12 |
06:18 |
— |
0.090 |
0.045 |
— |
4.50 |
| 33.33 |
08:16 |
— |
— |
0.060 |
— |
— |
3.00 |
In order to measure the accuracy of LHM at high biomass densities, Chlorella vulgaris was cultivated in FPR of W = 0.02 m at Io = 66.67, 100 and 200 μmol photons m−2 s−1 when L:D = 24:0 and A = 0.18 m2. The utility of LHM for scale-up at different reactor widths was tested via growth responses of Chlorella vulgaris in FPRs of widths 0.02, 0.04 and 0.06 m at Io = 200 μmol photons m−2 s−1, L:D = 24:0, A = 0.18 m2. The initial sodium nitrate concentration in the experiments studying the growth response of chlorophyll at high algal densities and different reactor widths was 1.25 kg m−3. The experiments at high biomass density were run until biomass density was constant and sodium nitrate consumption ceased. Samples were collected at 12 h intervals.
The utility of LHM with regards to optimization of CO2 capture and photosynthetic efficiency of a process was verified via cultivation of Chlorella vulgaris in fed-batch mode, in FPR of W = 0.02 m under different illumination conditions. The light intensities used in the various fed-batch experiments were Io = 166.67, 200 and 233.33 μmol photons m−2 s−1. The ratio of light and dark cycle (L:D = 24:0) and illuminated surface area of FPR (A = 0.18 m2) were constant at all experiments. Chlorella vulgaris was cultivated (initial sodium nitrate concentration = 1.25 kg m−3) in batch mode until an initial algal biomass density of 0.45 kg m−3 was attained. Then, cultivation was switched to fed-batch mode (five cycles) such that Chlorella vulgaris would grow at the various illumination conditions for 24 hours and then 0.00125 m3 of the culture was harvested and replenished with fresh media. The sodium nitrate concentration in the culture was 1 kg m−3 after replenishment to ensure nitrogen-sufficient conditions. The harvested algae were dried and stored for future analysis.
The relative death rate, μd, was determined by growing Chlorella vulgaris at total darkness for 48 hours in all the FPRs. The influence of biomass density on μd was determined by performing the experiment at the initial biomass densities of 0.1, 0.5, 1 and 2 kg m−3, in all the reactors.
All batch-experiments were performed in triplicates.
Measurements and calculations
The parameters measured and analyzed during the three experiments are as follows
Minimum light intensity required for photosynthesis. Im was determined to be the incident light intensity at which μnet ≈ 0 at L:D = 24:0 and A = 0.18 m2.
Actual and apparent algal biomass densities. Algal biomass concentration (X) was quantified gravimetrically.35 The optical density (OD) of the sample (with corresponding dilution to ensure linearity of Beer–Lambert law) was measured at 750 nm using a UV-Visible spectrophotometer (Chemito).35 The biomass concentration was determined from the calibration curve:| | |
OD750 = 2.26X, R2 = 0.9815
| (17) |
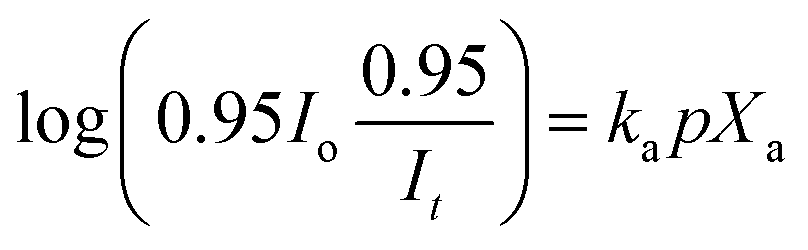
The apparent algal density (Xa) was estimated using modified Beer–Lambert's law25
| |
 | (18) |
where,
It is the light intensity transmitted through the FPR and measured at the reactor surface after correction (to eliminate absorption losses by water). Different values of
p were obtained by illuminating FPRs of
W = 0.02, 0.04 and 0.06 m from one side and measuring
It on the opposite surface. The photon losses due to photobioreactor material absorption were measured to be 5%. Hence the actual light intensity on the water surface, at light entry and exit, is appropriately modified to 0.95
Io and
It/0.95, respectively. Finally,
ka was measured by applying
eqn (18) in low biomass density conditions
Xa =
X < 0.2 kg m
−3 in FPR of
W = 0.02 m in different values of
Io.
Chlorophyll and sodium nitrate concentrations. The harvested algae was stored at −20 °C (if required), prior to chlorophyll extraction, to prevent chlorophyll repair in dark. Chlorophyll was extracted and estimated using hot extraction method (90% methanol)36 and sodium nitrate concentrations were estimated colorimetrically.37
Concurrent recovery of chlorophyll and lipid. Neutral algal lipids and chlorophyll were extracted concomitantly using methanol and hexane (1:1) solvent mixture according to our previous study.38 The hexane fraction containing neutral lipids were trans-esterified into fatty acid methyl esters (FAME) and characterized using gas chromatograph with flame ionization detector.38 The utility of FAME as biodiesel was estimated by studying the fraction of saturated and unsaturated fatty acids in algae. Further, the methanol phase containing the pigment chlorophyll was separated and quantified colorimetrically.36
Calculation of Xn+1. Xn+1 was calculated using eqn (19).39 The time interval (tn+1 − tn) used in eqn (19) is the sampling time interval for the various experiments.| |
 | (19) |
Conversely, μnet for the various experiments was experimentally-determined using eqn (19).
All the data in the work were analyzed using Microsoft Excel 2007.
Results and discussion
The light harvesting model of photosynthesis and algal growth consists of eqn (1)–(19) and the empirically derived eqn (20). The purpose of LHM is to represent the fundamental biological processes which would in turn allow the assessment of the interactions between the organism, equipment design and light supply which is then used for engineering design of photobioreactors and biorefineries.
Selection of model parameters
LHM was developed using first principles to ensure its utility in a wide range of experimental conditions. The computational ease of LHM was assured by selecting parameters whose influences had (a) a theoretical basis, (b) could be integrated easily with theory, (c) were imperative to accurately estimate algal growth rates or (d) could not be minimized via engineering techniques. The effects of dissolved oxygen concentration were not modelled in the present study because the degassing zone in the FPRs kept the same within tolerable limits. Higher aeration rates damaged cells and diminished μ. As aeration did not play a vital role in the light-conversion-to-biomass process, it was excluded from LHM and the present study was performed under conditions of minimum μd. Although CO2 is known to boost algal productivity, the CO2 biochemistry is extremely complex because it affects intracellular pH. Hence, CO2 levels in the air supply, during the experiments, were kept at atmospheric levels. We noticed that algal doubling times are >12 hours in the present study while the mixing times in the bioreactor are <60 s (data not shown). Hence the CO2, O2 and nutrient concentration variations in the reactor were considered irrelevant as long as cells were homogeneously mixed. The growth rate of Chlorella vulgaris was found to be independent of the limiting nutrient, sodium nitrate, when cultivated in various initial concentrations (0.05–1.25 kg m−3) of the same (data not shown). Hence, sodium nitrate was not modelled in LHM. Temperature, pH and nutrient-deficiency were not modelled in LHM because the biochemical reactions in algae within tolerable limits of the same parameters are different from those in extreme conditions and beyond the scope of the present study. For example, under nitrogen-sufficient conditions the biochemical reactions in the microorganism lead to cell division while in nitrogen-depleted conditions lipid synthesis and storage occur.
Determination of Xa and model parameters
The empirical relationship between the exposed cells and total cells (Fig. 4a and b) in the reactor is given by the hyperbolic equation5| |
 | (20) |
where, (pXa)max = 0.008 kg m−2 from Fig. 4a and b.
 |
| | Fig. 4 Profile of (a) change in apparent algal density (Xa) with existing algal density (X) at different light penetration and (b) variation in Xa/X with the amount of algae exposed to light. | |
On basis of from Fig. 4a it can be concluded that, “high algal density” is a relative term w.r.t reactor geometry because the amount of light absorbed by higher X in lower-width FPRs would be absorbed by lower X in higher-width FPRs. Hence, algal densities reduced with increasing reactor widths.40,41 Model parameters of LHM are elaborated in Table 2.
Table 2 Model parameters of LHM
| Model parameters |
Value |
| Amax |
0.18 m2 |
| Im |
10 μmol photons m−2 s−1 |
| K′ |
1 |
| Kg,0 |
0.2 |
| Kg,1 |
1.5 |
| Kg,2, Kg,3 |
0 |
| ka |
229 kg−1 m2 |
| p |
0.01 m in FPR of W = 0.02 m |
| 0.02 m in FPR of W = 0.04 m |
| 0.03 m in FPR of W = 0.06 m |
| p/po |
0.9, for all FPRs |
| μd |
0.0015 h−1 in FPR of W = 0.02 m |
| 0.0020 h−1 in FPR of W = 0.04 m |
| 0.0017 h−1 in FPR of W = 0.06 m |
| μmax |
0.06 h−1 |
| ρPARo |
15.75 mmol photons m−3 s−1 |
| ρPARmax |
17.5 mmol photons m−3 s−1 |
Algal growth at low biomass densities
The intrinsic kinetics model (eqn (16)) was validated for X ≤ 0.5 kg m−3 in FPR of W = 0.02 m because self-shading by algae was observed to be minimal  at the same (Fig. 4b).
Influence of Io, A and L![[thin space (1/6-em)]](https://www.rsc.org/images/entities/b_char_2009.gif) :D on μnet. The net specific growth rate of Chlorella vulgaris varied identically with Io, A and L:D as long as ρPARi was equivalent in the experiments (Fig. 5a). Hence, algal growth kinetics depends on ρPARi and not light intensity alone as predicted by LHM.
:D on μnet. The net specific growth rate of Chlorella vulgaris varied identically with Io, A and L:D as long as ρPARi was equivalent in the experiments (Fig. 5a). Hence, algal growth kinetics depends on ρPARi and not light intensity alone as predicted by LHM.
 |
| | Fig. 5 (a) Comparative analysis of incident light intensity, illuminated surface area and duration of light cycle on specific growth rate (μ) of Chlorella vulgaris, at low biomass densities; (b) comparative analysis of different algal growth kinetic models with experimental data and (c) prediction of photooxidative death of Spirulina platensis16 and Microcystis aeruginosa.17 | |
Determination of Kg,3. Chlorella vulgaris was grown axenically in at low salinity, was non-motile, had relatively constant total intracellular protein–lipid–carbohydrate composition during the growth phase and did not secrete any growth-associated products. Hence, physiological maintenance could only occur during generation of cellular components and was proportional to the amount of glucose synthesized during photosynthesis. Thus, Kg,3 and subsequently, {μmax(1 − Kg,3)} are constants. To keep calculations simple Kg,3 was set to 0.
Validation of intrinsic growth kinetics. Fig. 5b shows that μnet increased linearly from 0 to 0.042 h−1 for 0 ≤ ρPARi ≤ 9 mmol photons m−3 s−1, non-linearly from 0.042 h−1 to 0.058 h−1 for 9 ≤ ρPARi ≤ 18 mmol photons m−3 s−1 and decreased thereafter to 0.048 h−1 at ρPARi = 27 mmol photons m−3 s−1. To the best of the authors' knowledge the present study is the first comparative analysis of the effects of light intensity, illuminated surface area of reactor and illumination duration on μnet. While the effects of light intensity and illumination duration on μnet have been studied individually18,42 literature review did not reveal prior reports on the impact of illuminated surface area of reactor on μnet.LHM was compared against Eilers and Peeters Model (EPM),10 Jassby and Platt Model (JPM),5 Steele Model (SM)6 and Tamiya Model (TM)43 in Fig. 5b and the respective model parameters are elaborated in Tables 2 and 3. LHM fit experimental data the best with R2 = 0.9940. EPM (R2 = 0.9920) and SM (R2 = 0.9862) also fit the experimental data well. This is probably because EPM analyzes the probability of PSII remaining active at different light intensities and SM is empirically derived. On the other hand, JPM (R2 = 0.9778) and TM (R2 = 0.9538) could not predict the decrease in algal growth rates at high ρPARi.
Table 3 Comparative analysis of different algal growth kinetic models
| Model |
Model equation |
Model parameters (μd = 0.0015 h−1) |
| EPM10 |
 |
μmax = 0.058 h−1, a = 0.74 (mmol photons)−1 m3 s, b = −8.54, c = 244.29 mmol photons m−3 s−1 |
| JPM5 |
μnet = μmaxtanh(aρPARi) − μd |
μmax = 0.058 h−1, a = 0.124 (mmol photons)−1 m3 s |
| SM6 |
 |
μmax = 0.058 h−1, ρPARmax = 20 mmol photons m−3 s−1 |
| TM43 |
 |
μmax = 0.08 h−1, a = 0.01 (mmol photons)−1 m3 s |
EPM, LHM and SM were further analyzed to evaluate their accuracy in predicting cell death at high light intensities using literature data.16,17 The results of the analysis are presented in Fig. 5c and Table 4. EPM fails to predict algal death at high light intensities in contrast with LHM and SM. The success of SM may be attributed to its empirical origin and the accuracy of LHM is due to its derivation on basis of first principles.
Table 4 Comparative analysis of EPM, SM and LHM using literature data (μd = 0)
| Model |
Spirulina platensis16 |
Microcystis aeruginosa17 |
| The models have been evaluated for Io and not ρPARi because A values were not available in literature data. Iα and Imax are the equivalent of ρPARo and ρPARmax, respectively. |
| EPM10 |
μmax = 0.006 h−1, R2 = 0.5467, a = 238.93 (μmol photons)−1 m2 s, b = 3441.85, c = 724852.2 μmol photons m−2 s−1 |
μmax = 0.02 h−1, R2 = 0.4250, aa = 5.715 (μmol photons)−1 m2 s, b = 1503.19, c = 43, 465.91 μmol photons m−2 s−1 |
| SM6 |
μmax = 0.006 h−1, R2 = 0.7694, Imax = 55.08 μmol photons m−2 s−1 |
μmax = 0.02 h−1, R2 = 0.7123, Imax = 87.21 μmol photons m−2 s−1 |
| LHM (present study) |
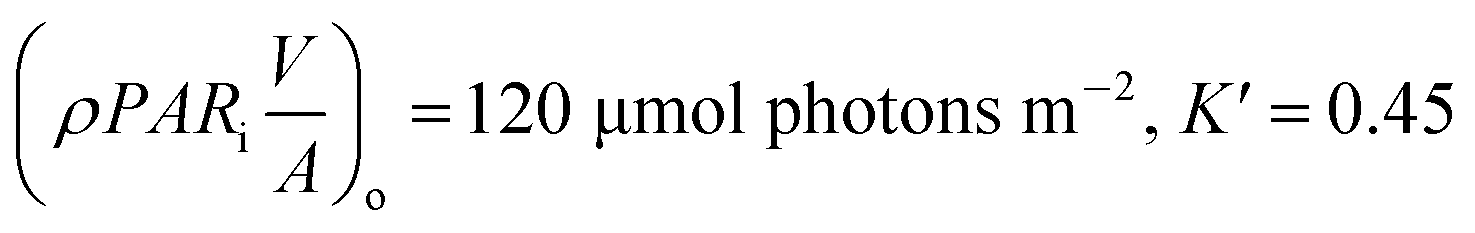
p = po, μmax = 0.006 h−1, R2 = 0.8540, K′ = 0.7, Imax = 55.08 μmol photons m−2 s−1, Iα = 45.9 μmol photons m−2 s−1 |
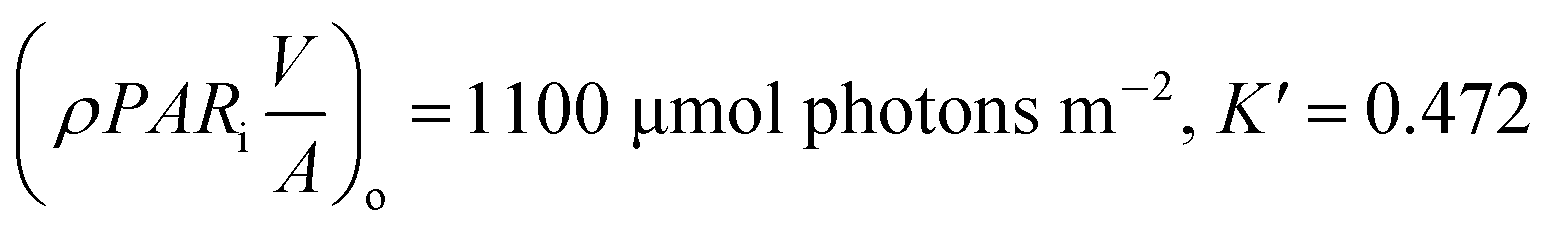
p = po, μmax = 0.021 h−1, R2 = 0.7279, K′ = 0.625, Imax = 80 μmol photons m−2 s−1, Iαb = 60.13 μmol photons m−2 s−1 |
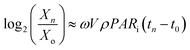
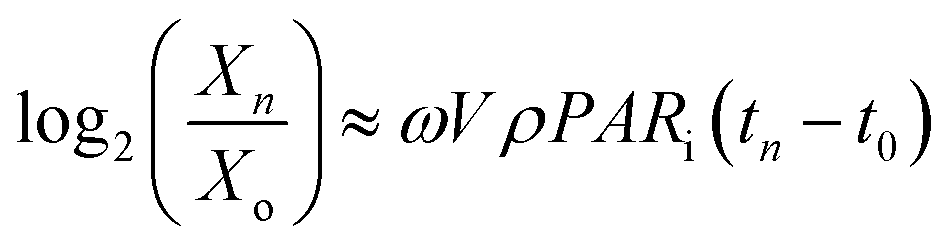
Determination of Kg,2. Eqn (13) assumes that the energy content of algae is obtained from light. Upon solving eqn (16) for Chlorella vulgaris, we get| |
 | (21) |
where, 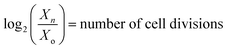 that have occurred from t = 0 to t = tn, VρPARi(tn − t0) = the total number of photons incident on the FPR from t = 0 to t = tn and
  . Thus, ω is constant for an experiment in FPR of W = 0.02 m.
Fig. 6a–c prove the linearity of eqn (16) at ρPARi = 4.5, 9, 13.5 and 18 mmol photons m−3 s−1. Therefore, the light conversion efficiency of OEC (ηOEC) ≈ 1 is valid at low biomass densities and all illumination conditions. Subsequently, the loss in ηOEC caused by intracellular self-shading (ηPSII) is negligible.
 |
| | Fig. 6 Trends in cell division of Chlorella vulgaris with amount of light supplied at different (a) light intensities (A = 0.18 m2, L:D = 24:0); (b) illuminated surface areas of reactor (Io = 200 μmol photons m−2 s−1, L:D = 24:0); (c) light cycle durations (A = 0.18 m2, Io = 200 μmol photons m−2 s−1) and (d) profile of OEC decay losses due to active PSII self-shading with biomass density when continuously illuminated at different Io (μmol photons m−2 s−1) and A = Amax. | |
However, ηPSII keeps reducing with increase in biomass density and incident light intensities (L:D = 24:0, A = 0.18 m2) as seen in Fig. 6d. In view of the fact that, maximum ηPSII occurs at low biomass densities and ηPSII decreases with rise in X, Kg,2 ≈ 0 for Chlorella vulgaris.
The probable reason for the low rates of OEC decay due to active PSII self-shading could be quantum coherence44 which plays an important role in the charge separation dynamics of active PSII. Conversely, minimization of ηPSII could be the selection pressure for the quantum coherence phenomenon.
Algal growth at high biomass densities
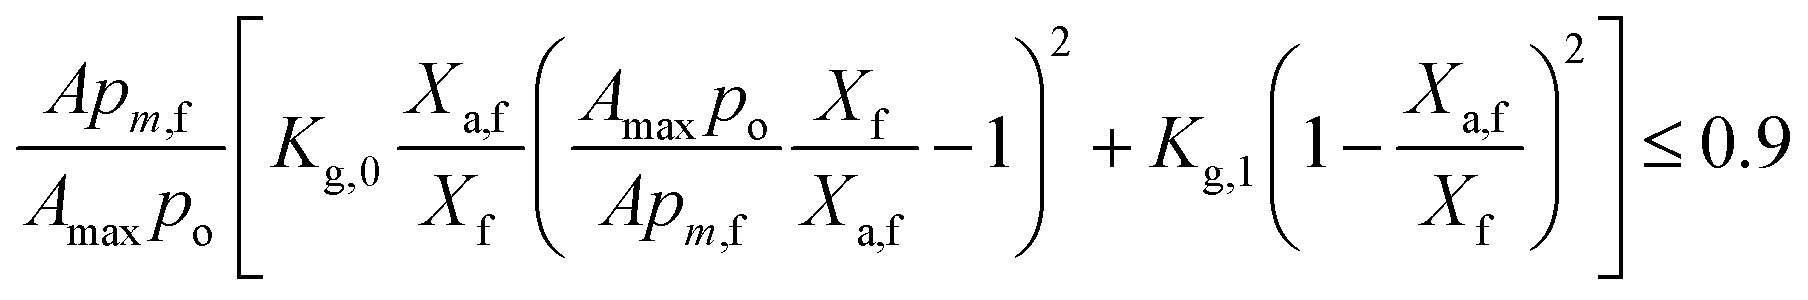
Factors influencing cessation of algal growth at high biomass densities. Algal growth rates decrease with increasing biomass densities due to light-limitation caused by intrinsic algal growth rates, reactor geometry, chlorophyll content of algae, ηOEC and illumination conditions. It eventually stops (μnet = 0) when OEC decay losses prevent net glucogenesis. Thus, eqn (14) reduces to| |
 | (22) |
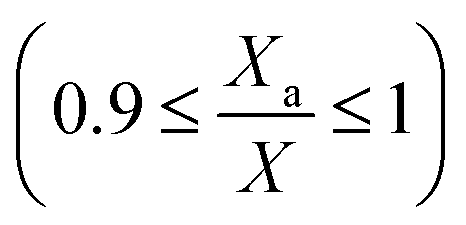
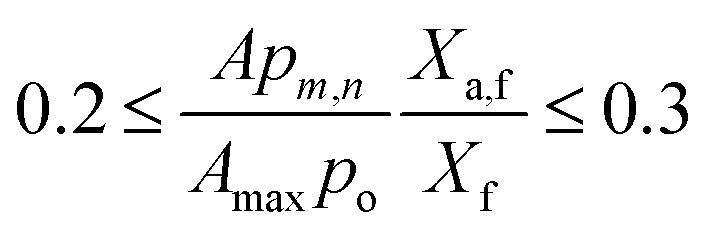
where, Xa,f and pm,f are the values of Xa,n and pm,n+1 when biomass growth stops (at Xf) due to light-limitation. Chlorella vulgaris, cultivated in modified Bold's basal media (sodium nitrate = 1.25 kg m−3), ceased to grow in all the experiments, when the amount of algae in the well-lit region of Vi were approximately 20–30% of total algae in V or | |
 | (23) |
This was similar to literature results45 where algal growth (in raceway ponds) occurred until light penetration in the raceway is 33.33% of the raceway depth. Biomass production stopped, at different Xf in the various experiments (Fig. 7a), despite sufficient sodium nitrate levels, as seen in Table 5. The reduction in Xf with decreasing light intensity46–48 and increasing light penetration40,41,49–51 was also reported in literature.
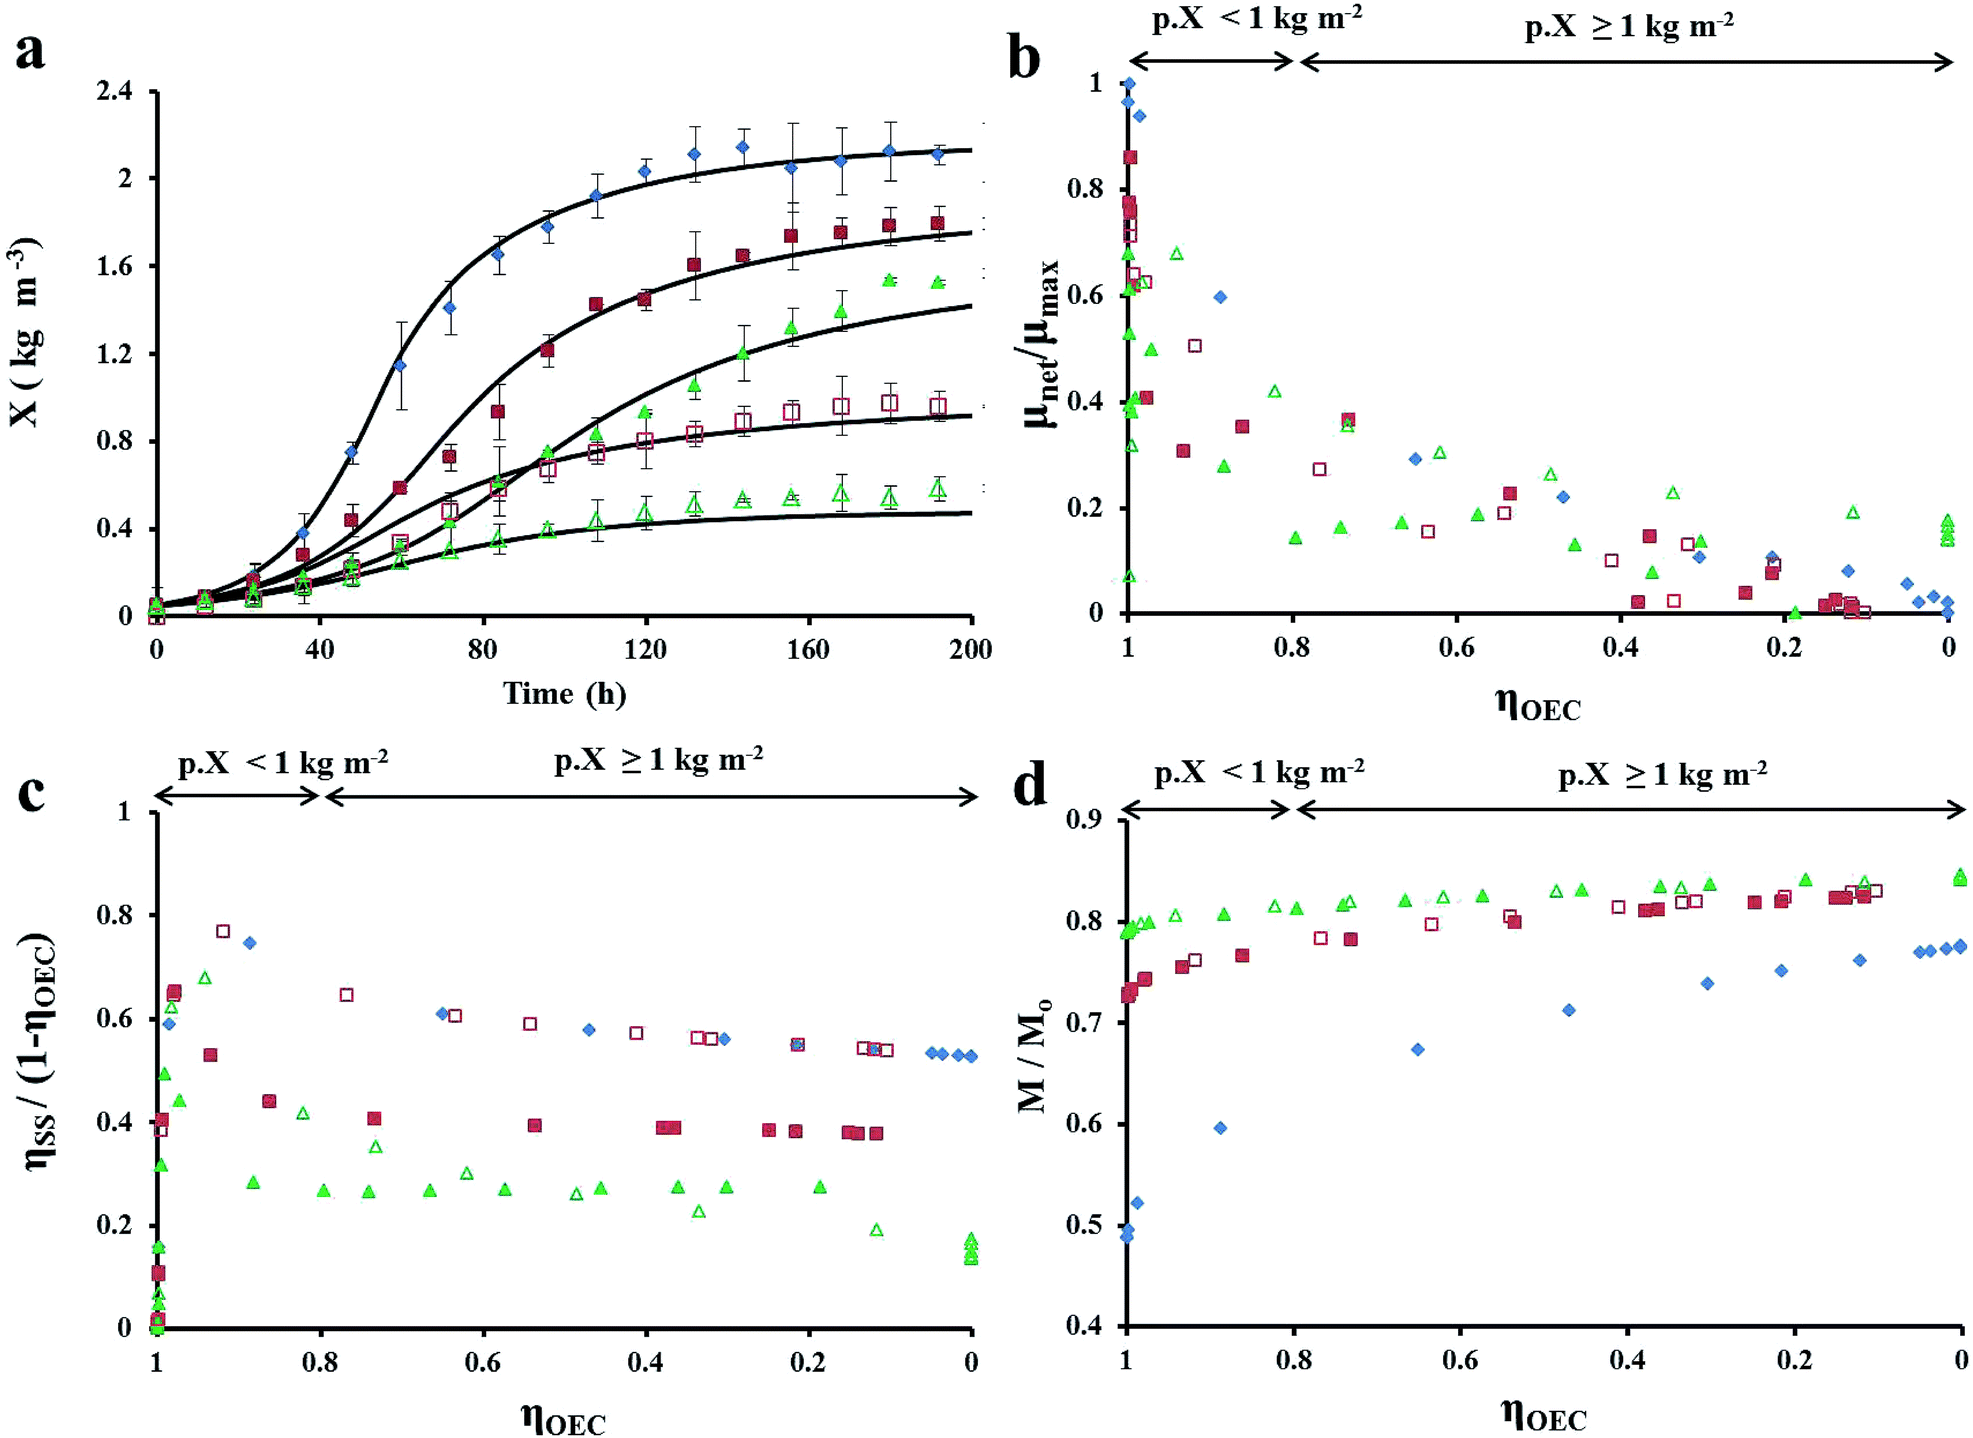
 |
| | Fig. 7 (a) Algal growth profile of Chlorella vulgaris at different experimental conditions in FPR of W = 0.02 m; variation in (b) specific growth rate; (c) fraction of OEC decay losses due to intercellular self-shading (ηSS) and (d) active PSII content with light conversion efficiency of OEC. Experimental conditions [Io, A, L:D, W] are [200, 0.18, 24:0, 0.01] = ( ), [100, 0.18, 24:0, 0.01] = ( ), [100, 0.18, 24:0, 0.01] = ( ), [66.67, 0.18, 24:0, 0.01] = ( ), [66.67, 0.18, 24:0, 0.01] = ( ), [200, 0.18, 24:0, 0.02] = ( ), [200, 0.18, 24:0, 0.02] = ( ) and[200, 0.18, 24:0, 0.03] = ( ) and[200, 0.18, 24:0, 0.03] = ( ). The units pf Io, A, L:D and W are μmol photons m−2 s−1, m2, h:h and m, respectively. ). The units pf Io, A, L:D and W are μmol photons m−2 s−1, m2, h:h and m, respectively. | |
Table 5 Performance analysis of LHM for Chlorella vulgaris cultivated in FPRs at different illumination conditions
| Illumination condition (μmol photons m−2 s−1, m2, h) |
W (m) |
ρPARi (mmol photons m−3 s−1) |
Final sodium nitrate concentration (kg m−3) |

experimental |
Xf experimental (kg m−3) |
Xf theoretical (kg m−3) |
Harvested biomass (g) |
R2 |
| (200, 0.18, 24) |
0.02 |
18 |
0.263 ± 0.012 |
0.241 |
2.12 ± 0.02 |
2.04 |
4.24 ± 0.04 |
0.9983 |
| (100, 0.18, 24) |
0.02 |
9 |
0.389 ± 0.006 |
0.218 |
1.80 ± 0.05 |
1.83 |
3.60 ± 0.10 |
0.9962 |
| (66.67, 0.09, 24) |
0.02 |
6 |
0.576 ± 0.011 |
0.212 |
1.52 ± 0.03 |
1.55 |
3.04 ± 0.06 |
0.9949 |
| (200, 0.18, 24) |
0.04 |
9 |
0.771 ± 0.016 |
0.266 |
0.96 ± 0.02 |
0.97 |
3.84 ± 0.04 |
0.9991 |
| (200, 0.18, 24) |
0.06 |
6 |
0.959 ± 0.021 |
0.299 |
0.57 ± 0.03 |
0.49 |
3.36 ± 0.06 |
0.9938 |
Determination of Kg,0 and Kg,1. The coefficients of OEC decay losses due to bulk mixing, and intercellular self-shading could not be determined theoretically because we have a single expression (22) with two variables. Hence, experimental data values for FPR of W = 0.02 m (in Table 5) were input in eqn (14) and the ranges of Kg,0 and Kg,1 were determined as explained in Section 1.6 of ESI.† The final values of Kg,0 and Kg,1 were 0.2 and 1.5, respectively and the best-fit LHM at different light intensities in FPR of W = 0.02 m are presented in Fig. 7a.
Biomass production and FPR scale-up. LHM was found to predict biomass growth after reactor scale-up as evidenced by the growth curves of Chlorella vulgaris in FPR of widths 0.04 and 0.06 m in Fig. 7a. The deviation in predicted and experimental Xf for FPR of W = 0.06 m is probably due to flash light effect. Although the number of photons incident on FPR surface per unit time (VρPARi) was identical, the amount of harvested biomass (Table 5) decreased with FPR scale-up due to reduced availability of photons in the immediate vicinity of algal cells.
Physiological maintenance and OEC decay losses. The decrease of μnet and eventual cessation of algal growth at high biomass densities was previously reported.46,52,53 However, the respective authors attributed the phenomenon to a corresponding increase in physiological maintenance at high biomass densities. It was the only explanation (at the time) which explained the increase in light absorption and lack of cell division at high algal biomass concentrations.In the present study, the decreased algal growth was hypothesized to occur due to OEC decay and subsequent decrease in the efficiency of glucose biogenesis. The hypothesis was validated via the accuracy of the LHM at predicting algal biomass growth at the various experimental conditions (R2 value in Table 5 and Fig. 7a). Fig. 7b illustrates the non-linear relationship between μnet and ηOEC at the various experimental conditions. μnet decreases rapidly to half its original value at the respective experimental conditions when 0.8 ≤ ηOEC ≤ 1 and gently declines to 0 for ηOEC < 0.8. The rapid reduction in μnet (at 0.8 ≤ ηOEC ≤ 1) occurs because of a corresponding increase in intercellular-self-shading-induced OEC decay losses (ηSS) at low biomass densities (pX < 1), as seen in Fig. 7c. Further OEC decay losses (ηOEC < 0.8) are caused primarily by the enlargement of the dimly-lit zone of Vi at higher biomass densities (pX ≥ 1). Despite the rise in OEC decay losses at lower ηOEC, algal specific growth rates gently decline due to the boost in light conversion rates received from the increased active PSII amount in the cell (photoacclimation) as seen in Fig. 7d. OEC decay losses are not cell maintenance losses as they occur prior to glucogenesis. Neither can they be classified as non-photosynthetic-quenching losses because the photons had been absorbed and “directed towards” photolysis of water at the OEC. Thus, the decay of S2 and S3 states of the Kok cycle could be the reason for the multiple values of “quantum requirement for photosynthesis” reported in literature.54 The identification of these photoinhibitory losses and the subsequent LHM development are the principal novelty in the present study.
Role of bulk mixing and intercellular self-shading on algal growth. Intercelllessenedular self-shading (ηSS) was observed to inhibit algal growth in a complex manner. It reduced the amount of light in the immediate vicinity of algal cell  , reduce the organism's growth potential
  and caused the decay of the OEC ionisation states). ηSS was responsible for 30–53% of OEC decay losses at high biomass densities in all the experiments. As seen in Table 5 and Fig. 7c, ηSS augmented OEC decay losses (upto 75%) when pm,n+1 = p. Chlorella vulgaris seemed to counter the detrimental effects of intercellular self-shading by ensuring light-independent repair of inactive PSII leading to the photoacclimation observed in Fig. 7d.
On the other hand, bulk mixing influenced OEC decay losses and μd under various reactor configurations and experimental conditions. While intercellular self-shading of algae was the principal cause of OEC decay losses at high pm,n+1, bulk mixing dominated at as light penetration in the reactor decreased with increasing biomass densities.
In the present study, the OEC decay losses of Chlorella vulgaris were caused by insufficient “continuous-contact time” between the algal cells and light. Bulk mixing may increase the same by usage of air-lift systems and baffles. While air-lift systems control the exposure time of algae to light via liquid circulation velocity, baffles produce eddies which ensure algae are continuously exposed to light for a “desired” contact time. Thus, LHM is useful for designing energy-efficient photobioreactors for maximum utilization of light for algal biomass growth.
PSII degradation and photoacclimation
Validation of PSII degradation kinetics at low biomass densities. Photoinhibition in algae leads to reduction in the quantity of active PSII and subsequently, the quantum yield of photosynthesis; as seen in eqn (4) and (5), respectively. The chlorophyll content (component of active PSII7) of Chlorella vulgaris decreased from 11.56 ± 1.22 to 5.12 ± 0.47 g kg−1 (Fig. 8a) when ρPARi was increased from 3 to 27 mmol photons m−3 s−1 at low biomass densities (Table 1 experiments). This corresponded with the decrease active PSII fraction from 0.84 to 0.25 as predicted by eqn (4) and the PSII degradation kinetic model was validated using experimental data.
 |
| | Fig. 8 (a) Validation of PSII degradation kinetics with experimental chlorophyll content of Chlorella vulgaris at low biomass densities; (b) prediction of photoacclimation in Chlorella vulgaris at different biomass densities when cultivated at Io = 200 μmol photons m−2 s−1, A = 0.18 m2, L:D = 24:0 ( ) and Io = 100 μmol photons m−2 s−1, A = 0.18 m2, L:D = 24:0 ( ) and Io = 100 μmol photons m−2 s−1, A = 0.18 m2, L:D = 24:0 ( ) in FPR of W = 0.02 m and (c) validation of PSII degradation kinetics for Chlorella vulgaris56 and Vicia faba.57 ) in FPR of W = 0.02 m and (c) validation of PSII degradation kinetics for Chlorella vulgaris56 and Vicia faba.57 | |
Prediction of photoacclimation at high biomass densities. Photoacclimation in algae via change in chlorophyll quantity or structure is a protective mechanism to sustain photosynthesis during photoinhibitory conditions.55 When Chlorella vulgaris was cultivated until its biomass density became constant, the chlorophyll content increased from 7.22 ± 0.14 to 10.67 ± 0.85 g kg−1 in algal cells continuously exposed to light at Io = 200 μmol photons m−2 s−1 and remained nearly constant at 9.54 ± 0.40 to 10.88 ± 0.43 g kg−1 when continuously exposed to light at Io = 100 μmol photons m−2 s−1. This trend in photoacclimation of chlorophyll with biomass densities also corresponded with the active PSII fraction as seen in Fig. 8b. Thus, intercellular self-shading of algae, which decreases algal growth as algal biomass concentration increases, also increases photoacclimation of algae at the same.
Utility of LHM
Biomass production in FPR when supplied with CO2. The accuracy of LHM to predict algal growth when CO2 is supplied, at different light intensities and in various FPRs was validated using literature data for Chlorella kessleri58 (5% CO2) and Scenedesmus obliquus59 (10% CO2) as seen in Fig. 9a. LHM fit the growth of Chlorella kessleri cultivated at Io = 50 and 150 μmol photons m−2 s−1 with R2 = 0.9879 and 0.9840, respectively. Similarly, the growth of Scenedesmus obliquus in FPRs of width 0.01 m (R2 = 0.9721) and 0.0155 m (R2 = 0.9730) could be predicted accurately. The weight of Scenedesmus obliquus and Chlorella kessleri were 290 (ref. 59) pg per cell and 2000 (ref. 58) pg per cell, respectively. The model parameters for the literature data are elaborated in Table 7.
 |
| | Fig. 9 (a) Validation of LHM using literature data for Chlorella kessleri58 [p = 0.5 ( ) and 0.775 ( ) and 0.775 ( ) × 10−2 m] and Scenedesmus obliquus59 [Io = 50 ( ) × 10−2 m] and Scenedesmus obliquus59 [Io = 50 ( ) and 150 ( ) and 150 ( ) μmol photons m−2 s−1]. The units for cell density for Scenedesmus obliquus and Chlorella kessleri are 1012 cells m−3 and 1013 cells m−3, respectively; (b) experimental variation in total CO2 captured per day by Chlorella vulgaris at different Xi all FPRs; (c) theoretical and experimental variation in photosynthetic efficiencies (PE) and CO2 capture rates (CCR) with ρPARi in FPR of W = 0.02 m; (d) biomass, lipid and chlorophyll production with associated CO2 capture in fed-batch mode in FPR of W = 0.02 m at Io = 200 μmol photons m−2 s−1, L:D = 24:0, A = 0.18 m2 and (e) FAME profile using gas chromatography. The standard deviation was found to be less than 5% in all the experiments. ) μmol photons m−2 s−1]. The units for cell density for Scenedesmus obliquus and Chlorella kessleri are 1012 cells m−3 and 1013 cells m−3, respectively; (b) experimental variation in total CO2 captured per day by Chlorella vulgaris at different Xi all FPRs; (c) theoretical and experimental variation in photosynthetic efficiencies (PE) and CO2 capture rates (CCR) with ρPARi in FPR of W = 0.02 m; (d) biomass, lipid and chlorophyll production with associated CO2 capture in fed-batch mode in FPR of W = 0.02 m at Io = 200 μmol photons m−2 s−1, L:D = 24:0, A = 0.18 m2 and (e) FAME profile using gas chromatography. The standard deviation was found to be less than 5% in all the experiments. | |
Table 7 Model parameters for LHM using literature data. (A = Amax and p = V/A)
| Model parameters |
Chlorella kessleri58 |
Scenedesmus obliquus59 |
| Im (μmol photons m−2 s−1) |
10 |
10 |
| Io (μmol photons m−2 s−1) |
550.8 |
150 |
| 50 |
| K′ |
1 |
1 |
| Kg,0 |
0.2 |
0.14 |
| Kg,1 |
3 |
2 |
| Kg,2, Kg,3 |
0 |
0 |
| ka (kg−1 m2) |
229 |
229 |
| L:D |
24:00 |
24:00 |
| p (×10−2 m) |
0.5 |
1.2 |
| 0.775 |
| p/po |
1 |
1 |
| μd (h−1) |
0 |
0 |
| μmax (h−1) |
0.04 |
0.036 |
| (pXa)max (kg m−2) |
0.008 |
0.02 |
Energy efficient biorefinery concept. The cultivation of Chlorella vulgaris in FPRs was further investigated for production of lipid, chlorophyll and CO2 capture. High biomass productivities and photosynthetic efficiencies are important for reducing production costs due to downstream processing and light supply. According to LHM, biomass productivities are primarily affected by light supply rate and biomass concentration. Since, algae can capture 50% carbon by weight,2 the CO2 capture potential of Chlorella vulgaris cultivated in all the FPRs at different X was calculated as elaborated in Fig. 9b.The highest biomass productivities and subsequent CO2 capture rates (CCR) occurred when the amount of algae in all the photobioreactors was 0.8 to 1 g. Algae grown in FPR of W = 0.02 m showed the maximum CCR of 2.8 g d−1. Hence, the fed-batch experiments were performed at a starting density of 0.45 ± 0.02 kg m−3. LHM was used to estimate the amount of CO2 capture by 0.45 kg m−3 of Chlorella vulgaris in FPR of W = 0.02 m at different ρPARi (tn+1 − tn = 12 h). The photosynthetic efficiency (PE) of algae under the theoretical illumination condition was determined using60
| |
 | (24) |
where,
Hc = 23.83 MJ kg
−1 is the heat of combustion for
Chlorella vulgaris and was measured using a bomb calorimeter (Parr Instruments, USA);
Klight = 0.218 J μmol
−1 photon is the energy content of photons;
32 Xi and
Xe (kg m
−3) are the algal biomass concentration at the beginning and end of one fed-batch cycle, respectively and (
te −
ti) = 24 h is the duration of a fed-batch cycle.
As seen in Fig. 9c, CCR increases with ρPARi while the PE decreases. The optimum CCR and PE is predicted to occur at ρPARi = 18 mmol photons m−3 s−1. In order to confirm the prediction, the fed-batch experiments were performed at ρPARi = 15, 18 and 21 mmol photons m−3 s−1. The experimental values of CCRs and PEs are elaborated in Table 8 and Fig. 9c. The optimum CO2 capture rate of 1.51 ± 0.045 kg m−3 d−1 was obtained at a photosynthetic efficiency of 5.83%.
Table 8 Results of fed-batch experiments
| ρPARi (mmol photons m−3 s−1) A = 0.18 m2, L:D = 24:00 |
Sodium nitrate concentration (kg m−3) |
Xi (kg m−3) |
Xe (kg m−3) |
PE (%) |
CO2 capture rate (kg m−3 d−1) |
| Initial |
Final |
| 15 |
1 ± 0.023 |
0.404 ± 0.022 |
0.45 ± 0.02 |
1.19 ± 0.01 |
6.26 |
1.36 ± 0.081 |
| 18 |
1 ± 0.032 |
0.334 ± 0.011 |
0.45 ± 0.02 |
1.28 ± 0.02 |
5.82 |
1.51 ± 0.045 |
| 21 |
1 ± 0.018 |
0.379 ± 0.019 |
0.45 ± 0.01 |
1.27 ± 0.01 |
4.92 |
1.49 ± 0.112 |
Conclusions
The LHM developed in the present study accurately estimates the combined influence of light supply, reactor geometry, self-shading, and photoinhibition on algal growth, using first principles, at low computational costs. Furthermore, the phenomenon of photoinhibition was found to consist of PSII degradation and OEC decay dynamics. The PSII degradation kinetics based on PSII self-shading, was developed for the first time and can effectively predict the photooxidative death of algae. Finally, the applicability of LHM was demonstrated for reactor scale-up and process optimization. Thus, OEC ionization state “decay-dynamics” is expected to have a significant impact on the modelling of artificial photosynthesis, engineering design of photobioreactors and development of algal biorefineries. As model refinement is an on-going process, efforts are being made to widen the scope of LHM by integrating it with growth responses due to liquid circulation velocity, CO2 and temperature. Furthermore, the applicability of LHM to alternate reactor configurations is being investigated. The utility of PSII degradation kinetics, with regards to light-stress resistant strains, is also being enhanced.
Acknowledgements
We gratefully acknowledge Prof. Sudipto Ghosh, Department of Metallurgical and Materials Engineering, IIT Kharagpur, for his kind advice and help in the modelling work. We also thank Mr Sesharun Karunamachi for his assistance in lipid profile analysis. GS is grateful to Council of Scientific of Industrial Research, Government of India for financial assistance via Junior Research Fellowship and RD is grateful to Department of Science & Technology, Government of India for INSPIRE Fellowship. The authors are grateful to Dr Tapan Chakrabarti of National Environmental Engineering Research Institute, Nagpur, India for giving Chlorella vulgaris as a gift.
Notes and references
- Y. Shen, RSC Adv., 2014, 4, 49672–49722 RSC.
- Z. L. Sun, S. Z. Xue, C. H. Yan, W. Cong and D. Z. Kong, RSC Adv., 2016, 6, 2703–2711 RSC.
- J. C. Quinn and R. Davis, Bioresour. Technol., 2014, 184, 444–452 CrossRef PubMed.
- Q. Béchet, A. Shilton and B. Guieysse, Biotechnol. Adv., 2013, 31, 1648–1663 CrossRef PubMed.
- A. D. Jassby and T. Platt, Limnol. Oceanogr., 1976, 21, 540–547 CrossRef.
- J. H. Steele, Limnol. Oceanogr., 1962, 7, 137–150 CrossRef.
- A. Guskov, J. Kern, A. Gabdulkhakov, M. Broser, A. Zouni and W. Saenger, Nat. Struct. Mol. Biol., 2009, 16, 334–342 Search PubMed.
- M. Hakala, I. Tuominen, M. Keränen, T. Tyystjärvi and E. Tyystjärvi, Biochim. Biophys. Acta, Bioenerg., 2005, 1706, 68–80 CrossRef PubMed.
- Y. Nishiyama and N. Murata, Appl. Microbiol. Biotechnol., 2014, 98, 8777–8796 CrossRef PubMed.
- P. H. C. Eilers and J. M. F. Peeters, Ecol. Modell., 1988, 42, 199–215 CrossRef.
- C. Zonneveld, J. Theor. Biol., 1998, 193, 115–123 CrossRef.
- F. C. Rubio, F. G. Camacho, J. M. F. Sevilla, Y. Chisti and E. M. Grima, Biotechnol. Bioeng., 2003, 81, 459–473 CrossRef PubMed.
- J. C. Merchuk, F. Garcia-Camacho and E. Molina-Grima, Chem. Biochem. Eng. Q., 2007, 21, 345–355 Search PubMed.
- F. García-Camacho, A. Sánchez-Mirón, E. Molina-Grima, F. Camacho-Rubio and J. C. Merchuck, J. Theor. Biol., 2012, 304, 1–15 CrossRef PubMed.
- B. Forbush, B. Kok and M. Mcgloin, Photochem. Photobiol., 1971, 14, 307–321 CrossRef.
- D. P. Singh, N. Singh and K. Verma, Curr. Microbiol., 1995, 31, 44–48 CrossRef.
- W. Zevenboom and L. R. Mur, Arch. Microbiol., 1984, 139, 232–239 CrossRef.
- R. Bouterfas, M. Belkoura and A. Dauta, Lemnetica, 2006, 25, 647–656 Search PubMed.
- Z. AminiKhoeyi, J. Seyfabadi and Z. Ramezanpour, Aquacult. Int., 2012, 20, 41–49 CrossRef.
- S. Takahashi and N. Murata, Trends Plant Sci., 2008, 13, 178–182 CrossRef PubMed.
- D. Campbell and E. Tyystjärvi, Biochim. Biophys. Acta, Bioenerg., 2012, 1817, 258–265 CrossRef PubMed.
- E. Tyystjärvi, M. Hakala and P. Sarvikas, Photosynth. Res., 2005, 84, 21–27 CrossRef PubMed.
- B. Kok, B. Forbush and M. Mcgloin, Photochem. Photobiol., 1970, 11, 457–475 CrossRef PubMed.
- G. T. Babcock, R. E. Blankenship and K. Sauer, FEBS Lett., 1976, 61, 286–289 CrossRef PubMed.
- E. G. Evers, Biotechnol. Bioeng., 1991, 38, 254–259 CrossRef PubMed.
- P. van Bodegom, Microb. Ecol., 2007, 53, 513–523 CrossRef PubMed.
- E. Sforza, S. Urbani and A. Bertucco, J. Appl. Phycol., 2015, 27, 1453–1462 CrossRef CAS.
- A. B. Fulke, S. Mudliar, R. Yadav, A. Shekh, N. Srinivasan, R. Ramanan, K. Krishnamurthi, S. Devi and T. Chakrabarti, Bioresour. Technol., 2010, 101, 8473–8476 CrossRef CAS PubMed.
- H. Nichols and H. Bold, J. Phycol., 1965, 1, 34–38 CrossRef.
- E. Sierra, F. G. Acién, J. Fernández, J. L. García, C. González and E. Molina, Chem. Eng. J., 2008, 138, 136–147 CrossRef CAS.
- Y. Ge, J. Liu and G. Tian, Bioresour. Technol., 2011, 102, 130–134 CrossRef CAS PubMed.
- R. W. Thimijan and R. D. Heins, HortScience, 1983, 18, 818–822 Search PubMed.
- R. H. Foy, C. E. Gibson and R. V. Smith, Eur. J. Phycol., 1976, 11, 151–163 Search PubMed.
- S. L. Meseck, J. H. Alix and G. H. Wikfors, Aquaculture, 2005, 246, 393–404 CrossRef.
- G. De Bhowmick, G. Subramanian, S. Mishra and R. Sen, Algal Res., 2014, 6, 201–209 CrossRef.
- Y. Lee and S. Hui, in Handb. Microalgal Cult., ed. A. Richmond, Blackwell Publishing Ltd, Oxford, 2004, ch. 3, pp. 40–57 Search PubMed.
- D. J. Nicholas and A. Nason, Methods Enzymol., 1957, 3, 981–984 Search PubMed.
- R. Dineshkumar, S. K. Dash and R. Sen, RSC Adv., 2015, 5, 73381–73394 RSC.
- Q. Zheng, G. J. O. Martin and S. Kentish, Energy Environ. Sci., 2016, 9, 1074–1082 CAS.
- H. Qiang and A. Richmond, J. Appl. Phycol., 1996, 8, 139–145 CrossRef.
- A. Richmond and Z. Cheng-Wu, J. Biotechnol., 2001, 85, 259–269 CrossRef CAS PubMed.
- J. Degen, A. Uebele, A. Retze, U. Schmid-Staiger and W. Trösch, J. Biotechnol., 2001, 92, 89–94 CrossRef CAS PubMed.
- H. E. Tamiya, E. Hase, K. Shibata, A. Mituya and T. Iwamura, in Algae Cult. From Lab. To Pilot Plant, Growth Algae Mass Cult., ed. J. S. Burlew, Carnegie Institution of Washington, Washington, DC, 1953, ch. 16, pp. 205–232 Search PubMed.
- E. Romero, R. Augulis, V. I. Novoderezhkin, M. Ferretti, J. Thieme, D. Zigmantas and R. can Grondelle, Nat. Phys., 2014, 10, 676–682 CrossRef CAS PubMed.
- W. J. Oswald, in Micro-Algal Biotechnol., ed. M. A. Borowitzka and L. J. Borowitzka, Cambridge Univ. Press New York, New York, USA, 1988, ch. 14, pp. 357–394 Search PubMed.
- E. Sforza, D. Simionato, G. M. Giacometti, A. Bertucco and T. Morosinotto, PLoS One, 2012, 7, e38975 CAS.
- I. Dogaris, M. Welch, A. Meiser, L. Walmsley and G. Philippidis, Bioresour. Technol., 2015, 198, 316–324 CrossRef CAS PubMed.
- C. Lee and B. Palsson, Biotechnol. Bioeng., 1994, 44, 1161–1167 CrossRef CAS PubMed.
- A. Richmond, Z. Cheng-Wu and Y. Zarmi, Biomol. Eng., 2003, 20, 229–236 CrossRef CAS PubMed.
- H. Qiang, Y. Zarmi and A. Richmond, Eur. J. Phycol., 1998, 33, 165–171 CrossRef.
- Q. Hu, H. Guterman and A. Richmond, Biotechnol. Bioeng., 2000, 51, 51–60 CrossRef.
- J. W. F. Zijffers, K. J. Schippers, K. Zheng, M. Janssen, J. Tramper and R. H. Wijffels, Mar. Biotechnol., 2010, 12, 708–718 CrossRef CAS PubMed.
- A. M. J. Kliphuis, L. de Winter, C. Vejrazka, D. E. Martens, M. Janssen and R. H. Wijffels, Biotechnol. Prog., 2010, 26, 687–696 CrossRef CAS PubMed.
- J. F. Hill and Govindjee, Photosynth. Res., 2014, 122, 97–112 CrossRef CAS PubMed.
- A. L. N. Bautista and O. Necchi Jr, Braz. J. Plant Physiol., 2007, 19, 23–34 CrossRef CAS.
- D. P. Maxwell, S. Falk, C. G. Trick and N. Huner, Plant Physiol., 1994, 105, 535–543 CAS.
- É. Hideg, T. Kálai, K. Hideg and I. Vass, Biochemistry, 1998, 37, 11405–11411 CrossRef PubMed.
- N. J. Kim and C. G. Lee, Biotechnol. Bioprocess Eng., 2001, 6, 352–358 CrossRef CAS.
- B. Gris, T. Morosinotto, G. M. Giacometti, A. Bertucco and E. Sforza, Appl. Biochem. Biotechnol., 2014, 172, 2377–2389 CrossRef CAS PubMed.
- D. Soletto, L. Binaghi, L. Ferrari, A. Lodi, J. C. M. Carvalho, M. Zilli and A. Converti, Biochem. Eng. J., 2008, 39, 369–375 CrossRef CAS.
Footnote |
| † Electronic supplementary information (ESI) available: Development of light harvesting model. See DOI: 10.1039/c6ra08900c |
|
| This journal is © The Royal Society of Chemistry 2016 |
Click here to see how this site uses Cookies. View our privacy policy here. 
 . The average incident light intensity is Io (number of photons m−2 s−1). The algal biomass density X (kg m−3) is assumed to vary with time t (s), in a stepwise manner. The present analysis considers the (n + 1)th time interval where the biomass density is Xn (kg m−3) for tn ≤ t < tn+1 and changes instantly to Xn+1 by cell division at t = tn+1. The reactor is exposed alternately to light and darkness so that, the ratio of light to dark cycle is denoted by L
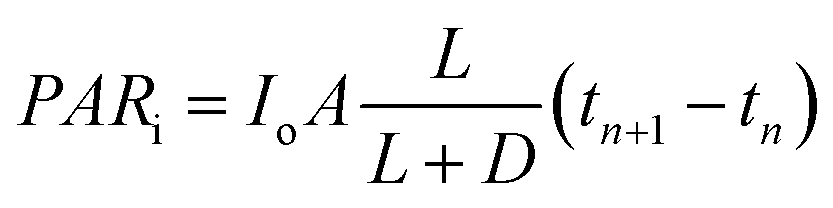


 , Kc = constant of proportionality for quantum yield (mol cell per mol PSII), ηOEC,n+1 = efficiency of photolysis of water at OEC in the (n + 1)th time interval and
  such that kp and kr are rate constants of PSII degradation and PSII repair, respectively.


 and ηOEC,n+1 ≈ 1 ∀ n and eqn (14) reduces into the intrinsic kinetics of algal growth.


 at the same (Fig. 4b).


 that have occurred from t = 0 to t = tn, VρPARi(tn − t0) = the total number of photons incident on the FPR from t = 0 to t = tn and
  . Thus, ω is constant for an experiment in FPR of W = 0.02 m.
 ), [100, 0.18, 24
 ), [66.67, 0.18, 24
 ), [200, 0.18, 24
 ) and[200, 0.18, 24
 ). The units pf Io, A, L
 , reduce the organism's growth potential
  and caused the decay of the OEC ionisation states). ηSS was responsible for 30–53% of OEC decay losses at high biomass densities in all the experiments. As seen in Table 5 and Fig. 7c, ηSS augmented OEC decay losses (upto 75%) when pm,n+1 = p. Chlorella vulgaris seemed to counter the detrimental effects of intercellular self-shading by ensuring light-independent repair of inactive PSII leading to the photoacclimation observed in Fig. 7d.
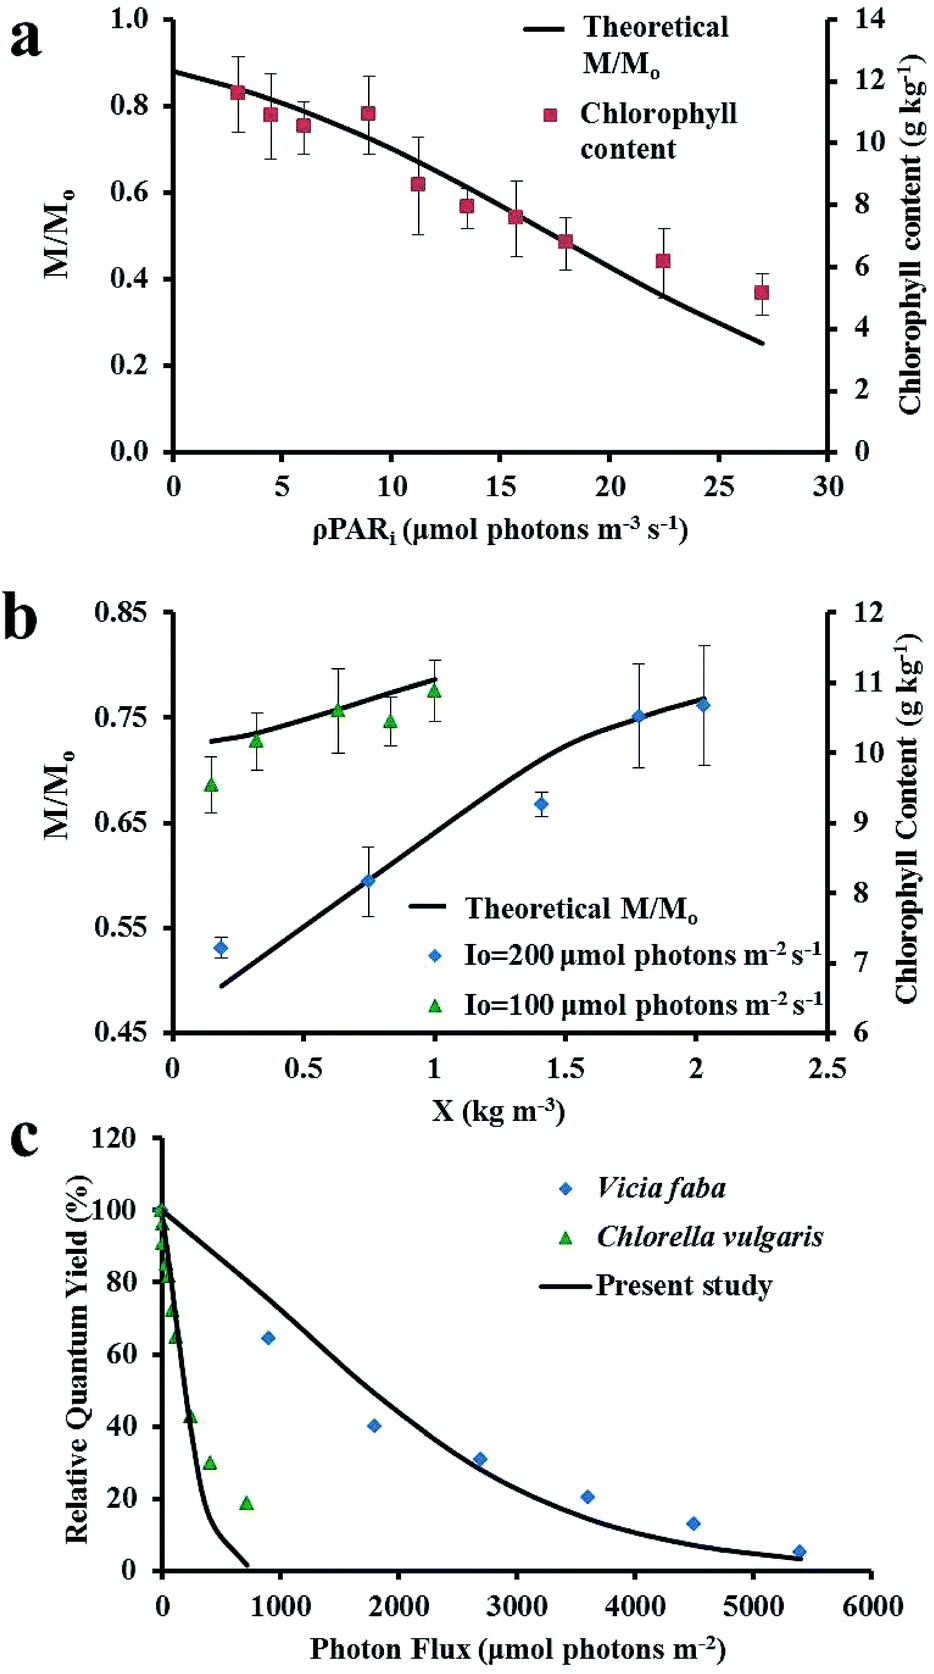
 ) and Io = 100 μmol photons m−2 s−1, A = 0.18 m2, L
 ) in FPR of W = 0.02 m and (c) validation of PSII degradation kinetics for Chlorella vulgaris56 and Vicia faba.57
 . The relative quantum yield of 100% in Fig. 8c corresponds to a quantum yield of 0.72 in dark. The model developed in the present study successfully predicted the termination of photosynthesis at high light intensities and is distinct from alternate PSII degradation kinetics models10–12,14,21 in literature which assume the rate of PSII repair
  11,12,14 and do not model the damaging effects of singlet oxygen on the PSII repair process.10–12,14,21 Hence, they fail to predict the complete photooxidative destruction of chlorophyll (M = 0) under light stress.

 ) and 0.775 (
 ) × 10−2 m] and Scenedesmus obliquus59 [Io = 50 (
 ) and 150 (
 ) μmol photons m−2 s−1]. The units for cell density for Scenedesmus obliquus and Chlorella kessleri are 1012 cells m−3 and 1013 cells m−3, respectively; (b) experimental variation in total CO2 captured per day by Chlorella vulgaris at different Xi all FPRs; (c) theoretical and experimental variation in photosynthetic efficiencies (PE) and CO2 capture rates (CCR) with ρPARi in FPR of W = 0.02 m; (d) biomass, lipid and chlorophyll production with associated CO2 capture in fed-batch mode in FPR of W = 0.02 m at Io = 200 μmol photons m−2 s−1, L