Gas permeability, mechanical behaviour and compostability of fully-aliphatic bio-based multiblock poly(ester urethane)s

Laura Genovesea, Michelina Soccioa, Matteo Gigli*a, Nadia Lotti*a, Massimo Gazzanob, Valentina Siracusac and Andrea Munaria
aCivil, Chemical, Environmental and Materials Engineering Department, University of Bologna, Via Terracini 28, 40131, Bologna, Italy. E-mail: matteo.gigli@unibo.it; nadia.lotti@unibo.it; Fax: +39 051 2090322; Tel: +39 051 2090354
bOrganic Synthesis and Photoreactivity Institute, CNR, Via Selmi 2, 40126, Bologna, Italy
cDepartment of Chemical Science, University of Catania, Viale A. Doria 6, 95125 Catania, Italy

Received 6th April 2016 , Accepted 31st May 2016

First published on 1st June 2016


Abstract

A family of poly(ester urethane)s obtained by chain extending hydroxyl-terminated polyester prepolymers has been studied. Poly(butylene cyclohexanedicarboxylate) has been coupled in different mass ratios with two poly(butylene succinate)-based random copolymers containing ether linkages. So, five high molecular weight bio-based poly(ester urethane)s have been designed. The effect of the chemical structure and of the mass ratio of the two blocks in the final polymer has been evaluated by characterizing the materials from a molecular, thermal and mechanical point of view. In addition, envisioning a food packaging application, biodegradation in compost and measurement of the gas barrier properties have been carried out and correlated to the polymer chemical structure. The activation energy of the gas permeation process has been calculated, too. The results highlight that through the adopted strategy it is possible to prepare a new class of promising materials whose properties can be easily tailored by acting on two parameters: the mass ratio between the two prepolymers in the final material and the chemical structure of each block.

1. Introduction

Together with the increase of the world's population, food demand is continuously growing. Nowadays, food products often travel a long way before reaching the final consumer. Therefore, their freshness and quality must be preserved and prolonged as much as possible. The traditionally used food packages, made of glass or metal cans, have been rapidly replaced by plastic materials, due to their superior performance in terms of mechanical properties, lightness and costs.

This trend is confirmed by the data concerning the use of plastic materials. Packaging alone accounts for about 40% of the European plastic market.1

The main scope of plastic packaging is to protect the product from spoilage caused by environmental factors, like gases, chemical agents, microorganisms, odors, vibrations, shocks or compressive forces.2 Oil-based plastics are cheap and well respond to the above mentioned requirements. Therefore, they are widely employed in the packaging industry. Polyethylene (PE), polypropylene (PP), poly(ethylene terephthalate) (PET) and nylon are the most commonly used polymers in this regard.3 However, because of their low biodegradability, these materials accumulated over the years in the environment where they were disposed as waste, causing serious pollution problems.

A more sustainable alternative is represented by biopolymers. The term biopolymer stands for bio-based and biodegradable polymers (such as poly(lactic acid) or starch), bio-based, but not biodegradable polymers (such as bio-PE) or oil-based biodegradable polymers (like poly(ε-caprolactone) (PCL)). In particular, biodegradable polymers, either obtained from fossil or renewable resources, may mitigate the environmental issues related to the extensive use of packaging materials. Although very interesting, biodegradable polymers are not yet widely employed for packaging applications, due to their higher costs and lower performances, especially as regards the barrier properties, with respect to traditional plastics.3

Different strategies can be employed to improve the barrier performances of packaging, such as using multilayer structures or coatings, the blending of two or more polymers, the chemical modification through copolymerization or grafting, the design of composites or nanocomposites.3

In this framework, with the aim of designing new biodegradable high-performance polymers, we have studied fully-aliphatic multiblock copolymers based on poly(butylene cyclohexanedicarboxylate) (PBCE) and poly(butylene succinate-co-diglycolate) random copolymers (P(BSxBDGy)).

Hydroxyl-terminated poly(butylene cyclohexanedicarboxylate) (PBCE-OH) and poly(butylene succinate-co-diglycolate) random copolymers with two different compositions (P(BS70BDG30)-OH and P(BS50BDG50)-OH) have been synthesized by melt polycondensation. Then, high molecular weight poly(ester urethane)s have been prepared by chain-extension with hexamethylene diisocyanate (HDI). Each polymer has been obtained by coupling together PBCE-OH with P(BS70BDG30)-OH or P(BS50BDG50)-OH in different mass ratios. All the monomers employed in the synthesis of the prepolymers can be potentially prepared from renewable resources. While the pathways to 1,4-butanediol and succinic acid are well-known,4 1,4-cyclohexanedicarboxylic acid can be prepared through hydrogenation of bio-based terephthalic acid derived from limonene.5 Finally, a bio-based route to diglycolic acid can be also hypothesized, starting from bioethanol. Diethylene glycol, from which diglycolic acid is prepared, is produced by the partial hydrolysis of ethylene oxide that, in turn, is obtained by direct oxidation of ethylene. Last but not least, ethylene can be produced via dehydration of bioethanol.

The monomer selection has been dictated by the need of optimizing the contribution of each prepolymeric block. PBCE has been chosen because of its high melting point and good barrier behavior,6,7 while ether-oxygen containing copolymers have been considered because of their improved chain flexibility and higher biodegradation rate.8,9

As above mentioned, low gas permeability is highly desirable to prolong the product shelf-life. To avoid food deterioration during storage, various techniques have been adopted over the years, such as lower storage temperatures and/or the use of modified atmosphere packaging (MAP).10 To define the more suitable packaging for a certain type of food and to assure the optimum inside atmosphere conditions, the food respiration rate and the gas permeability through the polymer matrix must be taken into account. These two factors are linked to each other and depend on other parameters, such as film thickness and storage temperature.

To analyze the barrier properties of the synthesized polymers and to better understand structure/property relations, a deep permeability characterization has been carried out by employing different gases (O2, CO2, N2 and C2H4) and temperatures (8, 15, 23 °C).

The main permeants studied in packing technology are O2, CO2 and N2. The O2 concentration is responsible for the food respiration rate. Lower respiration rate slows down the enzymatic degradation. On the contrary, high O2 levels accelerate tissue deterioration, causing off-odors production.11 Carbon dioxide has an antimicrobial effect on the packaged food,12 while N2 is an inert gas used to complete the inside package atmosphere and to prevent the film collapse.11 C2H4 permeability was on the contrary analyzed because this gas promotes the enzymatic activities, softening and ripening of fresh food like cut fruit and vegetables. It is responsible for increased chlorophyllase activity that causes chlorophyll destruction and its conversion to the olive brown pheophorbide, with changes in chromatic characteristics of the vegetable tissue.13

Lastly, to describe the temperature dependence of the permeation process, the Arrhenius model was employed to calculate the activation energy for gas transmission (EGTR), heat of solution (HS) and diffusion (ED) processes.

2. Materials and methods

2.1. Materials

Trans-cyclohexane-1,4-dicarboxylic acid (CHDA) was purchased from TCI (Tokyo, Japan), while succinic acid (SA), diglycolic acid (DGA), 1,4-butanediol (BD), titanium tetrabutoxide (Ti(OBu)4) and hexamethylene diisocyanate (HDI) were obtained from Sigma Aldrich (Saint Louis, MO, USA). CHDA, SA, GA, BD, and HDI were used as supplied. Ti(OBu)4 was distilled prior to use.

2.2. Polymer synthesis

PBCE-OH, P(BS50BDG50)-OH and P(BS70BDG30)-OH have been synthesized by two-step melt polycondensation by reacting respectively BD and CHDA and BD, SA and DGA in different molar ratios (SA/GA = 70/30 and SA/GA = 50/50). 60% molar excess of diol was used with respect to the diacid content. Ti(OBu)4 (150 ppm of Ti per g of polymer) was employed as catalyst. In a typical setup, a 200 mL glass reactor was placed in a silicon oil bath. Nitrogen flow was applied and the temperature was set at 190 °C. When more than 90% of the water produced during esterification was distilled off (about 90 min), pressure was gradually reduced to 0.1 mbar and the temperature was risen to 220 °C. Polymerization reaction was stopped when a torque increase of 2–3 N cm, with respect to the value recorded at the beginning of the synthesis, was observed. The so-obtained prepolymers were purified by dissolution in chloroform and precipitation in methanol. The samples were kept under vacuum at room temperature for at least one week to remove the residual solvent.

Chain extension reactions were performed at 170 °C under nitrogen atmosphere. HDI was added to the molten prepolymers. The reactions were carried out until a constant torque was measured. An equimolar amount of isocyanate groups with respect to the –OH terminal groups concentration was considered. The PEUs were purified by dissolution in chloroform and precipitation in methanol.

Multiblock copolymers were prepared by chain extending PBCE-OH (A) with P(BS70BDG30)-OH (B) and P(BS50BDG50)-OH (C) in different mass percentages. The polymers obtained are thus A50B50, A30B70, A50C50, A30C70. The values of the acronyms represent the feed mass percentages of each prepolymer. Chain extended PBCE was also considered for sake of comparison.

2.3. Filming process

Films were prepared by compression moulding. The polymer powders were placed between Teflon sheets in a Carver press (Wabash, IN, USA) at 40 °C above the melting temperature. When molten, a pressure of 2 metric tons was applied for 2 min. Finally, films were cooled down to room temperature in press by using tap water, keeping the pressure applied. Prior to analyses, the films were stored at room temperature for at least 15 days to attain equilibrium crystallinity.

The thickness of each film was measured with a DMG Sample Thickness tester. The average of 50 different measurements has been considered.

2.4. Characterization

Polymer structure and molecular composition were evaluated by 1H-NMR spectroscopy at room temperature. A Varian Inova 400 MHz instrument (Agilent Technologies, USA) was used for the measurements.

Molecular weights were determined by gel-permeation chromatography (GPC) at 30 °C with a 1100 HPLC system (Agilent Technologies, Santa Clara, CA, USA) equipped with PLgel 5 μm MiniMIX-C column (Agilent Technologies). A refractive index was employed as detector. Chloroform was used as eluent with a 0.3 mL min−1 flow and sample concentrations of about 2 mg mL−1. A molecular weight calibration curve was obtained with polystyrene standards in the range of molecular weight 800–100[thin space (1/6-em)]000 g mol−1.

Static contact angle measurements were performed on polymer films using a KSV CAM101 (KSV, Espoo, Finland) instrument at ambient conditions, by recording the side profiles of deionized water. At least five drops were observed on different areas of each film. Image analysis was carried out with a Drop Shape Analysis software. Contact angles are reported as the average value ± standard deviation.

TGA was carried out under nitrogen atmosphere by means of a Perkin Elmer TGA7 apparatus (Waltham, MA, USA). Gas flow of 30 mL min−1 and heating scan of 10 °C min−1 were used for the analyses.

A Perkin Elmer DSC6 was used for the calorimetric measurements. Aluminium pans containing about 10 mg of polymeric samples were heated up from −70 °C to 40 °C above fusion temperature at a rate of 20 °C min−1. Crystallization rate under non-isothermal conditions was determined by heating the samples to about 40 °C above fusion, kept there for 3 min and then cooled at 5 °C min−1.

X-ray diffraction (XRD) patterns of polymeric films were performed in the wide-angle region by means of a PANalytical X'PertPro diffractometer (Almelo, The Netherlands) equipped with a fast X'Celerator detector. The radiation was supplied by a copper target (λ = 0.1548 nm) and 567 points at interval 0.1° (2θ) were scanned for 100 s each. The crystallinity index Xc was calculated as the ratio between the area subtended by the peaks and the total diffraction area, cleaned by the incoherent scattering.

A Zwick Roell Texture machine (Ulm, Germany) mod. Z2.5, equipped with a rubber grip and a 500 N load cell was used for the measurements. The tensile measurements were carried out in accordance to the ASTM D882-09 (Standard Test Method for Tensile Properties of Thin Plastic Sheeting), with some modifications. Rectangular films of length equal to 50 mm and width of 5 mm were employed. Initial grip-to-grip separation was 23 mm and the crosshead speed of 50 mm min−1. At least five replicates were run for each sample and the results are provided as the average ± standard deviation. Cycling loading (20 cycles) was performed under the same experimental conditions, and the film samples were strained to 50%.

SEM micrographs were acquired on a desktop Phenom microscope (Phenom-World B.V., Eindhoven, The Netherlands) on gold sputtered films glued with carbon tape on aluminium stabs.

2.5. Composting

Degradation tests were performed at 58 °C. Each poly(ester urethane) film (diameter of 16 mm, 0.2 mm thick) was placed in a darkened vessel and sandwiched between two layers of compost (20 g each). Finally, 10 mL of deionized water were added. Mature compost provided by HerAmbiente S.p.A. (Bologna, Italy) has been used for the experiments. The compost had the following composition (as declared by the supplier): pH: 8.15; salinity: 2.88 dS m−1; organic carbon: 22.08% of the dry solid; humic and fulvic carbon: 13.44% of the dry solid; C/N ratio: 12.97.

Sample dry weight was measured prior to incubation. At predetermined time intervals, specimens were recovered from compost, washed according to the procedure previously described,14 and dried to constant weight. The mass loss was gravimetrically determined.

2.6. Permeability measurements

Permeability tests were performed by a manometric method. A Permeance Testing Device, type GDP-C (Brugger Feinmechanik GmbH, Munich, Germany), according to ASTM 1434-82, DIN 53 536 in accordance with ISO 15105-1 and according to Gas Permeability Testing Manual (Registergericht München HRB 77020, Brugger Feinmechanik GmbH). Method A was employed in the analysis, as just reported in the Brugger manual, with evacuation of top/bottom chambers.

The film (of an area of 0.785 cm2) was placed between two chambers. A film mask has been used to cover the rest of the permeation chamber. The amount of gas flowing through the membrane is determined from the pressure variation due to the gas accumulation in the closed downstream chamber. Gas Transmission Rate (GTR) was determined considering the pressure increase in relation to the time and the volume of the device. Time lag (tL), diffusion coefficient (D) and solubility (S) of the test gases have been also measured. The mathematical relations used for the calculations are well reported in the literature.15–18

Measurements have been carried out at 8, 15 and 23 °C with a gas stream of 100 cm3 min−1, 0% of gas RH. Chamber and sample temperature were controlled by an external thermostat, KAAKE-Circulator DC10-K15 type (Thermoscientific, Selangor Darul Ehsan, Malaysia).

The following 100% pure food grade gases were used: O2, CO2, N2, C2H4. All experiments were run in triplicate and results are provided as the average ± standard deviation.

2.7. Film color

The color and transparency of film samples were measured using a HunterLab ColorFlex EZ 45/0° color spectrophotometer with D65 illuminant, 10° observer (according to ASTM E308). Measurements were made using CIE Lab scale. The instrument was calibrated with a black and white tile before the measurements. Results were expressed as L* (lightness), a* (red/green) and b*(yellow/blue) parameters. The total color difference (ΔE) was calculated using the following equation:
 
ΔE = [(ΔL)2 + (Δa)2 + (Δb)2]0.5 (1)
where ΔL, Δa and Δb are the differentials between a sample color parameter (L*, a*, b*) and the color parameter of a standard white plate used as the film background (L′ = 66.52, a′ = −0.71, b′ = 1.16). Chromaticity (C*) and hue angle (hab) were calculated in accordance to the following formulas:19,20
 
C* = [(a*)2 + (b*)2]0.5 (2)
 
hab = tan−1(b*/a*) (3)

Measurements were carried out in triplicate at random positions over the film surface. Average values are reported.

3. Results and discussion

3.1. Prepolymer synthesis and characterization

The purified and dried hydroxyl-terminated prepolymer powders have been characterized from the molecular and thermal point of view (Table 1). Their molecular structure is represented in Fig. 1. The n and m indices represent the DP of PBCE and of PBS-based copolymers respectively (Table 1), while x and y stand for the chemical composition of the PBS-based copolymers.
Table 1 Molecular and thermal characterization data of OH-terminated prepolymers
Polymer Mna PDIa DPb Mnb BS mol%b Tg (°C) Tm (°C) ΔHm (J g−1)
a Determined by GPC.b Determined by 1H-NMR.
PBCE-OH 7700 2.7 18 4100 n.d. 171 46
P(BS70BDG30)-OH 9300 2.9 35 6200 68.5 −30 89 58
P(BS50BDG50)-OH 8600 2.6 27 4900 49.2 −32 61 40


image file: c6ra08882a-f1.tif
Fig. 1 Chemical structure of PBCE-OH (above) and P(BSxBDGy)-OH (below).

1H-NMR has been employed to verify the chemical structure and composition of the P(BSxBDGy)-OH (Fig. 2) and PBCE-OH (Fig. S1). In all cases the spectra are consistent with the expected structure and the composition of the P(BSxBDGy)-OH is very close to the feed one. The areas of the peaks of h protons of the succinic subunit located at 2.61 ppm and of the k protons of the diglycolic subunit at 4.24 ppm have been used to deduce the copolymer composition (Fig. 2).


image file: c6ra08882a-f2.tif
Fig. 2 1H-NMR spectrum of P(BS70BDG30)-OH with resonance assignments. In the inset, an enlargement of the section showing the terminal groups.

Due to the catalyst employed and the high temperatures involved in the reaction, the P(BSxBDGy)-OH display a random distribution of the comonomeric sequences.8

The molecular weights have been determined by GPC and 1H-NMR. Mn from 1H-NMR has been calculated according to the following formula, as previously described:21

 
Mn = DP × Mw,unit + X (4)
where DP is the degree of polymerization determined by NMR, Mw,unit is the molecular weight of the repeating unit (226 g mol−1 for PBCE, 177 g mol−1 for P(BS70BDG30) and 182 g mol−1 for P(BS50BDG50)) and X is the molecular weight of the terminal butanediol (100% hydroxyl-terminated polymers have been considered).

The DP has been determined from the NMR spectrum of each prepolymer sample according to the following equation:

 
DP = [(Ic/2)/It] × 2 + 1 (5)
where Ic and It represent the integrated intensities of the resonance signals of the glycol subunit within the polymeric chain and of the terminal glycol, respectively.

For example, for the determination of the DP of P(BS70BDG30)-OH, the sum of the integrated intensities of the peaks of f and i protons of the butanediol subunit (located at 4.11 and 4.19 ppm respectively) and the intensity of the peak of l protons of the terminal butanediol (located at 3.67 ppm) have been considered (Fig. 2).

Table 1 shows that the molecular weights calculated by 1H-NMR and GPC follow a similar trend and have the same order of magnitude. Although the values observed by the two techniques are different, the results obtained are quite satisfying also considering that GPC analysis provides an indirect measure of the molecular weight. Polydispersity is a bit higher than the typical range of polycondensation reactions (i.e. between 2.1 and 2.3), probably because of the selected reaction conditions (high excess of butanediol, shorter reaction time and lower temperature), which have been optimized to achieve a high concentration of hydroxyl terminal groups.

The thermal transitions, obtained from I scan DSC, have been reported in Table 1. All the samples are semicrystalline, but the melting and glass transition temperatures present some differences. In particular, PBCE-OH show a Tm of about 170 °C, while the PBS-based prepolymers display much lower melting endotherms, below 90 °C, and Tg well below room temperature. These effects are due to two main factors: the presence of a comonomeric unit and the linear aliphatic nature of the macromolecular chain.

3.2. Polymer synthesis, molecular and thermal characterization

High molecular weight polymers have been prepared by chain extending with HDI the OH-terminated prepolymers. In Fig. 3, the general chemical structure of the resulting poly(ester urethane)s is represented. After the purification process, no unreacted HDI was detected by 1H-NMR. In Fig. 4 the spectrum of A50B50 is reported as an example.
image file: c6ra08882a-f3.tif
Fig. 3 Chemical structure of PBCE-based multiblock poly(ester urethane)s.

image file: c6ra08882a-f4.tif
Fig. 4 1H-NMR spectrum of A50B50 with resonance assignments of HDI.

Together with the peaks of the prepolymers blocks (not labelled), the protons of the reacted chain extender (w, x and y located at 3.15 ppm, 1.34 ppm and 1.25 ppm, respectively) can be detected. All the spectra are consistent with the awaited structure.

Table 2 contains the molecular, thermogravimetric and wettability characterization data. As it can be seen from Table 2, the chain extension process resulted in a significant increase of the polymer molecular weight. From the polymer purified powders, thin film have been obtained by compression moulding. Before characterization, they have been stored at room temperature for at least two weeks in order to achieve equilibrium crystallinity.

Table 2 Molecular, thermogravimetric and wettability characterization data
Polymer Mna PDIa Tonset Tmax WCA (°)
a Determined by GPC.
PBCE 36[thin space (1/6-em)]000 2.7 328 420 98 ± 3
A50B50 37[thin space (1/6-em)]000 3.0 315 414 90 ± 3
A30B70 52[thin space (1/6-em)]400 3.3 313 403 90 ± 3
A50C50 35[thin space (1/6-em)]500 3.2 313 414 87 ± 2
A30C70 51[thin space (1/6-em)]000 2.8 303 395 84 ± 1


Afterwards, the thermal stability has been analysed by TGA under nitrogen flux. The temperatures relative to the degradation onset (Tonset) and to the maximum weight loss rate (Tmax) have been reported in Table 2. The thermal degradation of the polymers under study is characterized by one-step weight loss that starts above 300 °C. The PBCE is the more stable material, thanks to the presence of the aliphatic ring, which confers good thermal resistance.22

For the copolymers, it can be observed that the higher the amount of PBCE blocks, the higher the stability. For equal PBCE content, the lower the amount of butylene diglycolate co-units (BDG) the higher the stability, as previously observed.8 The main thermal transition data of the multiblock copolymers under study are reported in Table 3.

Table 3 Thermal characterization data
Polymer I scan, DSC Tc,1 (°C) ΔHc,1 (J g−1) Tc,2 (°C) ΔHc,2 (J g−1)
Tg (°C) ΔCp (J °C−1 g−1) Tm,1 (°C) ΔHm,1 (J g−1) Tm,2 (°C) ΔHm,2 (J g−1)
PBCE 10 0.056 166 34 143 38
A50B50 −34 0.303 44 9 141 13 8 2 116 16
A30B70 −31 0.366 63 18 132 7 31 15 104 8
A50C50 −29 0.444 49 3 114 20 96 18
A30C70 −32 0.470 47 9 109 6 −1 1 90 9


Fig. 5 contains the calorimetric traces of PBCE and the multiblock copolymers. The glass transition of PBCE is not clearly visible due to the high crystallinity of this sample (Fig. S2 reports an enlargement of the PBCE calorimetric curve in the Tg region), while all the copolymers display a Tg of about −30 °C, due to the flexibilizing effect imparted by the linear aliphatic PBS-based chains. In all cases, both in the first and second scan, a single Tg is visible, indicating good miscibility in the amorphous phase (Fig. 5).


image file: c6ra08882a-f5.tif
Fig. 5 Calorimetric curves of PBCE and multiblock copolymers. Solid lines: 1st scan; dash lines: 2nd scan after quenching from the melt.

As to the melting phenomenon, PBCE homopolymer displays a very high melting temperature. The melting phenomenon is characterized by multiple peaks, ascribed to fusion and recrystallization processes, as already observed for this and other aliphatic polyesters.23–25 A small endothermic peak is also visible at 52 °C. This phenomenon can be ascribed to the presence of a small amount of PBCE crystals with a low degree of perfection, as previously observed.26

On the contrary, the copolymers are marked out of two well distinct melting endotherms, whose intensity well correlates with their composition (Fig. 5). In each copolymer, to a higher amount of PBS-based blocks corresponds a higher intensity of the lower temperature melting endotherm (ΔHm,1, Table 3).

Similarly, an increased content of PBCE blocks resulted in a more intense melting endotherm at higher temperatures (ΔHm,2, Table 3). Moreover, as already observed for the prepolymers, the P(BS70BDG30) block (B) displays a higher capacity to crystallize with respect to P(BS50BDG50) (C) in the poly(ester urethane)s (Fig. 5). The Tm follows a similar trend. It is worth highlighting that the presence of P(BS50BDG50) causes the formation of less perfect PBCE crystals with respect to multiblock copolymers containing P(BS70BDG30), as well indicated by the lowering of the Tm (Table 3).

Deeper investigation on the nature of the crystalline phase has been carried out by WAXS and the results have been displayed in Fig. 6.


image file: c6ra08882a-f6.tif
Fig. 6 X-ray diffraction patterns of PBCE and the multiblock copolymers (A). Comparison of PBCE and P(BS50BDG50)-OH patterns together with their corresponding copolymers (B). Comparison of PBCE and P(BS70BDG30)-OH patterns together with their corresponding copolymers (C).

All the copolymers show less intense, broader and more convoluted peaks with respect to the PBCE homopolymer, suggesting a significant drop of the crystallinity degree with the relative increase of the crystal inhomogeneity. The analysis of the diffraction profiles reveals that all the samples contain more than one crystal phase. PBCE sample shows strong peaks at 15.0°, 18.1°, 20.6°, 22.5°, 28.6° that can be assigned to the main PBCE crystal phase, and broader peaks at 9.3°, 16.25°, 19.2°, 19.6°, 24.5°, probably due to a secondary PBCE phase.

The copolymers richer in PBCE blocks display a XRD pattern very similar to that of PBCE, but contain an extra peak at 19.9° that confirms the presence of an extra crystalline phase that can be ascribed to PBS (Fig. 6). In the copolymers containing a higher amount of PBS-based blocks, the PBS crystalline phase becomes indeed more evident (Fig. 6). Therefore, the XRD results are in perfect agreement with the DSC ones, evidencing in the copolymers both PBCE and PBS crystal structures with different amounts depending on composition.

Further information about the ability to crystallize of each block in the poly(ester urethane)s has been deduced by second DSC scan (after quenching from the melt, data are reported in Table S1) and by subjecting the samples to a controlled cooling rate from the melt.

The second DSC scan evidenced that all the samples cannot be obtained in a completely amorphous state by quenching (Fig. 5, dash curves). As a matter of fact, both crystalline phases are able to develop during the fast cooling in all the copolymers with the exception of A50C50. In this sample, the PBS phase crystallization is completely depressed by the quenching.

Non-isothermal experiments ratify the above mentioned findings. In the A50C50 sample, PBS crystals are not able to grow even at low cooling rates. Table 3 reports the temperature of the maximum of the crystallization peaks in non-isothermal experiments (Tc) and the corresponding enthalpy (ΔHc). In the remaining copolymers a reduction of the PBCE ability to crystallize has been observed. Two factors contribute to this behaviour: the amount of each block in the final polymer and the chemical structure of the PBS-based blocks. In particular, the higher the amount of a block, the higher its ability to crystallize. Moreover, the higher the amount of BDG sequences in the PBS-based blocks, the lower the ability to crystallize of the PBS phase, due to a hampering effect caused by the presence of the BDG comonomeric unit.

3.3. Mechanical characterization

Tensile tests have been carried out on PBCE and multiblock copolymers to analyse their mechanical behaviour. Stress–strain curves have been reported in Fig. 7 and the corresponding data (elastic modulus E, stress at yield σy, elongation at yield εy, stress at break σb, and elongation at break εb) are contained in Table 4.
image file: c6ra08882a-f7.tif
Fig. 7 Representative stress–strain curves of PBCE and multiblock copolymers.
Table 4 Mechanical characterization data of PBCE and multiblock copolymers
Polymer E (MPa) σy (MPa) εy (%) σb (MPa) εb (%)
PBCE 811 ± 39 32 ± 3 14 ± 2 27 ± 2 78 ± 11
A50B50 190 ± 11 13 ± 1 16 ± 2 13 ± 1 318 ± 33
A30B70 250 ± 33 12 ± 2 11 ± 2 14 ± 3 276 ± 24
A50C50 131 ± 5 13 ± 1 480 ± 36
A30C70 140 ± 22 8 ± 1 17 ± 3 10 ± 2 506 ± 55


As it can be observed, the presence of PBS-based blocks, deeply affects the mechanical properties of PBCE homopolymer. Generally speaking, a lowering of the elastic modulus and of the stress at yield and an increase of the elongation at break, arising from the introduction of PBS-based blocks, has been observed.

This effect strongly depends on the nature of the PBS-based block. Indeed, copolymers containing P(BS50BDG50) display a higher εb and a lower E as compared to those containing P(BS70BDG30) blocks, because of the higher crystallinity degree of this latter.

Interestingly, A50C50 does not show the yield point and behaves as an elastomeric material (Fig. 7). To investigate its resistance to loading–unloading stresses, cyclic tensile measurements have been conducted on this sample (Fig. 8). The loading–unloading path is characterized by a high elasticity, with a recovery of about 85% even after 20 cycles (Fig. 8). The difference between the first and the second cycle can be explained based on the reorientation of the macromolecules with consequent crystallization during straining.27 From the second cycle, the loading–unloading curve sticks to a fixed path, with a very small hysteresis and both the unloading curve and the residual strain are quite independent from the cycle number.


image file: c6ra08882a-f8.tif
Fig. 8 Hysteresis behaviour of A50C50 upon cyclic loading (20 cycles).

3.4. Composting

Biodegradation evaluation has been carried out through composting experiments. Mass losses as a function of the incubation time are reported in Fig. 9. No mass decrease has been observed in the time scale explored for PBCE, as also previously reported,7,28 while the multiblock copolymers underwent a significant mass decrease. In particular, among the different factors affecting polymer biodegradation, such as molecular weight, melting temperature, crystallinity and surface hydrophilicity,29–31 the last two played the major role for the polymers here studied.
image file: c6ra08882a-f9.tif
Fig. 9 Gravimetric weight loss of PBCE and multiblock copolymers as a function of the incubation time.

Indeed, A30C70 is the more hydrophilic (Table 1) and the less crystalline material (Table 2), therefore its weight loss reached about 63%.

On the other hand, A50B50 and A30B50, whose crystallinity degree and surface wettability are comparable, degraded to a similar extent (about 40% weight loss). Lastly, A50C50 lost about 50% of its initial weight after 84 days of incubation. Notwithstanding a similar crystallinity degree as compared to A50B50 and A30B50, its higher wettability caused a more pronounced degradation.

The surface morphology of the partially degraded samples has been observed by SEM (Fig. 10).


image file: c6ra08882a-f10.tif
Fig. 10 SEM micrographs of PBCE and multiblock copolymers at different incubation times.

Before composting, all the polymers display a smooth surface (results not shown). While PBCE surface remained unchanged, the copolymers films show a significant modification. In fact, cracks and holes, whose intensity increased with the incubation time, appear on the surface, clearly evidencing the proceeding of the degradation process.

As it is well known, the polymer degradation by microorganisms is a surface eroding process. The more accessible and less packed amorphous regions are preferentially degraded (at least in the first stages), giving rise to an increase of the degree of crystallinity. To highlight this effect, WAXS analyses and crystallinity degree measurements have been carried out. X-ray diffraction patterns of the polymers under study are reported in Fig. 11 as a function of the composting time.


image file: c6ra08882a-f11.tif
Fig. 11 X-ray diffraction patterns of PBCE and multiblock copolymers as a function of the composting time. Solid lines: 0 d, dash lines: 56 d, dot lines: 84 d.

It is clearly visible an increase of the degree of crystallinity, more evident for the multiblock copolymers than for PBCE. A50B50, A30B70, A50C50 and A30C70 indeed display an increase of Xc of 46%, 54%, 73% and 83%, respectively (Table S2). Such increment occurred prevalently during the first 56 days of incubation, while in the last part of the experiment only a slight change is observed. The trend perfectly matches the gravimetric measurements: the higher the weight losses, the higher the Xc increase.

3.5. Permeability evaluation

The main feature of an efficient food packaging material is the content protection. To ensure that, the mass transfer from and to the environment must be avoided. Furthermore, the design of new biodegradable materials with barrier performances comparable to those of the polymers traditionally employed for food packaging is of crucial importance.

The existence of mass transport through polymeric material, represented by the process of gas permeation, migration, and sorption (permeability behavior) is well known and it is identified as the quantification of permeates transmission, gas or vapor, through a resisting material.32,33 As a consequence, the gas transfer is normally associated with the quantitative evaluation of the barrier properties of a plastic material.

Taking into account that a polymeric film is characterized by a rate of food respiration or gas permeability which vary with the operating temperature, the barrier properties evaluation has been performed at 8 °C (fruit and vegetables average storage temperature), 15 °C (abusing temperature) and 23 °C (standard temperature).34,35 The samples performances have been studied with respect to different gases, such as O2, N2, CO2, and C2H4. The permeability of polymers to gases or water vapor is often described as GTR.16,36 GTR values (cm3 per m2 day bar), together with solubility (S, cm3per m2 bar), diffusivity (D, cm2 s−1) and time lag (tL, s), have been recorded for pure gases. Fig. 12 reports the GTR values recorded for all samples under the different temperatures considered.


image file: c6ra08882a-f12.tif
Fig. 12 GTR to CO2 (empty bars), O2 (// pattern), N2 (= pattern) and C2H4 (\\ pattern) for PBCE and multiblock copolymers at 8, 15 and 23 °C.

In Table S3 have been collected all the permeability data to CO2 and the sample thickness, while in Table S4 the perm-selectivity ratio to all the different gases at the studied temperatures are contained. It has been demonstrated that the perm-selectivity ratio is a definite value for each polymer under determinate conditions as it depends on several factors, such as chemical structure and temperature.7,14,37

As it can be observed from Fig. 12, the GTR behavior is strictly linked to the chemical structure of the polymers under evaluation. For all the samples at all the temperature studied, the CO2 is more permeable than O2 and N2, despite the larger molecular diameter. Moreover, the multiblock copolymers display a much higher permeability as compared to PBCE homopolymer, due to their higher flexibility and lower crystallinity (Table 3).

The C2H4 gas transmission rate is quite low, but higher than that of N2. Since ethylene is responsible of accelerated senescence of fruit and vegetables, the C2H4 permeation across the package is welcomed as it would improve the food shelf-life and quality.

As expected, the temperature has a significant influence on the gas transmission through the material and it strictly depends on the gas. It is well known that the mechanisms driving the adsorption/desorption permeability, solubility and diffusion phenomena are all closely dependent on the temperature.36,38

As it can be seen in Fig. 12, CO2 GTR shows a consistent increment with the temperature increase, due to the fast and chaotic motion of this gas. On the contrary, for O2, N2 and C2H4 only a moderate increase/dependence has been recorded. This result is highly interesting because a slow packaging crossing by the O2, N2 and C2H4 molecules can help avoiding a high-level of food respiration rate, film collapse and accelerate food ripening, respectively.

D, S and tL data (Table S3) have been recorded for CO2 at 23 °C and in some cases also at 8 °C and 15 °C. For the other gases and for A30B70 and A50C50 samples no data were collected, as the evaluation of the lag time (e.g. the time needed to reach the steady state), from which also D and S are derived, was not possible. In fact, tL is determined as the intersection of the straight line fitting the experimental data in a graph that plots the pressure difference between the two chambers of the testing device (dP, Y-axis) versus time (t, X-axis). Therefore, if the line fitting the experimental data does not intersect the X-axis, tL can't be determined.

The D value, linked to the kinetic parameters, increases with GTR increase, due to the gas diffusion rise throughout the polymer wall.17 The S value, which correlates to the gas solubility into the matrix, decreases as the GTR increases, because the interaction between polymer and gas is not favorable. Finally, the tL value, correlated to the time required to achieve equilibrium of the permeability processes, is in good accordance with the GTR value. As GTR increases tL decreases, meaning that less time is necessary to reach the steady-state. As it can be observed from data reported in Table S3, the lower the amount of PBCE block, the higher the solubility of CO2, as the transport of CO2 mainly occurs through the amorphous phase. Consequently, a reduction of diffusion coefficient has been evidenced, with a corresponding decrement of GTR. PBCE, due to the presence of the rigid aliphatic ring and its high crystallinity degree that cause a significant reduction of the chain mobility, displays the lower diffusion coefficient. On the contrary, PBCE solubility is quite similar to those of the multiblock copolymers, evidencing the affinity of the carbon dioxide to the polymer matrix.

Similar results have been reported in the literature for poly(ethylene oxide)-poly(butylene terephthalate) (PEO-PBT) multiblock copolymers.39 Also in the case of PEO-PBT copolymers the gas permeability results were correlated with the chemical/physical properties of the copolymers, in particular with the chain flexibility and the degree of crystallinity (i.e. the amount and length of rigid aromatic sequences).39

3.6. Activation energy of gas transport process

In order to describe the dependence of the permeation on the temperature, an Arrhenius type-equation has been employed to calculate the activation energy for gas transmission (EGTR), heat of solution (HS) and diffusion (ED) processes. The mathematical relations used are well described in the related scientific literature.40 The activation energy is deduced by calculating the value of the slope (−Ea/R) of the Arrhenius straight line, where R is the gas constant (8.314 J mol−1 K−1). Natural logarithmic (ln) of GTR, S and D compared with the reciprocal of the absolute temperature (1/T) have been reported as an example in Fig. 13 for the A50C50 sample, together with the indication of the calculated linear regression of the corrected experimental points fittings. Moreover, in Table S5 are contained the corresponding activation energies for the gas transmission rate (EGTR), the heat of solution (HS) and the diffusion (ED) process in the range of 8–23 °C for all gases, with the corresponding R2 factor (between brackets).
image file: c6ra08882a-f13.tif
Fig. 13 (A) GTR of O2, CO2, N2, C2H4 as a function of 1/T (K) for A50C50; (B) GTR, S, D of CO2 as a function of 1/T (K) for A50C50.

It can be evicted that in most cases the data well fit the theoretical relation (high R2 coefficients), indicating a good correlation between permeability and temperature for all gases. The corresponding EGTR (Table S5) is very high, especially for CO2, while is lower for O2, N2 and C2H4 gases. This behavior confirms the assumption that CO2 molecules move faster than the other gas molecules. Therefore, the permeability to CO2 is higher than to the other studied gases.

For CO2 the solubility increases by increasing the temperature. Consequently, the permeability displays the same trend. However, the linear trend has not been recorded for all the samples. This confirms the difficulty to observe a standard behavior. As the solubility is linked to the polymer chemical structure, its trend confirms that the gases interact differently with the matrix. The corresponding HS shows a fluctuant value. The same conclusion could be formulated for the ED value. High activation energy implies more sensitivity to temperature variations.41 It has been found that the permeation process is very well correlated to the temperature variation, while the sorption/diffusion process shows consistent deviation, being more dependent on polymer structure. The trend varies in fact by changing the gas and the temperature, and therefore underlines the importance of performing the barrier properties measurements at different storage conditions.

3.7. Color determination

The results of films surface color measurement are reported in Table 5 together with the determination of ΔE, C* and hab.
Table 5 L*, a*, b*, total color difference (ΔE), C* and hab of PBCE and multiblock copolymersa
Polymer L* a* b* ΔE C* hab
a hab = 0°, red-purple; hab = 90°, yellow; hab = 180°, bluish-green; hab = 270°, blue.
White standard 66.52 ± 0.08 −0.71 ± 0.01 1.16 ± 0.08 1.36 121
PBCE 63.29 ± 0.22 −1.32 ± 0.09 7.74 ± 0.54 7.35 7.85 99.68
A50B50 62.15 ± 0.32 −1.36 ± 0.07 9.95 ± 0.24 9.84 10.04 97.78
A30B70 62.53 ± 0.43 −1.42 ± 0.03 8.09 ± 0.94 8.03 8.21 99.96
A50C50 61.91 ± 0.35 −1.66 ± 0.05 9.65 ± 0.87 9.71 9.79 99.76
A30C70 61.59 ± 0.54 −1.54 ± 0.05 9.44 ± 0.76 9.67 9.56 99.27


As reported in the literature,42 in the CIELAB scale the lightness coefficient (L*) ranges from black (0) to white (100). For any value of L*, the coordinates a* and b* situate the color on a rectangular coordinate grid perpendicular to L* axis. At the origin (a* = 0 and b* = 0) the color is achromatic (gray). Moving on the horizontal axis, a positive a* value indicates a hue of red-purple, a negative a* value indicates a hue of bluish-green. Moving on the vertical axis, a positive b* value indicates a hue of yellow, a negative b* value indicates a hue of blue. a and b are coordinates that reflect indirectly chroma and hue and must be considered together as they are not independent variables.

As it can be observed from the data reported in Table 5, PBCE film shows a L* value more related to white color due to the high degree of crystallinity (lower ΔE value) with respect to the multiblock copolymers. From a* and b* values could be noted that the films showed a yellowish tendency (hab values over 90°) and a low C* value, meaning that the films display a yellow hue with low color saturation.

4. Conclusions

The chain extension technique allowed for the preparation of five high molecular weight poly(ester urethane)s. The building blocks, hydroxyl-terminated polyester prepolymers, are obtainable from renewable resources. The final materials are therefore fully bio-based, with the exception of HDI chain extender. However, its molar percentage in the final polymer is in all cases below 6%.

The results evidence that by playing with two different factors, i.e. the chemical structure and the mass ratio of each prepolymer block in the final mixture, it is possible to design a class of materials with peculiar and promising properties for food packaging.

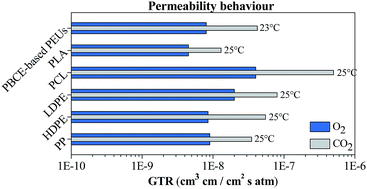
The unique combination of soft and hard segments and the introduction of different amounts of ether linkages in the polymer backbone permits to improve the mechanical behaviour and the biodegradation rate of the PBCE homopolymer, although preserving its good thermal resistance and the promising gas barrier properties. It is indeed worth underlying that the poly(ester urethane)s here presented display comparable permeability performances with respect to PP, LDPE, HDPE and PLA (and better than PCL), which are commonly employed for packaging purposes.3

References

  1. PlasticsEurope, Plastics – the Facts 2015, Brussels, Belgium, 2015, https://www.plasticseurope.org Search PubMed.
  2. K. S. Mikkonen and M. Tenkanen, Trends Food Sci. Technol., 2012, 28, 90–102 CrossRef CAS.
  3. G. Mensitieri, E. Di Maio, G. G. Buonocore, I. Nedi, M. Oliviero, L. Sansone and S. Iannace, Trends Food Sci. Technol., 2011, 22, 72–80 CrossRef CAS.
  4. I. Bechthold, K. Bretz, S. Kabasci, R. Kopitzky and A. Springer, Chem. Eng. Technol., 2008, 31, 647–654 CrossRef CAS.
  5. M. Colonna, C. Berti, M. Fiorini, E. Binassi, M. Mazzacurati, M. Vannini and S. Karanam, Green Chem., 2011, 13, 2543–2548 RSC.
  6. M. Gigli, N. Lotti, M. Gazzano, V. Siracusa, L. Finelli, A. Munari and M. Dalla Rosa, Ind. Eng. Chem. Res., 2013, 52, 12876–12886 CrossRef CAS.
  7. M. Gigli, N. Lotti, M. Gazzano, V. Siracusa, L. Finelli, A. Munari and M. Dalla Rosa, Polym. Degrad. Stab., 2014, 105, 96–106 CrossRef CAS.
  8. M. Gigli, N. Lotti, M. Gazzano, L. Finelli and A. Munari, React. Funct. Polym., 2012, 72, 303–310 CrossRef CAS.
  9. M. Fabbri, M. Gigli, R. Gamberini, N. Lotti, M. Gazzano, B. Rimini and A. Munari, Polym. Degrad. Stab., 2014, 108, 223–231 CrossRef CAS.
  10. K. W. McMillin, Meat Sci., 2008, 80, 43–65 CrossRef CAS PubMed.
  11. O. J. Caleb, U. L. Opara and C. R. Witthuhn, Food Bioprocess Technol., 2012, 5, 15–30 CrossRef CAS.
  12. J. M. Farber, J. Food Prot., 1991, 54(1), 58–70 Search PubMed.
  13. P. Rocculi, S. Romani and M. Dalla Rosa, Postharvest Biol. Technol., 2005, 35, 319–328 CrossRef CAS.
  14. L. Genovese, M. Gigli, N. Lotti, M. Gazzano, V. Siracusa, A. Munari and M. Dalla Rosa, Ind. Eng. Chem. Res., 2014, 53, 10965–10973 CrossRef CAS.
  15. S. Mangaraj, T. K. Goswami and P. V. Mahajan, Food Eng. Rev., 2009, 1, 133–158 CrossRef CAS.
  16. V. Siracusa, I. Blanco, S. Romani, U. Tylewicz, P. Rocculi and M. Dalla Rosa, J. Appl. Polym. Sci., 2012, 125, 390–401 CrossRef.
  17. V. Siracusa, I. Blanco, S. Romani, U. Tylewicz and M. Dalla Rosa, J. Food Sci., 2012, 77, 264–272 CrossRef PubMed.
  18. S. Mrkić, K. Galić, M. Ivanković, S. Hamin and N. Ciković, J. Appl. Polym. Sci., 2006, 99, 1590–1599 CrossRef.
  19. S. Galus and A. Lenart, J. Food Eng., 2013, 115, 459–465 CrossRef CAS.
  20. K. Syahidad, S. Rosnah, M. A. Noranizan, O. Zaulia and A. Anvarjon, Int. Food Res. J., 2015, 22, 753–760 Search PubMed.
  21. M. Fabbri, M. Soccio, M. Gigli, G. Guidotti, R. Gamberini, M. Gazzano, V. Siracusa, B. Rimini, N. Lotti and A. Munari, Polymer, 2016, 83, 154–161 CrossRef CAS.
  22. M. Gigli, N. Lotti, M. Vercellino, L. Visai and A. Munari, Mater. Sci. Eng., C, 2014, 34, 86–97 CrossRef CAS PubMed.
  23. M. Soccio, N. Lotti, L. Finelli, M. Gazzano and A. Munari, Eur. Polym. J., 2007, 43, 3301–3313 CrossRef CAS.
  24. M. Soccio, N. Lotti, L. Finelli and A. Munari, J. Polym. Sci., Part B: Polym. Phys., 2008, 46, 818–830 CrossRef CAS.
  25. M. Soccio, N. Lotti, L. Finelli and A. Munari, Eur. Polym. J., 2009, 45, 171–181 CrossRef CAS.
  26. M. Gigli, N. Lotti, V. Siracusa, M. Gazzano, A. Munari and M. Dalla Rosa, Eur. Polym. J., 2016, 78, 314–325 CrossRef CAS.
  27. N. Andronova and A. C. Albertsson, Biomacromolecules, 2006, 7, 1489–1495 CrossRef CAS PubMed.
  28. M. Gigli, M. Govoni, N. Lotti, E. D. Giordano, M. Gazzano and A. Munari, RSC Adv., 2104, 4, 32965–32976 RSC.
  29. M. Gigli, A. Negroni, M. Soccio, G. Zanaroli, N. Lotti, F. Fava and A. Munari, Polym. Degrad. Stab., 2013, 98, 934–942 CrossRef CAS.
  30. M. Gigli, A. Negroni, G. Zanaroli, N. Lotti, F. Fava and A. Munari, React. Funct. Polym., 2013, 73, 764–771 CrossRef CAS.
  31. M. Gigli, A. Negroni, M. Soccio, G. Zanaroli, N. Lotti, F. Fava and A. Munari, Green Chem., 2012, 14, 2885–2893 RSC.
  32. A. S. Pauly, in Polymer Handbook, ed. J. Brandrup, E. H. Immergut and E. A. Grulke, John Wiley & Sons, New York, USA, 4th edn, 1999 Search PubMed.
  33. J. Galić, K. Galić, M. Kurtanjek and N. Ciković, Polym. Test., 2000, 20, 49–57 CrossRef.
  34. S. Pao, G. E. Brown and K. R. Schneider, J. Food Sci., 1998, 63, 359–362 CrossRef CAS.
  35. I. Marklinder and M. K. Eriksson, Br. Food J., 2015, 117, 1764–1776 CrossRef.
  36. G. L. Robertson, Food Packaging: Principles and Practice, Marcel Dekker, New York, USA, 2nd edn, 2006 Search PubMed.
  37. V. Siracusa, N. Lotti, A. Munari and M. Dalla Rosa, Polym. Degrad. Stab., 2015, 119, 35–45 CrossRef CAS.
  38. D. S. Lee, K. L. Yam and L. Piergiovanni, Food packaging science and technology, Taylor & Francis Group, Abingdon, UK, 1998 Search PubMed.
  39. S. J. Metz, M. H. V. Mulder and M. Wessling, Macromolecules, 2004, 37, 4590–4597 CrossRef CAS.
  40. V. Morillon, F. Debeaufort, G. Blond and A. Voilley, J. Membr. Sci., 2000, 168, 223–231 CrossRef CAS.
  41. P. Atkins and L. Jones, Chemical principles: The Quest for Insight, Freeman WH & Co., New York, USA, 5th edn, 2012 Search PubMed.
  42. R. G. McGuire, HortScience, 1992, 27, 1254–1255 Search PubMed.

Footnote

Electronic supplementary information (ESI) available. See DOI: 10.1039/c6ra08882a

This journal is © The Royal Society of Chemistry 2016
Click here to see how this site uses Cookies. View our privacy policy here.