Nickel-oxide multiwall carbon-nanotube/reduced graphene oxide a ternary composite for enzyme-free glucose sensing

R. Prasada, V. Ganeshb and B. R. Bhat*a
aCatalysis and Materials Laboratory, Department of Chemistry, National Institute of Technology Karnataka, Srinivasnagar-575025, Surathkal, India. E-mail: ram@nitk.edu.in
bElectrodics and Electrocatalysis (EEC) Division, CSIR-Central Electrochemical Research Institute (CSIR–CECRI), Karaikudi-630003, Tamil Nadu, India

Received 5th April 2016 , Accepted 22nd June 2016

First published on 23rd June 2016


Abstract

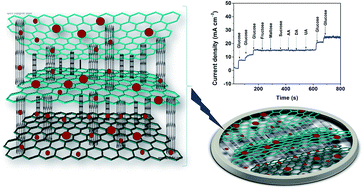
We report a solvent-free method of preparation for a NiO–carbon nanotube/graphene ternary composite using nickel formate as a green precursor via a thermal decomposition method. In this ternary composite, NiO with an average particle size of 7 nm is regularly decorated on the surfaces of conductive carbon matrix networks such as MWCNTs and reduced graphene oxide (rGO). Here rGO serves as an ideal support for the uniform distribution of NiO nanoparticles and also functions as an efficient transducer material, whereas, MWCNTs act as a spacer between rGO, which enhances the electrical conductivity and accessibility of the active reaction sites for direct glucose oxidation. The electrochemical performances were evaluated by cyclic voltammetry and amperometric techniques. Under the optimal conditions, the 20 wt% NiO–MWCNT/rGO/GCE exhibits a sensitivity of 4223.3 μA cm−2 mM−1 and a detection limit of 0.92 μM over a linear glucose concentration range up to 19 mM. Furthermore, the constructed sensor is effectively employed to detect glucose in real human blood serum samples with adequate results. The modified 20 wt% NiO–MWCNT/rGO/GCE also shows a high sensitivity, greater selectivity, excellent reproducibility and long-term stability.

1. Introduction

Over the past two decades, the development of glucose sensors with greater sensitivity, excellent selectivity, fast response time and low cost has drawn considerable attention in various areas, such as clinical diagnostics in diabetes control, environmental pollution control, food and textile industries, etc.1–3 Amperometric glucose biosensors are one such promising technology that can reach clinical glucose measurement accuracy.4 Several previous reports on this topic successfully employed the enzyme glucose oxidase (GODx), which catalyses the oxidation of glucose to gluconolactone.5 However, enzyme based biosensors suffer from several drawbacks such as poor stability, tedious enzyme immobilization procedures and higher cost etc.6,7 Therefore, there is a greater demand to develop the enzyme-free glucose sensors based on direct electro oxidation without using an enzyme or mediators. However, selecting the accurate catalyst for direct glucose oxidation is an important step in the development of enzyme-free glucose sensors. These enzyme-free glucose sensors are expected to have advantages such as easy availability, cheaper, greater stability and free from oxygen restriction.

From last two decades, tremendous amount of work was reported to improve the analytical performance of the biosensor by incorporating conducting nanomaterials as a transducer material for fast and accurate electron transfer at electrocatalyst–electrode interface.8 The carbon nanomaterial like carbon nanotubes (CNTs) and reduced graphene oxide (rGO) got significant attention in electrocatalytic applications like biosensor, supercapacitor etc.9–14 These carbon nanomaterials possess special properties like conductivity, high surface to volume ratio, chemical stability, flexibility, excellent catalytic activity, fast electron transfer etc., which make them an ideal material for the biosensor applications.15–17 Graphene, a sp2 bonded carbon with two-dimensional layer structure possessing above mentioned special properties, has gained special attention as an excellent transducer material in biosensor application.18 Furthermore, to tune and enhance these electrocatalytic properties, graphene has been modified by decorating with conducting carbon materials, metal/metal oxide nanoparticles, enzymes etc.19 However, during the electrode fabrication, because of strong π–π stacking and van der Waals interactions graphene sheets tends to agglomerate and restacks irreversibly to form graphite.20 Thus the active surface area of graphene decreases, resulting in least or no diffusion of analyte to electrode interface and it may lead to a poor catalytic performance and limiting its application.21 To overcome these limitations, the, spacers play an important role and CNTs can be employed as space impediments in separating graphene layers from restacking.22,23 On the other hand, CNTs are one-dimensional (1D) honeycomb arrangements of sp2 bonded carbon atoms, which are rolled version of graphene.24 Using these CNTs as spacers could result in enhanced electronic conductivity, surface area, mechanical stability and flexibility of graphene, thereby easy analyte diffusion to electrode interface and enhanced fast electron movement and hence improvement in the performance.25

Various metal and metal oxide nanoparticles (NPs) on graphene or multi-walled carbon nanotube (MWCNTs) surfaces have been explored for direct catalytic glucose oxidation.26–29 Among all, NiO materials, because of their excellent catalytic activity, biocompatibility, low toxicity and low cost, are highly suitable for the fabrication of nonenzymatic glucose sensors.30–33 Herein, we report facile, eco-friendly, rapid, scalable and economical route to synthesize NiO decorated graphene–MWCNTs ternary nanocomposites. These synthesized materials were used to construct the modified electrodes (NiO/rGO/MWCNT/GCE) and examined for enzyme-free glucose sensing application. The sensor properties like sensitivity, selectivity, linear regions, response time, reproducibility and interference effect were investigated and results obtained were compared with the literature articles of enzyme-free glucose sensors. Finally, the sensor was also tested for its real usage by detecting glucose concentration in real human blood serum (HBS) samples.

2. Experimental methods

2.1 Materials

Graphite flake (average particle size 20 μm), ferrocene, D-(+)-glucose, sucrose, fructose, dopamine (DA), L-ascorbic acid (AA), uric acid (UA), maltose, hydrogen peroxide (H2O2, 30% W/V) were purchased from Sigma-Aldrich India. All the chemicals are used with high purity and as received without any further purification. Material synthesis and electrochemical studies were carried out using double distilled water. The human blood was collected from the volunteers and informed written consent was obtained prior to their participation. The experimental study and study protocol was examined and permitted by the ethical committee panel at National Institute of Technology Karnataka, India.

2.2 Materials synthesis

Hummers method was employed to prepare graphene oxide using graphite flakes as the carbon precursor.34 Briefly, the flake graphite (2 g) was added portion wise slowly to salt-ice cooled concentrated H2SO4 (∼0 °C, 50 mL) and stirred for 15 minutes. This was followed by slow addition of NaNO3 (1.5 g) and continued to stir for another 15 minutes. To this mixture 10 g of KMnO4 was added in five portions followed by 400 mL of water was added and continued to stir till temperature attains room temperature. Then 20 mL of H2O2 was added drop wise to the above suspension until the grey solution immediately turns to bright yellow colour. This suspension was then filtered and washed with sufficient amount of water to remove acid impurities and the residue obtained was dried at 60 °C in a vacuum oven.

Chemical vapour deposition (CVD) method was used to prepare MWCNTs where in acetylene and ferrocene was used as a carbon source and metal catalyst respectively.35 The amorphous carbon impurity in the prepared MWCNTs was removed by subjecting to air oxidization at 350 °C for 2 h and then treated with concentrated HNO3 and H2SO4 (3[thin space (1/6-em)]:[thin space (1/6-em)]1) in order to remove any catalyst metal impurities present.36 Further the ternary composite (NiO–MWCNTs–rGO) was prepared using a facile, simple and low temperature thermal treatment technique as reported in our previous reports.30,37 The important feature of this synthetic method is, simultaneous exfoliation of GO and reduction of metal precursor.

The as-prepared MWCNTs (20 mg), GO (80 mg) and nickel formate (18.5 mg) were homogenously mixed using mortar and pestle and then ultra-sonicated for 30 minutes. The uniformly mixed powder were taken in a quartz boat and then subjected to thermal treatment at 300 °C for 2 h in a lab atmosphere condition using CVD setup. While the CVD temperature was raised from 250 °C to 300 °C, significant volume expansion was observed with the release of gaseous by-products which suggests the in situ reduction of nickel formate to nickel oxide and GO to rGO. The final products, NiO-nanoparticles (NPs) decorated MWCNTs–rGO powder sample was collected and used without purification. Similarly, different amount of nickel formate (37 mg, 55.5 mg and 74 mg) were loaded and 20, 30 and 40 wt% NiO–MWCNTs–rGO composites were synthesized. For comparison studies, the MWCNTs–rGO composite, NiO–MWCNT, NiO–rGO and pure NiO were synthesized similarly.

2.3 Material characterization techniques

Surface morphology of the synthesized products was examined by SIGMA field emission scanning electron microscope (FESEM, CARL ZEISS) and transmission electron microscope (TEM, Philips CM200). The X-ray diffraction studies were studied to know the crystallinity of the as prepared material using JEOL JDX 8P diffractometer. The morphological defects were examined by Raman analysis using LabRAM HR Raman system provided with an excitation wavelength of 514 nm. The electrocatalytic studies were carried out by using an electrochemical workstation (Autolab PGSTAT30), where in which electrochemical cell consists of three electrode setup, such as a Pt wire counter electrode, saturated calomel as reference electrode and modified glassy carbon electrode as working electrode (GCE, 3 mm diameter). All the electrochemical experiment was carried out using an alkaline 0.1 M NaOH solution as supporting electrolyte.

2.4 Electrode fabrication

The working electrode was fabricated over glassy carbon electrode (GCE, = 3.0 mm). Prior to the experimental study, the GCE was polished using different sized alumina slurry (1, 0.3 and 0.05 micron) and then rinsed with distilled water to get clean GCE. The pre-cleaned GCE electrode was modified by easy drop casting method. Firstly, 10 mg of NiO–MWCNTs–rGO composite sample in 1 mL of ethanol solution, followed by 0.2 mL of 0.5 wt% Nafion solution was added and ultra-sonicated to get homogenous suspension. This suspension (5.0 μL) was drop casted over the surface of GCE followed by air dry before use. These modified electrodes were named as 10% NiO–MWCNTs–rGO/GCE, 20% NiO–MWCNTs–rGO/GCE, 30% NiO–MWCNTs–rGO/GCE and 40% NiO–MWCNTs–rGO/GCE for 10%, 20%, 30% and 40 wt% NiO–MWCNTs–rGO composites, respectively. For comparison studies, the other modified electrodes like MWCNT/GCE and NiO/GCE were also prepared under identical conditions. Before every electrochemical experiment, the loosely bound materials on the surface of modified electrodes were thoroughly rinsed in water.

3. Results and discussion

3.1 Characterization of materials

In general, electro catalytic activity of any material to be employed as sensing matrix is depending on its surface morphology. In this work, MWCNTs, rGO and their composites with NiO are being used as electro catalyst for glucose detection. The surface morphology of the as-synthesized materials and their hybrid composites were studied using electron microscopy. An overview of FESEM images of MWCNTs, rGO, MWCNTs–rGO, NiO–MWCNTs–rGO, NiO–MWCNTs, NiO–rGO and pure NiO are shown in Fig. 1a–g. The FESEM images shows that the CNTs are tubular in nature with intertwined, twisted tubes with average diameter of 5.4 nm uniformly distributed (Fig. 1a) and the rGO synthesized appears to be, few layers, stacked and thin craggy carbon sheets (Fig. 1b). When these materials are mechanically mixed using mortar and pestle, uniform and homogenous hybrid of MWCNT–rGO was obtained which are depicted in Fig. 1c. Further the Fig. 1d–f shows the FESEM micrographs of the NiO–MWCNTs–rGO, NiO–MWCNT and NiO–rGO composites, respectively. From these figures it can be observed that the NiO particles are similar in morphology and in shape possessing an average particle size of 7.5 nm are decorated on the carbon surface, which can attribute to the thermal decomposition of nickel formate precursor. Finally, for comparison, pure NiO-NPs were prepared similarly without using rGO and MWCNTs which matches well with size and shape of the NiO-NPs decorated in the composite samples (Fig. 1g). The size of these NiO NPs distributed over carbon surface were represented in histogram and are shown in the ESI (Fig. S1). These results suggest that, nickel formate can serve as an excellent precursor to prepare pure NiO-NPs, nickel oxide decorated carbon material composites with uniform size and shape. The above results also reveal that thermal decomposition of nickel formate precursor constitutes the reproducible and stable synthetic method to prepare the NiO-NPs. Similarly, different weight percentage of composite materials were examined by FESEM and corresponding images are shown in the ESI (Fig. S2).
image file: c6ra08708f-f1.tif
Fig. 1 FESEM images of synthesized materials. (a) purified MWCNTs, (b) rGO, (c) rGO–MWCNTs hybrid (d) NiO–MWCNT–rGO composite, (e) NiO–MWCNT composite, (f) NiO–rGO composite and (g) pure NiO-NPs.

TEM analysis was used further to understand the structural morphology of different composites. Fig. 2 depicts the TEM micrographs of the prepared samples. From these figures it can be seen that the pure CNT with few walled tubes (Fig. 2a) and few layered rGO sheets (Fig. 2b) which on mechanical mixing gives homogenous hybrid of MWCNT–rGO and is shown in Fig. 2c. Moreover, MWCNT, rGO and MWCNT–rGO samples on thermal treatment with nickel formate results in respective NiO–carbon composites namely, NiO–MWCNTs (Fig. 2d), NiO–rGO (Fig. 2e) and NiO–MWCNTs–rGO respectively (Fig. 2f). Similarly, for comparison studies pure NiO synthesized by a similar method shows that the particles are granular in nature with an average particle size of ∼7 nm (Fig. 2g). Hence, from these results it is observed that the size and shape of NiO-NPs are uniformly distributed in the composite samples and this can be attributed to the stable synthetic method with the use of nickel formate as a precursor.


image file: c6ra08708f-f2.tif
Fig. 2 TEM images of synthesized materials, (a) purified MWCNT, (b) rGO, (c) rGO–MWCNT hybrid, (d) NiO–MWCNT composite, (e) NiO–rGO composite, (f) NiO–MWCNT–rGO composite and (g) pure NiO-NPs.

The samples were further investigated for crystalline nature, elemental composition and purity by using XRD analysis (Fig. 3A). In the XRD spectra, peak pattern of the prepared composites sample (NiO–MWCNTs–rGO) has been compared with peak pattern of starting materials. XRD spectra display the corresponding planes for graphite flake (curve a), GO (curve b), MWCNTs (curve c), MWCNTs–GO hybrid (curve d), MWCNTs–rGO (curve e), NiO (curve f) and NiO–MWCNTs–rGO hybrid composite (curve g) respectively. The diffraction peak observed at 26.3° in curve (a) and (c) can be indexed to graphitic carbon C(002) plane of flake graphite sheets and MWCNTs (JCPDS 008-0415).38 This graphite on conversion to GO by Hummer's method shows C(002) graphite peak has broadened and shifted to 11° (curve b). This broadening and shift in the peak pattern can be attributed to the intercalation of oxygen containing functional groups. Besides, two C(002) diffraction peaks appear at 11° and 26.3° in the XRD spectrum (curve d) corresponds to the hybrid MWCNTs–GO sample, which indicates the presence of both carbon nanostructures. These hybrid composite on thermal treatment, a distinct broad and sharp peak appears at 23° to 30°, indicates the complete transformation of GO to rGO (curve e). This sharp and broadening of peak at 26.3° depicts the presence of MWCNT as well as disorder in rGO. In addition, NiO–MWCNTs–rGO hybrid sample (curve g) shows crystalline peaks at 37.25, 43.28, 62.91, 75.40 and 79.37° (rhombohedral, JCPDS no. 00-044-1159), corresponding to (101), (012), (104), (113) and (202) rhombohedral crystal planes of NiO-NPs along with C(002) peak of MWCNT–rGO hybrid at 26.3° (curve g). Similarly, pure NiO synthesized from similar method shows the XRD pattern (curve f) that matches well with the rhombohedral crystal lattice of JCPDS no. 00-044-1159, which is same as NiO crystal planes of NiO–MWCNTs–rGO hybrid. Hence, these results indicate complete reduction of nickel formate precursor to NiO-NPs and their successful decoration over graphene and MWCNTs.


image file: c6ra08708f-f3.tif
Fig. 3 (A) XRD spectra and (B) Raman spectra of; (a) graphite flake, (b) GO, (c) MWCNTs, (d) MWCNT–GO, (e) MWCNT–rGO, (f) NiO and (g) 20% NiO–MWCNTs–rGO respectively.

Further, Raman analysis was employed to study the structural aspects of NiO–MWCNTs–rGO and the results are compared with that of the starting materials. Fig. 3B shows the typical Raman spectra of raw graphite flake (curve a), GO (curve b), MWCNTs (curve c), MWCNT–GO (curve d), MWCNT–rGO (curve e), NiO (curve f) and NiO–MWCNTs–rGO (curve g) respectively. The characteristic D and G bands that appear at around 1350 cm−1 and 1590 cm−1 are observed in all these materials except for pure NiO-NPs. The G band represents the vibration at sp2-bonded carbon atoms, whereas, D band is obtained due to the disorders or defects introduced in the smooth surfaced sp2-bonded carbon and then double resonance of these D bands leads to the formation of 2D band at ∼2700 cm−1.39,40 Further, the degree of disorder was obtained by considering the ID/IG value and the corresponding ID/IG values are tabulated in Table 1.41 Obviously, the immaculate graphite exhibits a distinct G-band at 1581 cm−1 (curve a), corresponding to the in-plane vibrations of sp2 bonded carbon atoms. After extensive oxidation, significant changes in Raman peak were observed, such as broadening and blue-shift in G band of GO appears at 1595 cm−1 and a D band appears at 1348 cm−1, which is attributed to the disordered structures of GO (curve b) with an ID/IG value of about 0.76.42,43 In case of MWCNTs (curve c) the value ID/IG is observed to be 0.65 which corresponds to the smooth surface with least structural defects. When these MWCNTs and GO are mixed together, the value of ID/IG for MWCNTs–GO hybrid has been raised to 0.75 (curve d) than the individual MWCNTs and GO, which can be attributed to the more defects introduced during mechanical mixing process. The curve e, represents the MWCNT–rGO hybrid composite with an ID/IG value 0.87. Though the conjugated sp2 carbon of rGO and MWCNTs is restored, the size of the reinstate rGO and MWCNTs is smaller than the original, resulting in the increase of ID/IG ratio.44–46 Therefore, the increase of ID/IG ratio from 0.81 to 0.87 is reasonable. The Raman spectrum of NiO–MWCNT–rGO (curve g), shows greater raise in ID/IG value to 1.5, which is due to the destructive interaction of Ni on the surface of MWCNT and GO. The curve e also consists of peaks at 747 cm−1 and 1078 cm−1 which correspond to characteristic bands of NiO (curve g).

Table 1 Raman peak positions of D, G, 2D bands and ID/IG values determined for the synthesized materials
Material D (cm−1) G (cm−1) ID/IG
Graphite 1353.9 1581 0.21
GO 1348 1595 0.76
MWCNT 1345.2 1590 0.65
MWCNT–GO 1356.5 1602.4 0.75
MWCNT–rGO 1351 1607.7 0.87
NiO–MWCNT–rGO 1342 1582 1.5
NiO


3.2 Electro-catalytic oxidation of glucose

Electrochemical activity of various electrodes fabricated in this work towards direct glucose oxidation was investigated and efforts have been made to determine the possible application in enzyme-free glucose sensing. Fig. 4 exhibits the cyclic voltammograms (CVs) of MWCNT–rGO/GCE, NiO/GCE and 20% NiO–MWCNT–rGO/GCE in the presence and absence of 2 mM glucose in phosphate buffer solution (PBS) (Fig. 4A) and 0.1 M NaOH solution (Fig. 4B) respectively. Fig. 4A shows the CVs recorded in PBS solution (pH = 7), where no redox peaks appear for the above mentioned electrodes in both the presence and absence of glucose (curves a–f). However, the current recorded for 20% NiO–MWCNT–rGO/GCE is much higher than the NiO/GCE and MWCNT–rGO/GCE which may be due to the synergistic effect of NiO, MWCNT and rGO. In contrast CVs recorded for these electrodes in 0.1 M NaOH solution display a distinct behaviour, in case of MWCNT–rGO/GCE (Fig. 4B, curve g and h) shows no redox peak in presence and absence of 2 mM glucose. However, well-defined redox peaks appeared for NiO/GCE and NiO–MWCNT–rGO/GCE (Fig. 4B curve i and k), which may be due to glucose is directly oxidized to gluconic acid by using the redox couple of Ni that is Ni3+/Ni2+ on the modified electrode surface in basic medium. Upon addition of 2 mM glucose, the MWCNT–rGO/GCE (curve h) electrode shows no much change in current density. However, NiO–MWCNT–rGO/GCE (curve l) and NiO/GCE (curve j) record significant enhancement in current density which signify that NiO can potentially electro-catalyse the glucose oxidation. Interestingly, redox peaks associated with NiO–MWCNT–rGO/GCE (curve l) has negatively shifted to 0.55 V and 0.25 V for anodic and cathodic peak respectively and the electrode current recorded is 2.5 times greater than the NiO/GCE. This shift in redox peak potential and increased current may be due to the use of MWCNTs in the NiO–rGO composite, where MWCNTs acts like spacers between rGO layers can effectively enhance the surface area of the composite and results in more rapid glucose transmission at an electrode surface improving the electrochemical responses.
image file: c6ra08708f-f4.tif
Fig. 4 (A) CVs obtained in the presence and absence of 2 mM glucose at MWCNT–rGO/GCE (curve a and b), NiO/GCE (curve c and d) and NiO–MWCNT–rGO/GCE (curve e and f) electrodes in PBS solution and (B) CVs recorded in the presence and absence of 2 mM glucose at MWCNT–rGO/GCE (curve g and h), NiO/GCE (curve i and j) and 20% NiO–MWCNT–rGO/GCE (curve k and l) electrodes in 0.1 M NaOH aqueous solution.

The plausible mechanism for direct glucose oxidation on modified NiO based enzyme-free electrode is as follows.30,47

 
rGO/MWCNT–NiO + OH → rGO/MWCNT–Ni(OH)2 (1)
 
rGO/MWCNT–Ni(OH)2 + OH ⇌ rGO/MWCNT–NiO(OH) + H2O + e (2)
 
rGO/MWCNT–NiO(OH) + glucose → rGO/MWCNT–Ni(OH)2 + gluconic acid (3)

According to the depicted mechanism, first Ni2+ is electro-oxidized to Ni3+ in an alkaline 0.1 M NaOH solution and an electron will be released which results in oxidation peak current. Followed by two simultaneous reactions that takes place at a time; that is reduction of Ni3+ to Ni2+ and oxidation of glucose to gluconic acid which results in anodic peak current. Thus, glucose gets oxidized and also reforms the Ni2+ leads to rise in current at the electrode surface.

The weight ratio of Ni formate precursor loaded during the preparation of composites was optimized towards glucose oxidation. The modified electrodes were fabricated using samples with different wt% of Ni formate loaded namely, 10% NiO–MWCNTs–rGO/GCE, 20% NiO–MWCNTs–rGOE/GCE, 30% NiO–MWCNTs–rGO/GCE and 40% NiO–MWCNTs–rGO/GCE for 10, 20, 30, 40 wt% NiO–MWCNTs–rGO samples, respectively (Fig. 5A, column a–d). Among these 20% NiO–MWCNTs–rGO/GCE (column a) negative shifted with highest current recorded compared with the 30 and 40% NiO–MWCNTs–rGO/GCE (column c and d) which may due to the higher surface area offered by the MWCNT spacers between rGO sheets. Even though the 10% NiO–MWCNTs–rGO/GCE (column b) display the glucose oxidation peak at much lower potential than the 20% NiO–MWCNTs–rGO/GCE, but the electrode current recorded for 10% electrode is less than half in comparison to 20% electrode. The raise in electrode current may be due to the higher NiO-NPs on the surface of the MWCNT–rGO samples. Hence the 20% NiO–MWCNTs–rGO samples was considered as the best optimised ratio for the maximum electrocatalytic oxidation of glucose. These results correlate very well with our earlier observations.


image file: c6ra08708f-f5.tif
Fig. 5 (A) Current vs. potential plots recorded for 10% NiO–MWCNT/GCE (column a), 20% NiO–MWCNT/GCE (column b), 30% NiO–MWCNT/GCE (column c) and 40% NiO–MWCNT/GCE (column d) using 2 mM glucose and (B) CVs of 20% NiO–MWCNT/GCE at different concentrations of NaOH solution.

Further, the 20% NiO–MWCNTs–rGO/GCE was investigated for the optimised NaOH concentration ranging from 0.05 M NaOH to 0.2 M NaOH solution and the results are shown in Fig. 5B. CV results displayed in Fig. 5B depict that, at 0.1 M NaOH solution (curve ii), well-defined redox peaks with significant raise in anodic peak current (EPa) and slight shift in the peak potential were recorded in comparison with 0.05 M (curve i), 0.15 M (curve iii) and 0.2 M NaOH solutions (curve iv). These results indicate that the hydroxyl ions (OH) are directly involved in electro-chemical oxidation process and may also block the electro-adsorption of glucose with raise in OH concentration which may retard the glucose oxidation process leading to the fouling of electrodes. From these results, 0.1 M NaOH aqueous solution was considered as the best optimised concentration for further electrochemical studies.

The scan rate effect was studied on 20% NiO–MWCNTs–rGO/GCE to investigate the reaction kinetics of glucose in 0.1 M NaOH solution with 2.0 mM glucose concentration. As the scan rate was increased from 50 mV s−1 to 600 mV s−1 (Fig. 6A), the redox peak current increases with slight shift in anodic and cathodic peak potentials toward the positive and negative sides respectively and thus leading to the substantial peak-to-peak separation. Further, Fig. 6B depicts the determined redox peak currents (IP) were linearly correlated to the square root of scan rate (ν1/2), with linear regression value (R2) of 0.9717 and 0.9819 for anodic and cathodic peak potentials respectively. This result indicates that the electro-chemical process is a typical diffusion-controlled process on the surface of 20% NiO–MWCNTs–rGO/GCE which is an ideal platform for enzyme-free glucose detection.48


image file: c6ra08708f-f6.tif
Fig. 6 (A) CVs recorded at different scan rate values (50 mV s−1 to 600 mV s−1) for 20% NiO–MWCNTs/GCE with 2.0 mM glucose in 0.1 M NaOH solution and (B) variation of anodic and cathodic peak current values with square root of scan rate.

3.3 Amperometric detection of glucose

In general, for any electrochemical sensor, the amperometric response is generally evaluated by measuring current at fixed working potentials in the presence of a specific analyte of interest. Hence, it is obvious to choose the optimised working potential for the enzyme-free electrochemical sensing of glucose. Fig. 7A shows the typical current–time (it) plots obtained from the amperometric response at 20% NiO–MWCNT–rGO/GCE with consecutive glucose addition (0.2 mM) under different working potentials such as 0.4 V, 0.45 V, 0.5 V, 0.55 V and 0.6 V (curve a–e). From the figure it is observed that, appreciable increase in electrode current density was observed with the raise in applied potential until the potential reached +0.55 V. However, electrode current at 0.6 V start declining, which may be due to the potentially interfering species which are stable only under low potential can generate many intermediate species that would probably obstruct the glucose oxidation. In addition, highest electrode current recorded at 0.55 V matches well with the anodic oxidation peak potential (Fig. 4B, curve l) obtained from CV measurement. Thus, 0.55 V was chosen as the optimum working potential in the following experiments.
image file: c6ra08708f-f7.tif
Fig. 7 (A) Amperometric current responses of 20% NiO–MWCNT/GCE at various working potentials with every successive addition of 0.2 mM glucose, (B) plot of current–time recoded for different modified electrodes fabricated at 0.55 V, (C) plot of response time and (D) electrode current density measured at 0.55 vs. glucose concentration using different modified electrodes.

The Fig. 7B shows an amperometric response recorded for 20% NiO–MWCNT–rGO/GCE in comparison with other modified electrodes like NiO/GCE, 10%, 30% and 40% NiO–MWCNT–rGO/GCE with consecutive glucose addition (0.5 mM) under optimal conditions such as 0.55 V as working potential in 0.1 M NaOH solution. Upon each addition of glucose, a step-like increase in response correct appears while the solution was being constantly stirred. The steady-state current signal was achieved for 20% NiO–MWCNT–rGO/GCE within 3 s (Fig. 7C), suggesting a faster response time of the electrode. The result shows that the current recorded at 20% NiO–MWCNT–rGO/GCE is 5.2, 1.5, 4.6 and 6 times greater than the NiO/GCE, 10%, 30% and 40% NiO–MWCNT–rGO/GCE, respectively. The highest current recorded for the 20% NiO–MWCNT–rGO/GCE which can be attributed to the uniformly decorated NiO-NPs on the surface of MWCNT and rGO with least agglomerated particles. It is observed that with the raise in Ni formate precursor loaded during synthesis, results in more agglomerated and dense NiO particles decorated composites. Thus 30 and 40% composites records lesser electrode current due to the suppressed electrochemical activity and slower electron movement of dense agglomerated NiO particle in the 30 and 40% NiO–MWCNT–rGO composite modified electrodes. However, when precursor load is 10%, the electrode current recorded is lesser than 20%, which may be due to lesser active NiO available on the surface of the electrode.

Fig. 7D, displays the linear calibration curve over a glucose concentration ranging upto 16 mM, 19 mM and 7.5 mM for 10, 20 and 30% NiO–MWCNT–rGO/GCE, respectively (curve a, b, c). The sensitivity for these modified electrodes were calculated to be 3126.5 μA cm−2 mM−1, 4223.3 μA cm−2 mM−1 and 1341.5 μA cm−2 mM−1 with a limit of detection (LOD) of 2.37 μM, 0.92 μM and 1.41 μM for 10, 20 and 30% NiO–MWCNT–rGO/GCE, respectively. The corresponding regression value (R2) for these linear curves are measured to be 0.9956, 0.9788 and 0.9854, respectively. Thus, the obtained results like sensitivity, detection limit and linear range of the proposed sensor were compared with the nickel based enzyme-free glucose sensors that had been reported recently are summarized in Table 2. From the Table 2, the proposed 20% NiO–MWCNT–rGO/GCE shows relatively fast response time with less than 3 s, low detection limit and wide linear concentration range. These results indicated that the 20% NiO–MWCNT–rGO/GCE exhibited excellent electro-catalytic activity toward glucose oxidation which can be attributed to the synergistic effect of MWCNT, NiO-NPs and rGO. The electrical network formed through NiO-NPs on the surface of rGO sheets separated by the MWCNT spacers, will offer the intrinsic conductivity as well as promotes easy access to direct glucose oxidation.

Table 2 Performance comparison of different enzyme-free glucose sensors reported in literature with our proposed sensor
Electrode Linear range (upto mM) Detection limit (μM) Sensitivity (μA mM−1 cm−2)
Nickel electrode49 02.5 40
Ni powder modified electrode50 05.0 0.2 40
NiO/MWCNTs electrode51 07.0 2 1768.8
Ni–MWNTs2 17.5 0.89 67.19
Ni–Cu/TiO2/Ti52 3.20 5 1591
NA/NiONF–rGO/GCE53 0.60 0.8 1100
NiO/Pt/ERGO/GCE54 05.6 0.2 668.2
10% NiO–MWCNT–rGO/GCE 16.0 2.37 3126.5
20% NiO–MWCNT–rGO/GCE 19.0 0.92 4223.3
30% NiO–MWCNT–rGO/GCE 07.5 1.41 1341.5


3.4 Selectivity of 20% NiO–MWCNT–rGO/GCE electrode

Selectivity is one of the significant parameter, which plays an important role in biological sensing applications. The potentially interfering species such as fructose, maltose, sucrose, ascorbic acid (AA), dopamine (DA) and uric acid (UA) usually co-exist with glucose in real sample.55 Therefore, the electrochemical responses of the interfering species were examined for 20% NiO–MWCNT–rGO/GCE at a working potential of 0.55 V in 0.1 M NaOH solution as shown in Fig. 8. From Fig. 8 it is observed that the significant raise in electrode current density was recorded by the addition of 2 mM glucose. However, on contrary, very negligible or no obvious current response was recorded with the addition of 2 mM of each interfering species. These factors suggest that 20% NiO–MWCNT–rGO/GCE possess excellent anti-interference properties towards many biological interference samples.
image file: c6ra08708f-f8.tif
Fig. 8 Interference test of 20% NiO–MWCNT–rGO/GCE in 0.1 M NaOH at +0.55 V with the addition of 2 mM glucose and other potential interferents as indicated.

3.5 Reproducibility and stability of 20% NiO–MWCNT/GCE

Long term stability is one of the significant factors to examine the performance of sensor. The proposed enzyme-free glucose sensor was investigated for the current response at a fixed concentration of 2.0 mM glucose and the current was measured at every 5 day intervals for 40 days period at 0.55 V applied potential in 0.1 M NaOH solution (Fig. 9A). After 40 days, the sensor displayed minimal current change and it showed 85% of its initial current response suggesting the excellent stability for 20% NiO–MWCNT–rGO/GCE. Further, the reproducibility of electrode response was also investigated by recording the glucose oxidation current response at ten identically constructed electrodes under similar conditions (Fig. 9B). The current response shows relative standard deviation (RSD) values less than 5%, suggesting a greater reproducibility of the electrode. This excellent long-term storage stability and reproducibility can be attributed to the physical as well as chemical stability of NiO-nanoparticles over the rGO and MWCNTs composite surface.
image file: c6ra08708f-f9.tif
Fig. 9 (A) Stability of 20% NiO–MWCNT–rGO/GCE stored at ambient conditions over 40 days at +0.55 V using 2.0 mM glucose in 0.1 M NaOH and (B) stability study using current–time response for ten identical 20% NiO–MWCNT/GCE.

3.6 Real samples analysis using 20% NiO–MWCNT/GCE

Finally, for practical application, glucose concentration was examined in the real human blood serum samples (HBS), using 20% NiO–MWCNT–rGO/GCE. To an alkaline NaOH solution (0.1 M, 10 mL), HBS was injected and allowed for dispersing uniformly and the current was measured at a working potential of +0.55 V. The electrode current response was correlated with the calibration curve of standard glucose concentration (Fig. 7D, curve a) and amount of glucose was measured. Further, the values obtained for fabricated electrode were compared with that of commercial glucose meter results (Accu-Chek® Active Blood Glucose Meter) and the measured values are tabulated in Table 3. The comparison result demonstrates that >94% samples recovery with less than 6% of relative standard deviation (RSD). Thus, above results show that, the 20% NiO–MWCNT–rGO/GCE could be a promising material to fabricate the enzyme-free glucose sensor.
Table 3 The comparison results of glucose detection by 20% NiO–MWCNT–rGO/GCE and the commercial glucose meter using human blood serum samples
Case Glucose (mM) (20% NiO–MWCNT–rGO/GCE) RSDa (N = 4) Glucose (mM) (commercial glucose sensor)
a Average of four trails.
1 4.3 5.8% 4.5
2 6.5 4.5% 6.9
3 5.75 2.8% 5.7
4 4.59 3.5% 4.8
5 5.1 4.0% 5.2


In general, NiO–MWCNT–rGO/GCE ternary composite modified electrode for glucose sensing functions as follows. NiO-NPs serves as active reaction sites for direct glucose oxidation, whereas, the rGO provides the ideal support for uniform distribution of NiO-NPs, which also functions as an efficient transducer material. Similarly, MWCNTs in the composites helps to form an intertwined rGO–MWCNT network, where MWCNTs serve as spacers between rGO sheets and enhancing the accessibility of active reaction sites. Hence, the synergistic effect between different functional components which offers the excellent platform for direct glucose oxidation and also amplify the electrocatalytic performance of the proposed sensor.

4. Conclusions

NiO–MWCNT–rGO ternary composites are synthesized using nickel formate precursor by solvent free method and used in fabrication of modified GC electrode for enzyme-free glucose sensing. Among all the fabricated electrodes, the 20% NiO–MWCNT–rGO/GCE on electrochemical investigation exhibited excellent catalytic activity towards direct glucose oxidation with an extremely high sensitivity, a low detection limit and a wide detection range of glucose detection. These results may, mainly due to exceptional fast electron movement, abundant catalyst particles on the surface of rGO, MWCNT. The fabricated sensor also shows the greater reproducibility, long-term stability and can be used to detect glucose in real samples with agreeable results. Therefore, 20% NiO–MWCNT–rGO/GCE enzyme-free glucose sensor prepared in this work serves as a promising and potential enzyme-free sensor for glucose detection in clinical diagnosis.

Acknowledgements

The authors are grateful to NITK, Surathkal, India for research fellowship.

References

  1. J. Luo, S. Jiang, H. Zhang, J. Jiang and X. Liu, Anal. Chim. Acta, 2012, 709, 47–53 CrossRef CAS PubMed.
  2. A. Sun, J. Zheng and Q. Sheng, Electrochim. Acta, 2012, 65, 64–69 CrossRef CAS.
  3. G. Wang, X. Lu, T. Zhai, Y. Ling, H. Wang, Y. Tong and Y. Li, Nanoscale, 2012, 4, 3123–3127 RSC.
  4. Y. Lin, F. Lu, Y. Tu and Z. Ren, Nano Lett., 2004, 4, 191–195 CrossRef CAS.
  5. S. B. Bankar, M. V. Bule, R. S. Singhal and L. Ananthanarayan, Biotechnol. Adv., 2009, 27, 489–501 CrossRef CAS PubMed.
  6. T. R. Kumar, K. J. Babu, D. J. Yoo, A. R. Kim and G. G. Kumar, RSC Adv., 2015, 5, 41457–41467 RSC.
  7. M. Ranjani, Y. Sathishkumar, Y. S. Lee, D. J. Yoo, A. R. Kim and G. G. Kumar, RSC Adv., 2015, 5, 57804–57814 RSC.
  8. Z. Zhu, L. Garcia-Gancedo, A. J. Flewitt, H. Xie, F. Moussy and W. I. Milne, Sensors, 2012, 12, 5996–6022 CrossRef PubMed.
  9. Y. Cao, H. Yu, F. Peng and H. Wang, ACS Catal., 2014, 4, 1617–1625 CrossRef CAS.
  10. Y. Cao, H. Yu, J. Tan, F. Peng, H. Wang, J. Li, W. Zheng and N.-B. Wong, Carbon, 2013, 57, 433–442 CrossRef CAS.
  11. Y. Cao, X. Luo, H. Yu, F. Peng, H. Wang and G. Ning, Catal. Sci. Technol., 2013, 3, 2654–2660 Search PubMed.
  12. K. Ariga, K. Minami and L. K. Shrestha, Analyst, 2016, 141, 2629–2638 RSC.
  13. G. Zhu, Y. Yi, Z. Han, K. Wang and X. Wu, Anal. Chim. Acta, 2014, 845, 30–37 CrossRef CAS PubMed.
  14. G. Zhu, Y. Yi and J. Chen, TrAC, Trends Anal. Chem., 2016, 80, 232–241 CrossRef CAS.
  15. C. Shan, H. Yang, J. Song, D. Han, A. Ivaska and L. Niu, Anal. Chem., 2009, 81, 2378–2382 CrossRef CAS PubMed.
  16. B. Unnikrishnan, S. Palanisamy and S.-M. Chen, Biosens. Bioelectron., 2013, 39, 70–75 CrossRef CAS PubMed.
  17. M. Wilson, Phys. Today, 2006, 59, 21–23 Search PubMed.
  18. M. J. Allen, V. C. Tung and R. B. Kaner, Chem. Rev., 2010, 110, 132–145 CrossRef CAS PubMed.
  19. P. Nayak, P. N. Santhosh and S. Ramaprabhu, RSC Adv., 2014, 4, 41670–41677 RSC.
  20. D. Li, M. B. Müller, S. Gilje, R. B. Kaner and G. G. Wallace, Nat. Nanotechnol., 2008, 3, 101–105 CrossRef CAS PubMed.
  21. R. Chen, Q. Zhang, Y. Gu, L. Tang, C. Li and Z. Zhang, Anal. Chim. Acta, 2015, 853, 579–587 CrossRef CAS PubMed.
  22. Q. Cheng, J. Tang, J. Ma, H. Zhang, N. Shinya and L.-C. Qin, Phys. Chem. Chem. Phys., 2011, 13, 17615–17624 RSC.
  23. R. B. Rakhi and H. N. Alshareef, J. Power Sources, 2011, 196, 8858–8865 CrossRef CAS.
  24. M. Ouyang, J.-L. Huang and C. M. Lieber, Acc. Chem. Res., 2002, 35, 1018–1025 CrossRef CAS PubMed.
  25. X. Wang, J. Wang, H. Cheng, P. Yu, J. Ye and L. Mao, Langmuir, 2011, 27, 11180–11186 CrossRef CAS PubMed.
  26. M. M. Rahman, A. J. S. Ahammad, J.-H. Jin, S. J. Ahn and J.-J. Lee, Sensors, 2010, 10, 4855–4886 CrossRef CAS PubMed.
  27. Y. Wang, J. Clancey, G. Lu, J. Liu, L. Liu, J. Chaudhuri, S. George, M. Xie, S. Wei and Z. Guo, J. Electrochem. Soc., 2016, 163, F1–F10 CrossRef CAS.
  28. Y. Wang, Q. He, K. Ding, H. Wei, J. Guo, Q. Wang, R. O'Connor, X. Huang, Z. Luo, T. D. Shen, S. Wei and Z. Guo, J. Electrochem. Soc., 2015, 162, F755–F763 CrossRef CAS.
  29. H. Gu, S. B. Rapole, Y. Huang, D. Cao, Z. Luo, S. Wei and Z. Guo, J. Mater. Chem. A, 2013, 1, 2011–2021 RSC.
  30. R. Prasad, N. Gorjizadeh, R. Rajarao, V. Sahajwalla and B. R. Bhat, RSC Adv., 2015, 5, 44792–44799 RSC.
  31. V. Veeramani, R. Madhu, S.-M. Chen, P. Veerakumar, C.-T. Hung and S.-B. Liu, Sens. Actuators, B, 2015, 221, 1384–1390 CrossRef CAS.
  32. R. Rajendran, L. K. Shrestha, R. M. Kumar, R. Jayavel, J. P. Hill and K. Ariga, J. Inorg. Organomet. Polym. Mater., 2014, 25, 267–274 CrossRef.
  33. R. Rajendran, L. K. Shrestha, K. Minami, M. Subramanian, R. Jayavel and K. Ariga, J. Mater. Chem. A, 2014, 2, 18480–18487 RSC.
  34. W. S. Hummers and R. E. Offeman, J. Am. Chem. Soc., 1958, 80, 1339 CrossRef CAS.
  35. S. Musso, G. Fanchini and A. Tagliaferro, Diamond Relat. Mater., 2005, 14, 784–789 CrossRef CAS.
  36. R. Rajarao and B. R. Bhat, Synth. React. Inorg., Met.-Org., Nano-Met. Chem., 2013, 43, 1418–1422 CrossRef CAS.
  37. R. Prasad and B. R. Bhat, Sens. Actuators, B, 2015, 220, 81–90 CrossRef CAS.
  38. S. Li, Z. Zhao, Y. Huang, J. Di, Y. (Alec) Jia and H. Zheng, J. Mater. Chem. A, 2015, 3, 5467–5473 RSC.
  39. L. Shahriary, R. Nair, S. Sabharwal and A. A. Athawale, New J. Chem., 2015, 39, 4583–4590 RSC.
  40. A. P. Singh, M. Mishra, D. P. Hashim, T. N. Narayanan, M. G. Hahm, P. Kumar, J. Dwivedi, G. Kedawat, A. Gupta, B. P. Singh, A. Chandra, R. Vajtai, S. K. Dhawan, P. M. Ajayan and B. K. Gupta, Carbon, 2015, 85, 79–88 CrossRef CAS.
  41. R. Saito, M. Hofmann, G. Dresselhaus, A. Jorio and M. S. Dresselhaus, Adv. Phys., 2011, 60, 413–550 CrossRef CAS.
  42. X. Dong, Y. Ma, G. Zhu, Y. Huang, J. Wang, M. B. Chan-Park, L. Wang, W. Huang and P. Chen, J. Mater. Chem., 2012, 22, 17044–17048 RSC.
  43. X. Dong, B. Li, A. Wei, X. Cao, M. B. Chan-Park, H. Zhang, L.-J. Li, W. Huang and P. Chen, Carbon, 2011, 49, 2944–2949 CrossRef CAS.
  44. Y. Bai, M. Du, J. Chang, J. Sun and L. Gao, J. Mater. Chem. A, 2014, 2, 3834–3840 RSC.
  45. A. A. K. King, B. R. Davies, N. Noorbehesht, P. Newman, T. L. Church, A. T. Harris, J. M. Razal and A. I. Minett, Sci. Rep., 2016, 6, 19491 CrossRef CAS PubMed.
  46. S. Hun, in Physics and Applications of Graphene - Experiments, ed. S. Mikhailov, InTech, 2011 Search PubMed.
  47. P. Lu, Q. Liu, Y. Xiong, Q. Wang, Y. Lei, S. Lu, L. Lu and L. Yao, Electrochim. Acta, 2015, 168, 148–156 CrossRef CAS.
  48. J. Yang, M. Cho, C. Pang and Y. Lee, Sens. Actuators, B, 2015, 211, 93–101 CrossRef CAS.
  49. C. Zhao, C. Shao, M. Li and K. Jiao, Talanta, 2007, 71, 1769–1773 CrossRef CAS PubMed.
  50. T. You, O. Niwa, Z. Chen, K. Hayashi, M. Tomita and S. Hirono, Anal. Chem., 2003, 75, 5191–5196 CrossRef CAS PubMed.
  51. W. Zhang, S. Peigen, X. Haifeng and D. Qian, in 2010 2nd International Conference on Advanced Computer Control (ICACC), 2010, vol. 2, pp. 259–263 Search PubMed.
  52. X. Li, J. Yao, F. Liu, H. He, M. Zhou, N. Mao, P. Xiao and Y. Zhang, Sens. Actuators, B, 2013, 181, 501–508 CrossRef CAS.
  53. Y. Zhang, Y. Wang, J. Jia and J. Wang, Sens. Actuators, B, 2012, 171–172, 580–587 CrossRef CAS.
  54. M. Li, X. Bo, Z. Mu, Y. Zhang and L. Guo, Sens. Actuators, B, 2014, 192, 261–268 CrossRef CAS.
  55. R. Ahmad, N. Tripathy, Y.-B. Hahn, A. Umar, A. A. Ibrahim and S. H. Kim, Dalton Trans., 2015, 44, 12488–12492 RSC.

Footnote

Electronic supplementary information (ESI) available. See DOI: 10.1039/c6ra08708f

This journal is © The Royal Society of Chemistry 2016
Click here to see how this site uses Cookies. View our privacy policy here.