Screening and isolation of natural antioxidants from Ziziphora clinopodioides Lam. with high performance liquid chromatography coupled to a post-column Ce(IV) reduction capacity assay

Qingyan Mengab, Guozhu Lib, Bi Luob, Lijun Wangb, Yaling Lub and Wenjie Liu*ab
aKey Laboratory of Biological Resource Protection and Utilization of Tarim Basin, Xinjiang Production & Construction Group, Alar, Xinjiang 843300, China. E-mail: lury@sina.com
bCollege of Life Science, Tarim University, Alar, Xinjiang 843300, China

Received 4th April 2016 , Accepted 18th June 2016

First published on 21st June 2016


Abstract

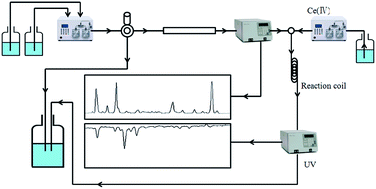
A novel on-line screening method for natural antioxidants was developed with a post-column cerium(IV) reduction reaction after high performance liquid chromatography (HPLC) separation. Under acidic conditions, Ce(IV) sulphate exhibits strong absorption at 320 nm and is reduced to Ce(III) by antioxidants in a post-column reaction coil (no absorbance at this wavelength). The reduction of absorbance at 320 nm affords a negative peak that corresponds to the retention time of an active constituent in the HPLC chromatogram. The proposed method demonstrated different selectivity versus a conventional HPLC-2,2-diphenyl-1-picrylhydrazyl (DPPH) method. This was used to detect the antioxidant constituents from the extract of Ziziphora clinopodioides Lam., which is an indigenous edible plant from north Xinjiang, China. Nine compounds were isolated as major antioxidant compounds by this method. All the isolated compounds were identified by 1H NMR and 13C NMR; six of them were isolated from this plant for the first time.

1. Introduction

Reactive oxygen species (ROS) are a group of highly reactive molecules and free radicals containing oxygen such as oxygen ions, peroxides and hydroxyl radicals. ROS-related oxidations can cause damage to cell metabolism such as DNA damage and lipid oxidation, which can lead to cardiovascular diseases, diabetes mellitus, arteriosclerosis and aging-related diseases.1–5 Excessive ROS can damage cellular proteins and DNA, and thus lead to carcinogenesis. ROS, especially oxygen containing free radicals, also causes food degradation and spoilage, which results in off-flavours, produces harmful substances and reduces the shelf life of food. There are many research efforts to understand the harmfulness of ROS and develop efficient antioxidants to prevent ROS damage.

Antioxidants can decrease the potential impact of free radicals on human cells while delaying and preventing oxidative degradation of foods. However, chemically synthesized antioxidants such as butylated hydroxytoluene (BHT) and 3-t-butyl-4-hydroxyanisole (BHA) are suspects in allergic, asthma and behavioural issues in children.6,7 Though there was no strong evidence of carcinogenicity caused by BHT and BHA with daily intake levels, consumers prefer natural antioxidants from plant extracts such as polyphenols, flavonoids, vitamin C, anthocyanin and other natural organic compounds as food antioxidants and food dietary supplements.

There are three conventional methods to evaluate antioxidant activities: lipid peroxidation, free radical scavenging and reducing capacity. However, those activity assays can only tell the total antioxidant capacity of plant extracts but cannot give the individual constituents of interest from the complex components. High performance liquid chromatography (HPLC) coupled to post-column free radical scavenger detection methods can screen antioxidative constituents from complex natural products. HPLC combines separation and activity evaluation. This is a major advantage for activity-guided fractionation and successive isolation to avoid contamination and decomposition of labile compounds. The results of HPLC separation and post-column free radical scavenger detection directly identifies antioxidative compounds in complex samples.8,9 Various screening approaches have been proposed using HPLC coupled to post-column free radical scavenger detection.10,11

Keleva used HPLC coupled to post-column 1,1-diphenyl-2-picrylhydrazyl radical (DPPH) and 2,2′-azino-bis(3-ethylbenzothiazoline-6-sulphonic acid) (ABTS) scavenger detection for the screening of antioxidants from natural product mixtures.12 A variety of natural antioxidants were sensitively detected from apple,13 Acacia confuse extracts,9 and evaluated for the antioxidative activities. A novel screening system combining HPLC with luminol-based chemiluminescence (CL) detection was applied to measure catechin and flavone in tea while eliminating superoxide anion radical (O2) and hydrogen peroxide (H2O2).14 A similar method was also applied to screen free radical scavenging constituents from thyme and sage samples.10 HPLC coupled with a cupric reducing antioxidant capacity (CUPRAC) assay identified polyphenols (flavonoids, simple phenolic and hydroxycinnamic acids) in plant matrices including antioxidative compounds in crude extracts of Camellia sinensis, Origanum marjorana and Mentha.15

Nevertheless, the proposed methods suffer from baseline drift, labile nature of derivative reagents, or missing of active compounds because of low reaction rates.16 Thus, it is still necessary to develop novel screening methods to determine the antioxidative constituents from complex mixtures. A Ce(IV)-based reducing capacity (CERAC) assay was applied to measure the total antioxidant capacity (TAC) of foods because Ce(IV) only oxidizes antioxidative compounds but not citric acid and reducing sugars.17 The electron-transfer reaction between Ce(IV) ion and antioxidants can be monitored with Ce(III) fluorescence at 360 nm or UV absorbance of Ce(IV) at 320 nm.17–20

Ziziphora clinopodioides Lam. is a traditional Chinese medicinal plant grown in north Xinjiang, China and has been used as herbal tea, food flavour and herbal medicine to treat hypertension and ischemia myocardial, stimulate appetite and help assimilation, and promote wound healing by indigenous Uygur people in Xinjiang. However, its antioxidative constituents have not yet been discovered. The main objectives of the present study were to develop a rapid, robust and sensitive method for on-line detection of natural antioxidants from plant extracts using HPLC coupled to post-column CERAC assay and to identify the antioxidative compounds from Z. clinopodioides Lam.

2. Results and discussion

2.1 Optimization of the reduction reaction conditions of cerium sulphate

Parameters that influence the sensitivity of cerium(IV) sulphate include acidic media, pH, concentration of Ce(IV), reaction time, reaction temperature and the percentages of methanol and acetonitrile. These were evaluated to optimize the sensitivity of the screening assay. All factors were determined under off-line conditions using chlorogenic acid as the antioxidant. Unless stated otherwise, the concentration of cerium(IV) sulphate was 2 × 10⁻³ mol L−1, and chlorogenic acid was 1.0 × 10⁻⁴ mol L−1. For the reaction, 2.5 mL solution including 200 μL Ce(SO4)2, 800 μL chlorogenic acid and 1500 μL solvent were vortexed for 5 seconds and the absorbance at 320 nm (A320) was recorded every 10 s for 180 seconds. All tests were performed in triplicate, and the results were expressed with error bars in all figures.
2.1.1 Influence of the acidic reagent and pH. The stability and oxidization capacity of the Ce(SO4)2 solution are influenced by different acidic reagents and pH. To optimize the screening sensitivity with various acids at different pH, five milligrams of Ce(SO4)2 were respectively dissolved in 50 mL of 0.01, 0.05, 0.1, 0.2, 0.3, 0.4, and 0.5 mol L−1 of hydrochloric acid, sulfuric acid or phosphoric acid, and the UV spectra (200–400 nm) were recorded with a UV-VIS spectrometer. Fig. 1A showed the effects of various acids on the ultraviolet spectra of Ce(IV). The results showed that 0.1 mol L−1 sulfuric acid has the maximum absorbance peak of Ce(IV) ion at 320 nm. Meanwhile, at all concentrations, hydrochloric acid has the same UV spectra. There was no absorbance at 320 nm indicating that hydrochloric acid is not suitable for antioxidant screening. Phosphoric acid also showed very low absorbance at 320 nm and thus 0.1 mol L−1 sulfuric acid was determined as the optimum solvent for the oxidization capacity assay of Ce(SO4)2 (Fig. 1B).
image file: c6ra08588a-f1.tif
Fig. 1 Influence of various acids, acid concentration, Ce(SO4)2 concentration and reaction time on the stability and sensitivity of cerium reducing antioxidant capacity assay. Here, ΔA = A0A1, where A0 is the absorbance of 0.2 mL Ce(SO4)2 solution with 2.3 mL water, A1 is that of 0.2 mL Ce(SO4)2 with 1.5 mL water and 0.8 mL chlorogenic acid. (A) Effects of various acids on the UV spectra of the antioxidant assay. (1) Sulfuric acid. (2) Hydrochloric acid. (3) Phosphoric acid. (B) Influence of various sulfuric acid concentrations on the antioxidant assay sensitivity, 0.01 (□), 0.05 (△), 0.1 (▲), 0.2 (■), 0.3 (○), 0.40 (●), 0.5 (×) and 1.0 (*). (C) The effects of different concentrations of Ce(SO4)2 solution 1 × 10⁻³ mol L−1 (*), 1.5 × 10⁻³ mol L−1 (■), 2.0 × 10⁻³ mol L−1 (□), 2.5 × 10⁻³ mol L−1 (△), 3.0 × 10⁻³ mol L−1 (×) and 4.0 × 10⁻³ mol L−1 (○). (D) Influence of reaction time (■).
2.1.2 The influence of Ce(SO4)2 concentration. The concentration of Ce(SO4)2 plays an important role in the sensitivity of screening. To select Ce(SO4)2 concentrations, different concentrations of Ce(SO4)2 (1 × 10⁻³ mol L−1, 1.5 × 10⁻³ mol L−1, 2.0 × 10⁻³ mol L−1, 2.5 × 10⁻³ mol L−1, 3.0 × 10⁻³ mol L−1, 3.5 × 10⁻³ mol L−1 and 4.0 × 10⁻³ mol L−1) in 0.1 mol L−1 sulfuric acid were prepared. The absorbance differences before and after the addition of chlorogenic acid were calculated to estimate the completion of the oxidation of the antioxidant. Insufficient oxidative capacity were found when the Ce(SO4)2 concentration was less than 1.5 × 10⁻³ mol L−1 (Fig. 1C). There were no significant differences for the absorbance changes when the Ce(SO4)2 concentration was above 2.0 × 10⁻³ mol L−1. Based on these results, 2.0 × 10⁻³ mol L−1 of Ce(SO4)2 was considered to be the ideal concentration.
2.1.3 The effect of reaction time. For the post-column reaction, longer reaction times provide adequate mixing, but this deteriorates the resolution of the HPLC separation. The optimum reaction time was determined by using 2.0 × 10⁻³ mol L−1 Ce(SO4)2 and 1.0 × 10⁻⁴ mol L−1 chlorogenic acid and recording the absorbance at 320 nm every 10 seconds (Fig. 1D).

The reaction between Ce(SO4)2 and chlorogenic acid is completed within 20 seconds; thus, 20 seconds was used for on-line screening. In this study, polytetrafluoroethylene (PTFE) tubing with 0.3 mm OD and 0.15 mm ID was used for the derivation reactor, and 20 seconds of reaction time corresponded to 8 m of PTFE tubing.

2.1.4 The influence of reaction temperature. To determine the best temperature for the antioxidant assay, an oven-based column was used to evaluate the stability at 20 °C, 30 °C, 40 °C, 50 °C, and 60 °C. The results showed that 20 °C provided the most stable absorbance values. Though higher temperatures might result in a faster reaction and higher sensitivity, but the absorbance stability was not as good as at 20 °C. For convenience of temperature control, room temperature (25 °C) was used for the subsequent reactions.
2.1.5 The effect of methanol and acetonitrile percentages to the sensitivity. For the construction of an on-line HPLC screening method, one of the major parameters affecting sensitivity is the gradient solution.

Different percentages of methanol, acetonitrile and water were studied from 0% to 90% at 10% intervals. Three common additives including formic acid, acetic acid, and phosphoric acid were added at 0.2% as solvent modifiers to improve the HPLC separation. The results showed that both methanol and acetonitrile did not affect the sensitivity and reproducibility of the antioxidant assay at different percentages. This indicated that there was no baseline shift when gradient elution was used in the HPLC separation. Meanwhile, both formic acid and phosphoric acid significantly decreased the absorbance changes at 320 nm. This indicated that these two acids cannot be used as solvent modifiers. Acetic acid did not affect the absorbance change at 320 nm. Thus, acetic acid was used to improve the HPLC separation.

2.2 Comparison of HPLC-Ce(SO4)2 and HPLC-DPPH on-line detection on known antioxidants

To evaluate the sensitivity and selectivity differences between HPLC coupled to post-column Ce(IV) reduction capacity assay and conventional HPLC-DPPH assay, six known compounds with different structures including gallic acid, chlorogenic acid, caffeic acid, trans-resveratrol, quercetin and 4-acetylphenyl β-D-glucopyranoside were selected for HPLC separation and detection with both schemes (Fig. 2). The first five compounds are phenolic acid, hydroxycinnamic acid, phenolic acid ester, stilbenoid, and a flavonoid that represents the most common natural antioxidant. Of the six compounds, gallic acid, chlorogenic acid, caffeic acid, trans-resveratrol and quercetin are known natural antioxidants that were correctly screened with the HPLC-CERAC assay. Though all 5 active compounds were at the same concentration of 0.1 μg mL−1, their antioxidant capacities measured by CERAC assay were quite different (Fig. 2a). Trans-resveratrol showed the largest negative peak in the CERAC chromatogram suggesting it had the strongest antioxidant activity. Both HPLC-CERAC and HPLC-DPPH assays showed no negative peaks for 4-acetylphenyl β-D-glucopyranoside. Interestingly, though trans-resveratrol is a well-known natural antioxidant, it showed no negative peak in the HPLC-DPPH assay (Fig. 2b). This could be attributed to the slow reaction kinetics of trans-resveratrol with DPPH. Gallic acid showed the largest negative peak in the HPLC-DPPH assay. The remaining 3 compounds demonstrated similar antioxidant activities. Meanwhile, HPLC-CERAC analysis exhibited distinct activity differences for the five antioxidants as a function of concentration (in μg mL−1). The concentrations are the same, but their corresponding negative peak areas demonstrated significant differences.
image file: c6ra08588a-f2.tif
Fig. 2 Combined chromatograms of HPLC-CERAC assay and HPLC-DPPH assay for the on-line detection of antioxidants. Peak 1: gallic acid, Peak 2: 4-acetylphenyl β-D-glucopyranoside, Peak 3: chlorogenic acid, Peak 4: caffeic acid, Peak 5: trans-resveratrol and Peak 6: quercetin. (A) HPLC chromatogram of standards at 254 nm. (B) Chromatogram of the CERAC assay recorded at 320 nm. (C) Chromatogram from DPPH assay recorded at 517 nm. Chromatographic conditions: RP-18 column with gradient elution at 1.0 mL min−1 (methanol–water (5[thin space (1/6-em)]:[thin space (1/6-em)]95, v/v, with 0.1 acetic acid in both solvent) to methanol–water (95[thin space (1/6-em)]:[thin space (1/6-em)]5, v/v) over 30 min). All standards were 0.1 mg mL−1 dissolved in methanol with 5 μL sample injection. The chromatogram was recorded at 254 nm. For the post-column CERAC assay, the flow rate of cerium sulphate was 0.2 mL min−1, and the detection wavelength was 320 nm. For the post-column DPPH assay, the flow rate was 0.5 mL min−1, the temperature of reaction coil was controlled at 60 °C, and the detection wavelength was 517 nm.

In an additional experiment, the stabilities of cerium sulphate and DPPH stock solutions were compared over one week with both solutions stored in dark bottles and placed in a dark room at room temperature. The absorbance of the DPPH solution decreased more than 50% while the cerium sulphate stock solution had minimal change. Thus, we concluded that HPLC-CERAC assay showed good resolution, high sensitivity, and high stability for the screening of natural antioxidants.

2.3 Identification of antioxidative compounds in Z. clinopodioides with the on-line HPLC-Ce(SO4)2 screening method

Z. clinopodioides is an indigenous plant from north Xinjiang, China. It is used as a traditional herbal medicine to treat hypertension and ischemia myocardial, stimulate appetite and treat other diseases. The whole aerial part of Z. clinopodioides is also used as an herbal tea and food flavouring by the local Uygur people. Previous reports have shown that the main constituents of Z. clinopodioides are essential oils, flavonoids, alkaloids, vitamins, organic acids and other compounds.21–26 However, the main antioxidants are not completely understood. The method described above was applied to discover the antioxidative compounds in Z. clinopodioides extracts. UV and CERAC assay chromatograms as well as gradient conditions of the crude ethanol extract from Z. clinopodioides are presented in Fig. 3. Peaks marked with a * indicate that the constituents were present in the crude extract without antioxidative activity, but they do have absorbance at 320 nm. Thus, they had strong positive peaks in the CERAC assay chromatogram.
image file: c6ra08588a-f3.tif
Fig. 3 Combined HPLC UV and post-column CERAC assay chromatograms of Z. clinopodioides crude extract (2 mg mL−1 in 90[thin space (1/6-em)]:[thin space (1/6-em)]10 methanol[thin space (1/6-em)]:[thin space (1/6-em)]water, v/v). Chromatographic conditions were a RP-18 column with gradient elution at 1.0 mL min−1 (methanol–water (20[thin space (1/6-em)]:[thin space (1/6-em)]80, v/v, with 0.1 acetic acid in both solvent) to methanol–water (40[thin space (1/6-em)]:[thin space (1/6-em)]60, v/v) for 30 min followed by 90[thin space (1/6-em)]:[thin space (1/6-em)]10 methanol–water for another 30 min). The injection volume was 20 μL. The sample chromatogram was recorded at 254 nm. For the post-column CERAC assay, the flow rate of cerium sulphate was 0.2 mL min−1, and the detection wavelength was 320 nm.

The on-line HPLC-CERAC assay shows nine compounds from the Z. clinopodioides ethanol extracts with antioxidative activities. These were selected for isolation and identification. This was guided by their retention time and UV absorption spectra. The sum of the nine active negative peaks areas accounted for 71% of the total peak area of the negative peaks suggesting that these 9 compounds constitute the majority of the total antioxidant capacity of Z. clinopodioides ethanol extracts.

To simplify the separation process, 10 g of crude ethanol extract was fractioned with buchi flash chromatography using a 120 g, 40 mm × 120 mm C18 flash chromatography to afford 10 fractions (fraction 1–fraction 10) of 5[thin space (1/6-em)]:[thin space (1/6-em)]95, 10[thin space (1/6-em)]:[thin space (1/6-em)]90, 20[thin space (1/6-em)]:[thin space (1/6-em)]80, 30[thin space (1/6-em)]:[thin space (1/6-em)]70, 40[thin space (1/6-em)]:[thin space (1/6-em)]60, 50[thin space (1/6-em)]:[thin space (1/6-em)]50, 60[thin space (1/6-em)]:[thin space (1/6-em)]40, 70[thin space (1/6-em)]:[thin space (1/6-em)]30, 80[thin space (1/6-em)]:[thin space (1/6-em)]20, and 0[thin space (1/6-em)]:[thin space (1/6-em)]100 of water[thin space (1/6-em)]:[thin space (1/6-em)]methanol with 0.5% acetic acids in both solvents. All fractions were analysed using the same gradient elution as the on-line screening method for the accurate identification of antioxidants peaks. The separation of the active compounds was performed using preparative HPLC with methanol (A) and water (B) under room temperature once the antioxidants peaks in the fractions were determined. All peaks were monitored at the λmax of each compound. The flow rate of p-HPLC was set to 15 mL min−1 with a system delay time of 16 seconds for collection. Fraction 3 afforded compound (1) 21 mg; fraction 4 afforded compound (2) 27 mg; fraction 5 afforded compound (3) and compound (4) 17 mg and 9 mg; fraction 6 afforded compound (5) 31 mg; fraction 7 afforded compound (6), compound (7), compound (8), and compound (9) at 8 mg, 15 mg, 20 mg, and 6 mg, respectively.

2.4 Structural identification of isolated compounds

Identification of the isolated active compounds was performed with UV spectroscopy, 1H and 13C NMR. All isolated compounds were known natural compounds; three of them were phenolic acids (compound 1, 2, 3), one of them was flavone glycosides (compound 5), and all of the remaining were flavonoid aglycones. The isolated and identified compounds are listed in Fig. 4.
image file: c6ra08588a-f4.tif
Fig. 4 The structures of the isolated compounds from Z. clinopodioides guided by the antioxidant activity assay. (1) Protocatechuic acid, (2) caffeic acid, (3) rosmarinci acid, (4) luteolin, (5) pinocembrin 7-O-rutinoside, (6) quercetin, (7) apigenin, (8) baicalein and (9) kaempferide.
2.4.1 Compound 1. White powder, UV λmax: 258, 292 nm; 1H NMR (DMSO-d6, 400 MHz) δ: 7.33 (1H, d, J = 2 Hz, H-2), 7.29 (1H, dd, J = 2.0, 8.4 Hz, H-6), 6.78 (1H, d, J = 8.4 Hz, H-5); 13C NMR (DMSO-d6, 100 MHz) δ: 122.2 (C-1), 117.0 (C-2), 145.3 (C-3), 150.4 (C-4), 115.6 (C-5), 122.4 (C-6), 168.0 (C-7). This white powder was identified to be 3,4-dihydroxybenzoic acid (protocatechuic acid) by comparing the NMR data to ref. 27.
2.4.2 Compound 2. White powder, 1H NMR (DMSO-d6, 400 MHz) δ: 7.43 (1H, d, J = 16.0 Hz, H-7), 7.04 (1H, d, J = 2.0 Hz, H-2), 6.97 (1H, dd, J = 2.0, 8.0 Hz, H-6), 6.76 (1H, d, J = 8.0 Hz, H-5), 6.16 (1H, d, J = 16.0 Hz, H-8); 13C NMR (DMSO-d6, 100 MHz) δ: 126.1 (C-1), 115.0 (C-2), 144.8 (C-3), 148.6 (C-4), 115.8 (C-5), 121.5 (C-6), 146.0 (C-7), 116.2 (C-8), 168.5 (C-9). This white powder was identified to be 3-(3,4-dihydroxyphenyl)-2-propenoic acid (caffeic acid) by comparing the NMR data to ref. 28.
2.4.3 Compound 3. Pale yellow powder (water), 1H NMR (DMSO-d6, 400 MHz) δ: 6.68 (1H, d, J = 8.0 Hz, H-2), 6.71 (1H, d, J = 2.0 Hz, H-5), 6.57 (1H, d, J = 8.0 Hz, H-6), 2.95 (1H, dd, J = 8.0, 16.0 Hz, H-7a), 3.01 (1H, dd, J = 5.0, 16.0 Hz, H-7b), 5.05–5.08 (1H, m, H-8), 7.09 (1H, s, H-2′), 6.79 (1H, d, J = 8.0 Hz, H-5′), 7.02 (1H, d, J = 8.0 Hz, H-6′), 7.48 (1H, d, J = 16.0 Hz, H-7′); 13C NMR (DMSO-d6, 100 MHz) δ: 127.8 (C-1), 117.1 (C-2), 145.3 (C-3), 144.4 (C-4), 115.8 (C-5), 120.5 (C-6), 36.5 (C-7), 73.3 (C-8), 171.3 (C-9), 125.8 (C-1′), 115.3 (C-2′), 146.4 (C-3′), 149.0 (C-4′), 116.2 (C-5′), 122.0 (C-6′), 146.0 (C-7′), 113.7 (C-8′), 166.4 (C-9′). This pale yellow powder was identified to be rosmarinci acid by comparing the NMR data to ref. 29.
2.4.4 Compound 4. Yellow powder (methanol), 1H NMR (DMSO-d6, 400 MHz) δ: 6.43 (1H, s, H-3), 6.10 (1H, d, J = 2.0 Hz, H-6), 6.33 (1H, d, J = 2.0 Hz, H-8), 7.27–7.29 (2H, m, H-2′,6′), 6.79 (1H, d, J = 8.0 Hz, H-5′); 13C NMR (DMSO-d6, 100 MHz) δ: 164.8 (C-2), 102.4 (C-3), 182.4 (C-4), 161.8 (C-5), 98.7 (C-6), 164.8 (C-7), 93.6 (C-8), 158.0 (C-9), 103.8 (C-10), 122.2 (C-1′), 112.7 (C-2′), 145.6 (C-3′), 149.6 (C-4′), 115.3 (C-5′), 118.8 (C-6′). This compound was identified to be 3′,4′,5,7-tetrahydroxy-flavon (luteolin) by comparing the NMR data to ref. 30.
2.4.5 Compound 5. Pale yellow powder, 1H NMR (DMSO-d6, 400 MHz) δ: 7.54 (2H, d, J = 7.2 Hz, H-2′,6′), 7.42 (2H, t, J = 7.2 Hz, H-3′,5′), 7.39 (1H, t, J = 7.2 Hz, H-4′), 6.16 (2H, d, J = 1.6 Hz, H-6,8), 5.65 (1H, dd, J = 3.2, 10.0 Hz, H-2), 4.98 (1H, d, J = 7.2 Hz, H-1′′), 4.52 (1H, brs, J = 7.2 Hz, H-1′′′), 3.71–3.75 (1H, m, H-3′′), 3.59–3.66 (1H, m, H-5′′), 3.51–3.58 (1H, m, H-2′′), 3.37–3.44 (1H, m, H-5′′′), 3.20–3.28 (1H, m, H-4′′), 3.02–3.20 (1H, m, H-3′′′), 2.85–2.87 (1H, m, H-2′′′), 2.81–2.83 (1H, m, H-4′′′), 3.78–3.86 (1H, m, H-6′′), 2.47–2.53 (2H, m, H-3), 1.09 (3H, t, J = 6.4 Hz, H-6′′′); 13C NMR (DMSO-d6, 100 MHz) δ: 78.9 (C-2), 42.5 (C-3), 197.2 (C-4), 162.9 (C-5), 96.0 (C-6), 165.6 (C-7), 97.0 (C-8), 163.5 (C-9), 103.8 (C-10), 138.9 (C-1′), 129.0 (C-3′,4′,5′), 127.2 (C-2′,6′), 99.8 (C-1′′), 73.4 (C-2′′), 76.0 (C-3′′), 71.1 (C-4′′), 76.7 (C-5′′), 66.4 (C-6′′), 101.0 (C-1′′′), 70.7 (C-2′′′), 68.7 (C-3′′′), 70.0 (C-4′′′), 72.5 (C-5′′′), 18.3 (C-6′′′). This compound was identified to be pinocembrin 7-O-rutinoside by comparing the NMR data to ref. 31.
2.4.6 Compound 6. Yellow needle crystal (methanol), 1H NMR (DMSO-d6, 400 MHz) δ: 6.36 (1H, d, J = 2.0 Hz, H-6), 6.16 (1H, d, J = 2.0 Hz, H-8), 7.71 (1H, d, J = 2.0 Hz, H-2′), 7.60 (1H, dd, J = 8.0, 2.0 Hz, H-6′), 6.85 (1H, d, J = 8.0 Hz, H-5′); 13C NMR (DMSO-d6, 100 MHz) δ: 146.5 (C-2), 135.8 (C-3), 175.9 (C-4), 161.1 (C-5), 97.8 (C-6), 164.1 (C-7), 92.9 (C-8), 156.8 (C-9), 103.1 (C-10), 122.7 (C-1′), 114.5 (C-2′), 144.8 (C-3′), 147.3 (C-4′), 114.8 (C-5′), 120.2 (C-6′). This compound was identified to be 2-(3,4-dihydroxyphenyl)-3,5,7-trihydroxy-4H-chromen-4-one (quercetin) by comparing the NMR data to ref. 32.
2.4.7 Compound 7. Yellow crystal (methanol), 1H NMR (DMSO-d6, 400 MHz) δ: 12.97 (1H, s, 5-OH), 7.92 (2H, d, J = 9.0 Hz, H-2′,6′), 6.94 (2H, d, J = 8.8 Hz, H-3′,5′), 6.79 (1H, s, H-3), 6.49 (1H, d, J = 1.8 Hz, H-8), 6.20 (1H, d, J = 2.4 Hz, H-6); 13C NMR (DMSO-d6, 100 MHz) δ: 164.1 (C-2), 103.3 (C-3), 182.2 (C-4), 161.9 (C-5), 99.3 (C-6), 164.5 (C-7), 94.4 (C-8), 157.7 (C-9), 103.3 (C-10), 121.6 (C-1′), 128.9 (C-2′,6′), 116.4 (C-3′,5′), 161.9 (C-4′). This compound was identified to be 5,7-dihydroxy-2-(4-hydroxyphenyl)-4H-1-benzopyran-4-one (apigenin) by comparing the NMR data to ref. 33.
2.4.8 Compound 8. Yellow needle crystal (methanol), 1H NMR (DMSO-d6, 400 MHz) δ: 12.68 (1H, s, 5-OH), 10.58 (1H, s, 6-OH), 8.81 (1H, s, 6-OH), 8.06–8.08 (2H, m, H-2′,6′), 7.55–7.61 (3H, m, H-3′,4′,5′), 6.94 (1H, s, H-3), 6.65 (1H, s, H-8); 13C NMR (DMSO-d6, 100 MHz) δ: 163.3 (C-2), 104.9 (C-3), 182.5 (C-4), 147.4 (C-5), 129.7 (C-6), 154.1 (C-7), 94.4 (C-8), 150.3 (C-9), 104.7 (C-10), 131.4 (C-1′), 126.7 (C-2′,6′), 129.7 (C-3′,5′), 132.2 (C-6′). This compound was identified to be 5,6,7-trihydroxyflavone (baicalein) by comparing the NMR data to ref. 34.
2.4.9 Compound 9. Yellow powder (methanol), 1H NMR (DMSO-d6, 400 MHz) δ: 6.20 (1H, s, H-8), 6.45 (1H, s, H-6), 8.12 (2H, d, J = 9.2 Hz, H-2′,6′), 7.10 (2H, d, J = 9.2 Hz, H-3′,5′); 13C NMR (DMSO-d6, 100 MHz) δ: 146.2 (C-2), 136.1 (C-3), 176.0 (C-4), 160.7 (C-5), 98.2 (C-6), 164.0 (C-7), 93.5 (C-8), 156.2 (C-9), 103.1 (C-10), 123.3 (C-1′), 129.3 (C-2′,6′), 114.0 (C-3′,5′), 160.5 (C-4′). This compound was identified to be 3,5,7-trihydroxy-2-(4-methoxyphenyl) chromen-4-one (Kaempferide) by comparing the NMR data to ref. 35.

3. Conclusions

In conclusion, we evaluated a novel coupling system of reverse phase gradient LC to post-column Ce(IV) sulphate UV-detection.

This was tested with six known natural compounds and applied to the screening of antioxidants in Z. clinopodioides. This new method offers rapid turnaround time and high resolution with different selectivity versus conventional on-line HPLC-DPPH method. In addition, nine compounds including protocatechuic acid (1), caffeic acid (2), rosmarinci acid (3), luteolin (4), pinocembrin 7-O-rutinoside (5), quercetin (6), apigenin (7), baicalein (8), and kaempferide (9) were isolated from the extract of Z. clinopodioides. These species offer the major antioxidant activity. Six compounds were isolated from this plant for the first time. The proposed method offers a practical and efficient approach for the rapid screening of antioxidative compounds from natural products and other complex samples.

4. Experimental

4.1 Reagents

Ce(IV) sulphate and sulphuric acid were purchased from Shangpu Chemical Co., Ltd. (Shanghai, China). DPPH was obtained from Fluka Chemie AG (Buchs, Switzerland). Chemical standards of gallic acid (98%), chlorogenic acid (98%), caffeic acid (98%), trans-resveratrol (98%), quercetin (98%) and 4-acetylphenyl β-D-glucopyranoside (98%) were purchased from TCI Chemical Industry Co., Ltd. (Tokyo, Japan). All organic solvents for analytic HPLC and preparative HPLC were purchased from Dikma Technology Inc. (Lake Forest, CA 92630, USA) and filtered with 0.22 μm membranes before use. Analytical HPLC water was supplied by Sigma Co. (St. Louis, MO, USA) and preparative HPLC water was obtained from a Milli-Q water system (Millipore, Milford, MA, USA). Glacial acid was purchased from J. T. Baker (Phillipsburgh, NJ, USA). Individual stock solutions of above standards were prepared in methanol. For HPLC post-column analysis, the stock solutions were respectively diluted with methanol to 0.1 μg mL−1.

4.2 Materials and sample preparation

The whole aerial part of Z. clinopodioides including leaves and stems were collected from Molei County, Changji, Xinjiang, China (N43°47′28.92′′, E90°16′11.62′′) and identified by Professor Yuan Liu from Department of Chemistry in Southwest University for Nationalities in China. All samples were collected in October, 2013 and air dried at room temperature in a ventilated dark room. Two kilograms of the dried aerial part were milled and extracted with 70% ethanol (1[thin space (1/6-em)]:[thin space (1/6-em)]10) for 72 hours, which was then extracted 3 times. The extracts were evaporated with a rotary evaporator to obtain 265 grams of solids. The solids were then used for on-line HPLC screening of antioxidants and preparative HPLC to get the active constituents. For HPLC analysis, all samples were filtered through a 0.22 μm filters (Anpel, Shanghai, China).

4.3 Solution preparation

4.3.1 Ce(SO4)2 stock solution. Cerium sulphate was weighed and placed into a volumetric flask and dissolved in a membrane-filtered (0.45 μm) Milli-Q water (Millipore, Bedford, MA). Then, 0.27 mL of concentrated sulfuric acid was added. The stock solution was then diluted to 1.0 × 10⁻³ mol L−1, 1.5 × 10⁻³ mol L−1, 2.0 × 10⁻³ mol L−1, 2.5 × 10⁻³ mol L−1, 3.0 × 10⁻³ mol L−1, 3.5 × 10⁻³ mol L−1 and 4.0 × 10⁻³ mol L−1.
4.3.2 DPPH solution. 30 mg of DPPH standards were dissolved in 500 mL of methanol[thin space (1/6-em)]:[thin space (1/6-em)]acetone (3[thin space (1/6-em)]:[thin space (1/6-em)]1, v/v) at 1.5 × 10⁻⁴ mol L−1 and stored at 4 °C in a dark bottle.
4.3.3 Standard solutions. Five commonly used antioxidants including gallic acid, chlorogenic acid, caffeic acid, trans-resveratrol and quercetin were dissolved in methanol at 0.1 mg mL−1; 4-acetylphenyl β-D-glucopyranoside was used as a negative standard dissolved in methanol at 0.1 mg mL−1.

4.4 On-line HPLC screening instruments

The HPLC system for on-line screening of individual antioxidants consisted of a Shimadzu LC-20 AT liquid chromatography (Shimadzu, Tokyo, Japan) equipped with a vacuum degasser, a binary solvent delivery pump, an auto sampler and a diode array detector (DAD)—these were controlled with Lab Solutions software.

Separation was performed on a Waters Sunfire C18 column (250 × 4.6 i.d., 5 μm) at 40 °C. The mobile phase contained 10 mM potassium dihydrogen phosphate solution (pH 4.7) and methanol under gradient elution. The flow rate was 1.0 mL min−1, and the UV detector was set to 319 nm. The DAD was used from 200 nm to 760 nm. The DPPH and cerium sulphate were delivered by a Waters reagent manager with a PEEK piston. All tubing for the post column reaction system were 1/16 PEEK with 0.015 i.d. The reaction coil was made in house with 2 meters of PTFE tubing with 0.3 mm o.d. and 0.15 mm i.d. The absorbance at 319 nm was recorded with an SPD-10A UV detector (Shimadzu, Tokyo, Japan). Fig. 5 presents the instrument scheme.


image file: c6ra08588a-f5.tif
Fig. 5 The scheme of the on-line HPLC-DAD detection coupled to the cerium sulphate reducing reaction assay with UV detection. The arrows indicate the flow directions.

4.5 Preparative HPLC

A Waters preparative HPLC system equipped with a 2489 UV/Visible Detector, a 2545 Binary Gradient Module, a 2767 Sample Manager and a fraction collector was used for the isolation of the active constituents from Z. clinopodioides extract. This was guided by the on-line screening results. The separation was performed with a Waters sunfire C18 (19 × 250 mm, 10 μm) column using the same gradient elution as analytical HPLC methods.

Acknowledgements

The research was financially supported by grants from National Science Foundation of China (NSFC 21365018). The authors would like to thank Professor Yuan Liu from Southwest University for Nationalities for the identification of Z. clinopodioides Lam.

Notes and references

  1. W. J. Malaisse, F. Malaisselagae, A. Sener and D. G. Pipeleers, Proc. Natl. Acad. Sci. U. S. A., 1982, 79, 927–930 CrossRef CAS.
  2. J. L. Marx, Science, 1987, 235, 529–531 CrossRef CAS PubMed.
  3. J. P. Allard, E. Aghdassi, J. Chau, I. Salit and S. Walmsley, Am. J. Clin. Nutr., 1998, 67, 143–147 CrossRef CAS PubMed.
  4. L. L. De Zwart, J. H. N. Meerman, J. N. M. Commandeur and N. P. E. Vermeulen, Free Radicals Biol. Med., 1999, 26, 202–226 CrossRef CAS PubMed.
  5. M. J. R. Howes and P. J. Houghton, Pharmacol., Biochem. Behav., 2003, 75, 513–527 CrossRef CAS.
  6. H. P. Witschi, Food Chem. Toxicol., 1986, 24, 1127–1130 CrossRef CAS PubMed.
  7. G. M. Williams, M. J. Iatropoulos and J. Whysner, Food Chem. Toxicol., 1999, 37, 1027–1038 CrossRef CAS PubMed.
  8. I. I. Koleva, H. A. G. Niederlander and T. A. van Beek, Anal. Chem., 2000, 72, 2323–2328 CrossRef CAS PubMed.
  9. J.-H. Wu, C.-Y. Huang, Y.-T. Tung and S.-T. Chang, J. Agric. Food Chem., 2008, 56, 328–332 CrossRef CAS PubMed.
  10. A. Dapkevicius, T. A. van Beek, H. A. G. Niederlander and A. de Groot, Anal. Chem., 1999, 71, 736–740 CrossRef CAS PubMed.
  11. H. A. G. Niederlander, T. A. van Beek, A. Bartasiute and I. I. Koieva, J. Chromatogr. A, 2008, 1210, 121–134 CrossRef PubMed.
  12. I. I. Koleva, H. A. G. Niederlander and T. A. van Beek, Anal. Chem., 2001, 73, 3373–3381 CrossRef CAS PubMed.
  13. D. Bandoniene and M. Murkovic, J. Agric. Food Chem., 2002, 50, 2482–2487 CrossRef CAS PubMed.
  14. T. Toyo'oka, T. Kashiwazaki and M. Kato, Talanta, 2003, 60, 467–475 CrossRef.
  15. S. E. Celik, M. Ozyurek, K. Guclu and R. Apak, Anal. Chim. Acta, 2010, 674, 79–88 CrossRef CAS PubMed.
  16. Q. Zhang, E. J. C. van der Klift, H.-G. Janssen and T. A. van Beek, J. Chromatogr. A, 2009, 1216, 7268–7274 CrossRef CAS PubMed.
  17. M. M. Karim, S. H. Lee, Y. S. Kim, H. S. Bae and S. B. Hong, J. Fluoresc., 2006, 16, 17–22 CrossRef CAS PubMed.
  18. D. Ozyurt, B. Demirata and R. Apak, Talanta, 2007, 71, 1155–1165 CrossRef CAS PubMed.
  19. D. Ozyurt, B. Demirata and R. Apak, J. Food Compos. Anal., 2010, 23, 282–288 CrossRef CAS.
  20. D. Ozyurt, B. Demirata and R. Apak, J. Fluoresc., 2011, 21, 2069–2076 CrossRef CAS PubMed.
  21. G. E. Meral, S. Konyalioglu and B. Ozturk, Fitoterapia, 2002, 73, 716–718 CrossRef CAS PubMed.
  22. J. Behravan, M. Ramezani, M. K. Hassanzadeh, M. Eskandari, J. Kasaian and Z. Sabeti, J. Essent. Oil-Bear. Plants, 2007, 10, 339–345 CrossRef CAS.
  23. S. Ozturk and S. Ercisli, Food Control, 2007, 18, 535–540 CrossRef CAS.
  24. F. S. Sharopov and W. N. Setzer, Nat. Prod. Commun., 2011, 6, 695–698 CAS.
  25. F. Senejoux, C. Demougeot, P. Kerram, H. A. Aisa, A. Berthelot, F. Bevalot and C. Girard-Thernier, Fitoterapia, 2012, 83, 377–382 CrossRef CAS PubMed.
  26. W. Ding, T. Yang, F. Liu and S. Tian, Pharmacogn. Mag., 2014, 10, S1–S5 Search PubMed.
  27. M. A. Ramadan, A. S. Ahmad, A. M. Nafady and A. I. Mansour, Nat. Prod. Res., 2009, 23, 1218–1230 CrossRef CAS PubMed.
  28. Z. H. Jiang, Y. Hirose, H. Iwata, S. Sakamoto, T. Tanaka and I. Kouno, Chem. Pharm. Bull., 2001, 49, 887–892 CrossRef CAS PubMed.
  29. X. J. Wu, J. X. Song, A. H. Zhao and W. Jia, Nat. Prod. Res. Dev., 2011, 23, 446–448 Search PubMed.
  30. H. Dai, L. L. Huang, Y. H. Guo and W. X. Gu, J. Trop. Subtrop. Bot., 2013, 21, 266–272 CAS.
  31. X. Xu, H. Xie, J. Hao, Y. Jiang and X. Wei, J. Agric. Food Chem., 2011, 59, 1205–1209 CrossRef CAS PubMed.
  32. A. Yin and S. Huang, Nat. Prod. Res. Dev., 2012, 24, 897–899 Search PubMed.
  33. T. Nakasugi and K. Komai, J. Agric. Food Chem., 1998, 46, 2560–2564 CrossRef CAS.
  34. C. Formisano, D. Rigano, F. Senatore, S. Bancheva, A. Maggio, S. Rosselli and M. Bruno, Chem. Biodiversity, 2012, 9, 2096–2158 Search PubMed.
  35. H. J. Kim, E. R. Woo and H. Park, J. Nat. Prod., 1994, 57, 581–586 CrossRef CAS.

This journal is © The Royal Society of Chemistry 2016
Click here to see how this site uses Cookies. View our privacy policy here.