Influence of acid site density on the three-staged MTH induction reaction over HZSM-5 zeolite

Liang Qiab, Jinzhe Lia, Yingxu Weia, Yanli Hea, Lei Xu*a and Zhongmin Liu*a
aNational Engineering Laboratory for Methanol to Olefins, Dalian National Laboratory for Clean Energy, iChEM (Collaborative Innovation Center of Chemistry for Energy Materials), Dalian Institute of Chemical Physics, Chinese Academy of Sciences, Dalian 116023, People's Republic of China. E-mail: liuzm@dicp.ac.cn; leixu@dicp.ac.cn; Fax: +86 411 84379998; Tel: +86 411 84379998
bUniversity of Chinese Academy of Sciences, Beijing 100049, People's Republic of China

Received 1st April 2016 , Accepted 21st May 2016

First published on 23rd May 2016


Abstract

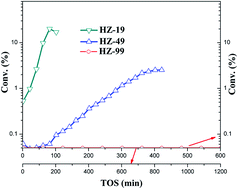
The influence of acid site density on the three-stage methanol to hydrocarbons (MTH) induction reaction was systematically investigated over three HZSM-5 catalysts (average size of 1–2 μm) with different Si/Al ratios. The initial active species can be formed more easily over catalysts with higher acid site density during the initial two stages and co-feeding toluene could shorten the initial two stages in the temperature-programmed MTH reaction. For each catalyst, the kinetics of the autocatalysis reaction during the induction period was investigated and the corresponding activation energy was calculated and compared. It was found that the formation rate of the retained species and its autocatalytic effect can both be enhanced over samples with high acid site density. Organic materials occluded in the catalyst during the MTH induction reaction were also analyzed ex situ by thermal analysis and GC-MS after extraction. The characterization results corresponded with the kinetic results very well.


1 Introduction

The decreasing oil reserves with the increase of demand for crude oil-based fuel and chemicals including industrially important light olefins (e.g., ethene and propene) make it more and more important to find another energy route. In the past few years, the MTH reaction over an acid zeolite catalyst, including gasoline-range hydrocarbons (methanol-to-gasoline, MTG) and light olefins (methanol-to-olefins, MTO) was recognized as a perfect alternative since methanol could be simply mass-produced from natural gas, coal, and biomass.1–4

It's generally acknowledged that three reaction stages, induction period, steady-state period and deactivation period are involved in the whole MTH process.1,4 A deep, clear and comprehensive understanding of the MTH reaction mechanism is of great significance for the development of an efficient catalyst with high selectivity and long lifetime. During the last decades, active and controversial debate on the reaction mechanism in methanol conversion has received great enthusiasm.5–14 Up to date, an indirect “hydrocarbon pool” (HCP) mechanism during the steady-state process has received popular support from experimental and theoretical investigation.9,15,16 The HCP species could be described as a catalytic scaffold, to which methanol is added and olefins are eliminated in a closed catalytic cycle.

According to the HCP mechanism, carbenium ions are generally considered to be important intermediates to produce olefins, and thus investigation of the nature of intermediates is of great importance.12,17–29 With a newly synthesized SAPO-type molecular sieve with large cavities, DNL-6, heptaMB+ was directly observed for the first time during methanol conversion under real working conditions.21 Moreover, another two important carbenium ions involved in MTO reaction, heptaMB+ and pentaMCP+, were also directly observed in CHA-type catalysts using methanol as the sole reactant.23 Recently, several C5 and C6-cyclic carbocations and their specific role in the MTH reaction over HZSM-5 catalyst were systematically investigated.25,28 Olsbye et al. later found that besides carbenium and polymethylbenzenes, olefins may also act as another kind of active HCP species in zeolites such as the medium-pore ZSM-5 zeolite with 3-D 10-ring channels.30,31 This leads to the proposal of the “dual-cycle” mechanism: one in which olefins are repeatedly methylated to form branched species which are susceptible to cracking and another in which aromatics are repeatedly methylated and dealkylated to form light olefins.30,31

Considering the HCP mechanism, initial aromatic HCP species should be accumulated during the induction period to transform the fresh catalyst to an active working one. As a result, factors influencing the formation of initial organic species will definitely affect the induction period. A series of work have been performed to help understanding those influencing the initial HCP species formation during the MTH reaction. In our previous research, the induction reaction behaviour was observed with a self-designed consecutive pulse reaction system. The contact time was found to influence the efficient formation of primary organic compounds and methanol conversion with low-contact time would present obvious induction period which was characterized by a high methane yield.32 Lee and co-workers demonstrated the effect of crystallite size on the MTO induction period over SAPO-34 catalyst. The large-crystal catalyst with small external surface area presented a long induction period and the different induction reaction behaviour was attributed to the different number of accessible cages near the external surface.33

In case of ZSM-5 catalyst, we have investigated the reaction behaviours and kinetics during induction period of methanol conversion, which gave interesting phenomena that the induction period could be further distinguished to be three stages, i.e., the initial C–C bond formation stage, initial HCP species accumulation stage, and the autocatalysis reaction stage.34 The formation rate of coke species can be compared according to the value of apparent activation energy which can be calculated based on the methods we proposed. Moreover, it should be noted that only trace amount of retained species was formed in the initial two stages while most of the HCP species during the induction period were generated at the autocatalysis stage. Both the formation rate of HCP species and its autocatalytic effect can be evaluated through the apparent activation energy of the autocatalysis stage.

As an acid-catalyzed process, the MTH induction reaction should be very sensitive to the acid environment of the catalyst, like acid strength and acid site density. In this contribution, three HZSM-5 catalysts with different Si/Al ratios of 19, 49 and 99 were applied to investigate the influence of acid site density on the MTH induction reaction. Based on the experimental and kinetic research, effect of the acid site density on the formation of HCP species and the autocatalytic effect during the three stages of the MTH induction period was systematically investigated.

2 Experimental section

2.1 Preparation of the catalysts

Three HZSM-5 samples (Si/Al = 19, 49 and 99) (the samples were designated as HZ-19, HZ-49 and HZ-99 correspondingly) were obtained from The Catalyst Plant of Nankai University.

2.2 Characterization of the catalysts

The powder XRD pattern was recorded on a PANalytical X'Pert PRO X-ray diffractometer with Cu-Kα radiation (λ = 1.54059 Å), operating at 40 kV and 40 mA. The chemical composition of the samples was determined with Philips Magix-601 X-ray fluorescence (XRF) spectrometer. The crystal morphology was observed by field emission scanning electron microscopy (Hitachi, SU8020).

The acid properties were examined by means of the temperature-programmed desorption of ammonia (NH3-TPD). The experiment was carried out with an Autochem 2920 equipment (Micromeritics). The calcined samples were pretreated at 550 °C for 1 h in He and were then saturated with ammonia at 100 °C for 30 min. After the samples were purged with helium, they were heated at 10 °C min−1 from 100 °C to 700 °C.

1H MAS NMR spectroscopy was carried out by a Varian Infinity plus-400 spectrometer equipped with a 9.4 T widebore magnet. Before the measurements, samples were dehydrated at 400 °C and under a pressure below 10−3 Pa for 20 h. 1H MAS NMR spectra were recorded by a 4 mm MAS probe and a spin-echo program. The pulse width was 2.2 μs for a π/4 pulse, and 32 scans were accumulated with a 10 s recycle delay.

The in situ FTIR spectroscopy experiments of adsorbed pyridine were carried out on a TENSOR 27 spectrometer. The self-supporting disk (15–20 mg) of the sample was placed in an IR cell equipped with a vacuum system and pretreated by evacuation (10−2 Pa) at 400 °C for 1 h. The sample disk was adsorbed pyridine at 30 °C and then physically desorbed at 200 °C for 30 min.

N2 adsorption–desorption isotherms were obtained on a Micrometrics ASAP 2020 system at 77 K.

The total amount of oxidable hydrocarbons in catalyst was determined using TGA. About 30 mg of sample was used. It was heated to 700 °C with a constant heating rate of 5 °C min−1. The atmosphere was 10 mL min−1 O2 + 10 mL min−1 N2.

2.3 Extraction and GC-MS analysis of the confined organics

Organic compounds trapped in the catalyst was obtained by first dissolving the catalyst (50 mg) in 1.0 mL of 15% HF in a screw-cap Teflon vial and then extracted in 0.5 mL CH2Cl2. The organic phase was extracted by CH2Cl2, and then analyzed using an Agilent 7890A/5975C GC/MSD.

2.4 Catalytic tests

The reaction was investigated in a fixed-bed reactor at atmospheric pressure as described in ref. 34. All samples were pressed into tablets, crushed and sieved into a fraction of 40–60 mesh. In all experiments, a catalyst sample of 1 g was loaded into the reactor. Then quartz sand was added to the upper and lower part of reactor to get a plug flow of the mixed feed. Prior to the introduction of reactants, the catalyst was activated in situ at 550 °C under a flow of air (20 mL min−1) for 2 h before cooling to reaction temperatures. For the temperature-programmed MTH reaction, the reaction temperature was increased continuously at a heating rate of 0.5 °C min−1.

Methanol was pumped into the reactor in a certain and steady velocity (0.085 mL min−1) to get a space velocity of 4 h−1. In order to avoid the product solidification, the outlet line was twined with the heat tape to keep the temperature at 240 °C. The effluent was analyzed by on-line gas chromatography (Agilent GC7890A) equipped with a FID detector and a PoraPLOT Q-HT capillary column. The conversion in this context refers to the percent of methanol converted into hydrocarbons, that is to say, dimethylether is also considered as reactant in the following sections.

3 Results and discussion

3.1 Characterization results of the catalyst

Powder XRD confirmed that all the three samples consist of a pure and well crystalline MFI phase (Fig. S1).35 Fig. S2(a–c) showed the SEM photos of the HZSM-5 catalysts for HZ-19, -49, -99. Despite their different crystallite shapes, the crystallite sizes were almost the same, with average crystallite sizes of 1.0–2.0 μm for the HZ-19, -49, -99 catalysts. The N2 adsorption–desorption isotherm depicted in Fig. S3 indicated that all the HZSM-5 catalysts are typical microporous materials.

The acidity of the samples measured by NH3-TPD is presented in Fig. 1. The TPD profiles for the HZ-19, -49, -99 catalysts showed two desorption peaks at a low and a high temperature corresponding to weak and strong acid sites, respectively. The desorption peak area below the TPD curve decreased with increasing of Si/Al ratio, implying the decrease of the total number of acid sites. Additionally, it should be noted that both the low temperature and high temperature peak centers shifted to low temperature synchronously as the Si/Al ratio increases indicating the decrease of acid strength for both strong and weak acid sites.


image file: c6ra08393e-f1.tif
Fig. 1 TPD profiles of ammonia from HZ-19, 49 and 99 catalysts.

The acid properties of the HZSM-5 samples were further investigated through FT-IR with pyridine as adsorbed probe molecules. As is shown in Fig. S4, three pyridine adsorption peaks at 1545, 1489 and 1454 cm−1 are observed which are assigned to the Brønsted acid sites, the Lewis combined with Brønsted acid sites and the Lewis acid sites respectively.36 It is worth noting that the intensity of the peaks at 1545 cm−1 and 1454 cm−1 decreased apparently with the increase of Si/Al ratio, which corresponds well with the NH3-TPD result. The Brønsted acid sites of the samples were also characterized by means of 1H MAS NMR spectroscopy. The obtained spectra are shown in Fig. S4. Four signals appear in the spectra of the three samples. The signals at 1.6 and 2.3 ppm with low intensity are assigned to Si(OH) and Al(OH), respectively, and the signal at 3.8 and 5.4 ppm are ascribed to bridge hydroxyl groups (Si(OH)Al), indicating the presence of Brønsted acid sites. The acid site density of each sample can be calculated and the value is 0.53, 0.39 and 0.31 mmol g−1 for HZ-19, HZ-49 and HZ-99 catalyst (Table 1).

Table 1 Elemental composition, N2 sorption and 1H MAS NMR characteristics of tested samples
Sample Si/Ala SBET m2 g−1 Smicrob m2 g−1 Sextb m2 g−1 Vtotalc mL g−1 Acid densityd mmol g−1
a XRF.b t-Method.c Volume adsorbed at p/p0 = 0.97.d 1H MAS NMR.
HZ-19 19 340 318 22 0.151 0.53
HZ-49 49 338 317 20 0.144 0.39
HZ-99 99 370 352 18 0.167 0.31


The chemical composition, pore volume, and BET surface area of all samples are given in Table 1. The total surface area was calculated based on the BET equation. The surface area and pore volume of the HZ-19, -49, -99 materials were very similar, indicating the identical diffusivity of the four samples. Taking all the characteristics of the three catalysts into consideration, acid site density can be regarded as the main discriminating factor.

3.2 Influence of acid site density on the initial two stages of MTH induction reaction

According to our previous research, a critical amount of HCP species should be accumulated during the initial two stages to initiate the following autocatalysis stage.34 As an acid-catalyzed process, the formation of initial HCP species may be influenced by the acid site density. To clarify the role of acid site density during the initial two stages, the methanol conversion reaction was comparatively investigated over the three samples under an identical condition. The conversion profile of methanol according to the time on stream on HZ-49 catalyst at 265 °C is presented in Fig. 2(a). By using a logarithmic scale for methanol conversion, a linear relationship was clearly seen, indicating the existence of autocatalysis stage. Moreover, the initial two stages as well as the deactivation stages can also be discerned. For comparison, the conversion of methanol as a function of time on stream for HZ-19, and HZ-99 catalysts at 265 °C is also presented in Fig. 2(b). For HZ-19 catalyst, the autocatalysis reaction stage was obviously shown while the initial two stages was not observed due to its high reactivity under current condition. However, for the HZ-99 catalyst, the generation and accumulation of the initial HCP species was too difficult due to its low acid site density. As a result, the whole MTH reaction process stayed at the initial two stages even the reaction time was prolonged to about 1200 min. The result demonstrated that the initial two stages of MTH induction reaction was quite sensitive to the acid site density and higher acid site density was beneficial for the formation of initial HCP species.
image file: c6ra08393e-f2.tif
Fig. 2 Conversion of methanol on HZ-49 catalyst (a) and on HZ-19, 49, 99 catalyst (b) as a function of time at 265 °C.

3.3 Temperature-programmed MTH induction reaction over different catalysts

3.3.1 Change of methanol conversion during temperature-programmed MTH induction reaction. It has been proved that the MTH induction reaction was very sensitive to the reaction temperature and obvious induction period could only be observed in a moderate temperature range (245–260 °C) over HZ-19 catalyst.34 Moreover, the NH3-TPD results showed that the acid site density of the three samples was obviously different which indicated the different activity of the samples. Therefore, comparative kinetic study of MTH induction reaction over the three samples can't be carried on without further figuring out the moderate testing temperature range of each catalyst. In this study, the methanol conversion reactions were firstly performed under an identical temperature-programmed condition over HZ-19, -49, -99 catalysts. The reaction temperature was elevated linearly at an increasing rate of 0.5 °C min−1. The reactivity of catalysts can be compared directly in this way and more importantly, appropriate temperature ranges can be deduced according to the catalytic behaviours.

The results are presented in Fig. 3. For all samples, almost no methanol conversion was observed during the initial period, the long inactive course also demonstrated that the content of HCP species in the catalyst during this stage was too little to trigger obvious methanol conversion reaction. Moreover, the “starting temperature” for methanol conversion over different HZSM-5 catalysts varied considerably. For HZ-19, the autocatalysis reaction could be observed since 277 °C. However, the autocatalysis reaction was not noticeable until 287 °C and 297 °C for HZ-49 and HZ-99 catalysts individually. It is clearly shown that the acid site density has a great impact on the MTH induction reaction under study. The autocatalysis reaction can be initiated much easier for catalyst with higher acid site density indicating the much easier formation of HCP species on them.


image file: c6ra08393e-f3.tif
Fig. 3 Methanol conversion profiles as a function of temperature during the temperature-programmed methanol conversion for HZ-19, 49 and 99 catalysts.
3.3.2 GC-MS analysis of retained species during the temperature-programmed MTH induction reaction. The different reactivity of these three samples during the temperature-programmed MTH reaction indicated the different formation rate of HCP species. In this work, retained species in coked catalysts was directly analyzed to investigate the effect of acid site density on the formation of coke species during the temperature-programmed MTH induction reaction. HZ-19 and HZ-99 were chosen for investigation representatively.

Fig. 4(a and b) presents the GC-MS total ion chromatogram of the organics retained in the catalyst after the temperature reached 277 and 287 °C for HZ-19 (the coked samples were designate as HZ-19-277 and HZ-19-287) (Fig. 4(a)) and 298, 308, 318 °C for HZ-99 (the coked samples were designate as HZ-99-298, HZ-99-308 and HZ-99-318) (Fig. 4(b)). For HZ-19-277, the concentration of retained organics was very low and pentamethylbenzene (pentaMB) as well as tetramethylbenzenes (tetraMBs) seemed to dominate whereas trimethylbenzenes (triMBs) and hexamethylbenzene (hexaMB) can hardly be discerned. PentaMB and tetraMBs have been identified as the major aromatic HCP species recently. When the temperature increased to 287 °C, the concentration of tetraMBs increased by a factor of 2 and triMBs also emerged. While for HZ-99 catalyst, the detectable retained organics were only polyMBs (tetraMBs, pentaMB and hexaMB) until 318 °C and the concentration of them increased continuously as temperature increased. However, the concentration of the retained species on HZ-99 catalyst was detected much lower compared with that on HZ-19 catalyst through the GC-MS analysis. It can be clearly seen that the active retained species is hard to be formed and accumulated over catalyst with low acid site density.


image file: c6ra08393e-f4.tif
Fig. 4 GC-MS analyses of retained material in catalyst when temperature reached the scheduled value for HZ-19 (a) and HZ-99 (b).

Considering the HCP mechanism, the coke species retained in catalysts channels will help promote formation of more HCP species, thus presenting the autocatalytic effect. Despite the higher reaction temperature, the concentration of retained species was detected much lower on HZ-99 catalyst, indicating that the autocatalytic effect of the HCP species also needs the assistance of acid site.

3.3.3 Effect of co-feeding toluene on temperature-programmed MTH induction reaction. To further investigate the influence of acid site density on the autocatalytic effect of HCP species, we planned to directly introduce certain amount of active species to the reaction system. According to a recent report, an active hydrocarbon pool molecule could be methylbenzenes, methylnaphthalenes, or methyl derivatives thereof (e.g. xylenes, trimethylbenzene, etc.).13,36 Taking the size effect into consideration, toluene was chosen as representative active HCP species to investigate its promoting impact on temperature-programmed MTH induction reaction for it can diffuse without limitation in HZSM-5 zeolite. HZ-19 and HZ-99 were chosen for investigation representatively.

The results, given in Fig. 5, show clearly that the initial stages were effectively shortened for both catalysts by adding 0.1% toluene to methanol, presenting the promoting role of toluene on the methanol conversion reaction. The introduced toluene may be firstly methylated to the active higher methylbenzenes and then work as HCP centres during the reaction process.37 The promoting effect was more obviously shown over HZ-19 catalyst which helps prove that the formation of HCP species and its participation in the methanol conversion reaction can both be enhanced by increasing the acid site density.


image file: c6ra08393e-f5.tif
Fig. 5 Effect of co-feeding 0.1% toluene on temperature-programmed methanol conversion for HZ-19 (a) and HZ-99 (b) catalysts.

3.4 Effect of acid site density on the kinetics of the MTH induction reaction

During the autocatalysis stage, the concentration of the catalytic HCP species increases with time on stream. For each catalyst, the ability of generating HCP species can be reflected through the activation energy of the autocatalysis reaction stage. To get more kinetic information of the influence of acid site density on the formation rate of HCP species in the autocatalysis stage, methanol conversion reaction at different temperatures was performed on each catalyst. For HZ-49, the methanol conversion profiles are presented in Fig. 6. It is clearly seen that, besides acid site density, the MTH induction reaction is also very sensitive to the temperature. As the temperature increased to 270 and 280 °C, only the autocatalysis stage and the deactivation stage can be discerned, the initial two stages was no longer distinguishable.
image file: c6ra08393e-f6.tif
Fig. 6 Conversion of methanol on HZ-49 catalyst as a function of time at three different temperatures.

For the autocatalysis stage, according to the linear relation between the methanol conversion (in natural logarithmic coordinates) and time on stream, the reaction rate equation can be directly expressed as follows:

 
ln(xA) = −k × t + B0 (1)
 
xA = Bekt (2)
here, k is the apparent reaction rate constant which can be got from the marked equation in Fig. 7(a). ln[thin space (1/6-em)]k as a function of 1/T is depicted in Fig. 7(b), giving us a perfect straight line. By the slope of the straight line the activation energy of the initial MTH reaction could be calculated to be 264 kJ mol−1.


image file: c6ra08393e-f7.tif
Fig. 7 Conversion of methanol on HZ-49 catalyst as a function of time at three different reaction temperatures during the autocatalysis reaction stage (a). Arrhenius plots derived from the rate constants of the autocatalysis reaction stage (b).

Kinetic investigation of the other two samples (HZ-19 and HZ-99) were also performed for comparison. It should be noted that due to the different activity of the four catalysts, the MTH reaction was performed at different temperature ranges for different catalysts (the tested temperature was chosen according to the temperature-programmed MTH reaction behaviour). All the methanol conversion profiles are presented in Fig. 8(a and c). The apparent reaction rate constants can be got from the equation marked in Fig. 8(b and d). ln[thin space (1/6-em)]k as a function of 1/T for the three catalyst was depicted in Fig. 9, the activation energy for different catalysts was calculated using the same method and listed in Table 2. It is clearly shown that, the activation barrier decreased with the increase of acid site density, indicating that the active HCP species can be formed faster and easier for catalyst with higher acid site density. The kinetic result corresponded with the temperature-programmed results very well.


image file: c6ra08393e-f8.tif
Fig. 8 Conversion of methanol as a function of time at different temperatures on HZ-19 (a), and HZ-99 (c), conversion of methanol as a function of time during the autocatalysis stage for HZ-19 (b) and HZ-99 (d).

image file: c6ra08393e-f9.tif
Fig. 9 Arrhenius plots derived from the rate constants of the autocatalysis stage on HZ-19, 49 and 99 catalysts.
Table 2 Activation energies of the autocatalysis stage for different samples
Sample HZ-19 HZ-49 HZ-99
E (kJ mol−1) 234 264 311


In the autocatalysis stage, reactions like olefin methylation, aromatic methylation, olefin polymerization, hydrogen transformation and aromatization are very likely to happen. Despite the complexity of the autocatalysis reaction, most of the secondary reactions are acid-catalyzed processes and can be promoted over catalyst with high acid site density. It's difficult to impose a specific meaning to the value of the calculated activation energy. But more importantly, the kinetic investigation provides us a more convenient way to carry out the comparative research and help understand the HCP mechanism more comprehensively.

3.5 Effect of acid site density on the formation of coke species under isothermal conditions

As was discussed above, the generation of aromatic retained species was greatly influenced by the acid site density. Moreover, the deposition of coke on the 3D-MFI was mainly internally deposited, while for MFI nanosheets it was exclusively on the external surface.38 Consequently, HZSM-5 catalysts with higher Si/Al ratios presented higher apparent activation energy during the autocatalysis reaction stage. To better investigate the influence of acid site density on the formation of retained HCP species, formation of coke species over different catalysts was further compared under isothermal conditions. All the tested temperature was chosen according to the performance of temperature-programmed MTH induction reaction. The total weight of organic deposits were analyzed by thermogravimetric analysis (TGA). The TGA results summarized in Fig. 10 showed that the amount of coke species increased almost linearly with temperature for all the tested samples. Despite the lower reaction temperature, the amount of organic deposits formed on HZ-19 samples during the induction reaction process is obviously higher than that on HZ-49 and HZ-99 catalysts, indicating the much more rapid formation and accumulation of organic compounds on HZ-19 catalyst. HZ-99 catalyst exhibited the lowest coke amount. It could be concluded that higher acid site density can bring about rapid formation of alkyl aromatics which have been reported to be active HCP species. This corresponds with the kinetic results very well.
image file: c6ra08393e-f10.tif
Fig. 10 Change of total coke amount with temperatures obtained from TG results for HZ-19, HZ-49 and HZ-99.

4 Conclusions

MTH induction reaction was performed over three HZSM-5 catalysts with similar sizes but different Si/Al ratios. Through a series of comparative investigation, the influence of acid site density on the three-staged MTH induction reaction was clarified. It was found that the increase of acid site density can accelerate the formation of initial active species and shorten the initial two stages. Kinetics of the autocatalysis stage at low temperature range were investigated for each catalyst. With the increase of acid site density, the apparent activation energy for the autocatalysis stage decreased and the length of the initial stages was obviously shortened. More importantly, both the formation rate of HCP species and its autocatalytic effect were found to be enhanced over catalysts with higher acid site density.

Acknowledgements

The authors thank the financial support from the National Natural Science Foundation of China (No. 21576256 and No. 21273005).

Notes and references

  1. J. F. Haw, W. G. Song, D. M. Marcus and J. B. Nicholas, Acc. Chem. Res., 2003, 36, 317–326 CrossRef CAS PubMed.
  2. D. M. McCann, D. Lesthaeghe, P. W. Kletnieks, D. R. Guenther, M. J. Hayman, V. Van Speybroeck, M. Waroquier and J. F. Haw, Angew. Chem., Int. Ed., 2008, 47, 5179–5182 CrossRef CAS PubMed.
  3. J. L. White, Catal. Sci. Technol., 2011, 1, 1630–1635 CAS.
  4. P. Tian, Y. X. Wei, M. Ye and Z. M. Liu, ACS Catal., 2015, 5, 1922–1938 CrossRef CAS.
  5. T. Mole, J. Catal., 1983, 84, 423–434 CrossRef CAS.
  6. T. Mole, G. Bett and D. Seddon, J. Catal., 1983, 84, 435–445 CrossRef CAS.
  7. T. Mole, J. A. Whiteside and D. Seddon, J. Catal., 1983, 82, 261–266 CrossRef CAS.
  8. J. Novakova, L. Kubelkova, K. Habersberger and Z. Dolejsek, J. Chem. Soc., Faraday Trans. 1, 1984, 80, 1457–1465 RSC.
  9. I. M. Dahl and S. Kolboe, J. Catal., 1994, 149, 458–464 CrossRef CAS.
  10. S. R. Blaszkowski and R. A. Vansanten, J. Phys. Chem., 1995, 99, 11728–11738 CrossRef CAS.
  11. M. Stocker, Microporous Mesoporous Mater., 1999, 29, 3–48 CrossRef CAS.
  12. J. F. Haw, J. B. Nicholas, W. G. Song, F. Deng, Z. K. Wang, T. Xu and C. S. Heneghan, J. Am. Chem. Soc., 2000, 122, 4763–4775 CrossRef CAS.
  13. W. G. Song, J. F. Haw, J. B. Nicholas and C. S. Heneghan, J. Am. Chem. Soc., 2000, 122, 10726–10727 CrossRef CAS.
  14. S. Teketel, U. Olsbye, K. P. Lillerud, P. Beato and S. Svelle, Microporous Mesoporous Mater., 2010, 136, 33–41 CrossRef CAS.
  15. I. M. Dahl and S. Kolboe, Catal. Lett., 1993, 20, 329–336 CrossRef CAS.
  16. I. M. Dahl and S. Kolboe, J. Catal., 1996, 161, 304–309 CrossRef CAS.
  17. T. Xu and J. F. Haw, J. Am. Chem. Soc., 1994, 116, 7753–7759 CrossRef CAS.
  18. T. Xu, D. H. Barich, P. W. Goguen, W. G. Song, Z. K. Wang, J. B. Nicholas and J. F. Haw, J. Am. Chem. Soc., 1998, 120, 4025–4026 CrossRef CAS.
  19. W. G. Song, J. B. Nicholas and J. F. Haw, J. Phys. Chem. B, 2001, 105, 4317–4323 CrossRef CAS.
  20. M. Bjorgen, F. Bonino, S. Kolboe, K. P. Lillerud, A. Zecchina and S. Bordiga, J. Am. Chem. Soc., 2003, 125, 15863–15868 CrossRef CAS PubMed.
  21. J. Z. Li, Y. X. Wei, J. R. Chen, P. Tian, X. Su, S. T. Xu, Y. Qi, Q. Y. Wang, Y. Zhou, Y. L. He and Z. M. Liu, J. Am. Chem. Soc., 2012, 134, 836–839 CrossRef CAS PubMed.
  22. K. De Wispelaere, K. Hemelsoet, M. Waroquier and V. Van Speybroeck, J. Catal., 2013, 305, 76–80 CrossRef CAS.
  23. S. T. Xu, A. M. Zheng, Y. X. Wei, J. R. Chen, J. Z. Li, Y. Y. Chu, M. Z. Zhang, Q. Y. Wang, Y. Zhou, J. B. Wang, F. Deng and Z. M. Liu, Angew. Chem., Int. Ed., 2013, 52, 11564–11568 CrossRef CAS PubMed.
  24. J. F. Li, Z. H. Wei, Y. Y. Chen, B. Q. Jing, Y. He, M. Dong, H. J. Jiao, X. K. Li, Z. F. Qin, J. G. Wang and W. B. Fan, J. Catal., 2014, 317, 277–283 CrossRef CAS.
  25. C. Wang, Y. Y. Chu, A. M. Zheng, J. Xu, Q. Wang, P. Gao, G. D. Qi, Y. J. Gong and F. Deng, Chem.–Eur. J., 2014, 20, 12432–12443 CrossRef CAS PubMed.
  26. W. L. Dai, C. M. Wang, M. Dyballa, G. J. Wu, N. J. Guan, L. D. Li, Z. K. Xie and M. Hunger, ACS Catal., 2015, 5, 317–326 CrossRef CAS.
  27. J. Z. Li, Y. X. Wei, J. R. Chen, S. T. Xu, P. Tian, X. F. Yang, B. Li, J. B. Wang and Z. M. Liu, ACS Catal., 2015, 5, 661–665 CrossRef CAS.
  28. C. Wang, J. Xu, G. D. Qi, Y. J. Gong, W. Y. Wang, P. Gao, Q. Wang, N. D. Feng, X. L. Liu and F. Deng, J. Catal., 2015, 332, 127–137 CrossRef CAS.
  29. J. B. Wang, Y. X. Wei, J. Z. Li, S. T. Xu, W. N. Zhang, Y. L. He, J. R. Chen, M. Z. Zhang, A. M. Zheng, F. Deng, X. W. Guo and Z. M. Liu, Catal. Sci. Technol., 2016, 6, 89–97 Search PubMed.
  30. S. Svelle, F. Joensen, J. Nerlov, U. Olsbye, K. P. Lillerud, S. Kolboe and M. Bjorgen, J. Am. Chem. Soc., 2006, 128, 14770–14771 CrossRef CAS PubMed.
  31. M. Bjorgen, S. Svelle, F. Joensen, J. Nerlov, S. Kolboe, F. Bonino, L. Palumbo, S. Bordiga and U. Olsbye, J. Catal., 2007, 249, 195–207 CrossRef CAS.
  32. Y. X. Wei, D. Z. Zhang, F. X. Chang and Z. M. Liu, Catal. Commun., 2007, 8, 2248–2252 CrossRef CAS.
  33. K. Y. Lee, H. J. Chae, S. Y. Jeong and G. Seo, Appl. Catal., A, 2009, 369, 60–66 CrossRef CAS.
  34. L. Qi, Y. X. Wei, L. Xu and Z. M. Liu, ACS Catal., 2015, 5, 3973–3982 CrossRef CAS.
  35. Q. Y. Wang, S. T. Xu, J. R. Chen, Y. X. Wei, J. Z. Li, D. Fan, Z. X. Yu, Y. Qi, Y. L. He, S. L. Xu, C. Y. Yuan, Y. Zhou, J. B. Wang, M. Z. Zhang, B. L. Su and Z. M. Liu, RSC Adv., 2014, 4, 21479–21491 RSC.
  36. L. Qi, J. Z. Li, Y. X. Wei, L. Xu and Z. M. Liu, Catal. Sci. Technol., 2016 10.1039/c5cy02238j.
  37. S. Al-Khattaf, S. A. Ali, A. M. Aitani, N. Zilkova, D. Kubicka and J. Cejka, Catal. Rev., 2014, 56, 333–402 CAS.
  38. V. O. Maksym, J. R. Wieslaw and J. Čejka, Catal. Sci. Technol., 2016 10.1039/c5cy02079d.

Footnote

Electronic supplementary information (ESI) available. See DOI: 10.1039/c6ra08393e

This journal is © The Royal Society of Chemistry 2016
Click here to see how this site uses Cookies. View our privacy policy here.