DOI:
10.1039/C6RA08359E
(Paper)
RSC Adv., 2016,
6, 46495-46507
Antimicrobial and osteogenic properties of iron-doped titanium†
Received
1st April 2016
, Accepted 3rd May 2016
First published on 4th May 2016
Abstract
Iron (Fe) was doped into the surface of pure titanium by iron plasma immersion ion implantation (Fe PIII), so that a nano-thick surface layer, composed of abundant reactive sites and capable of producing reactive oxygen species (ROS), was produced on the material. In vitro results demonstrated that the Fe PIII treated titanium was able to inhibit bacterial adhesion (E. coli and P. aeruginosa), but facilitate the adhesion, proliferation, and osteogenic differentiation of MC3T3-E1 and/or rBMSCs. The antibacterial efficacy of Fe PIII groups is likely determined by both the intrinsic potential of the materials in ROS generation and the availability of electrons supplied by respiration electron transport chains (ETC) in bacterial cells, which is important to the cytocompatibility of the materials. This study revealed that doping of iron can modify the electrochemical behavior of titanium and regulate its potential on production of ROS, which controls the selective nature of biomaterials in toxicity.
1 Introduction
Titanium and its alloys are promising options for load-bearing implants due to their appropriate mechanical properties as well as biocompatibility and corrosion resistance, which are mainly attributed to the relatively inert surface characteristics of the materials.1 However, what accompanies this inertness is that it tends to exhibit poor integration to bone tissues, and is challenged by bacterial contamination.2,3 Various antibiotics can be administrated to reduce the tendency of bacterial infections,4,5 whereas this paradigm likely gives rise to global antibiotic resistance and may undermine the osseointegration of the implants.6 In fact, many metallic elements and their oxides have been proved to contribute to disinfection or osteogenesis or even both.7–9 Previous studies demonstrated that these bactericidal activities are associated with the capability of initiating or accelerating the production of reactive oxygen species (ROS) such as hydroxyl radical (˙OH) which poses oxidative stress towards living cells.7 For metal oxide materials, a photogenerated ROS mechanism was mostly resorted to. The semiconducting materials can change their electron distributions in response to photons with energy above their band gaps, the consequently generated electron–hole pairs exhibited high reducing/oxidizing power. The electron can react with molecular oxygen to produce superoxide anion. The hole can attract electrons from water and/or hydroxyl ions to generate hydroxyl radicals. Furthermore, photodynamic therapy which when in the presence of oxygen can employs a photosensitizer (such as organic delocalized aromatic molecules, silica-based nanoparticles) to utilize low intensity visible light to produce cytotoxic ROS species.10–12 In other cases, metals can also undergo redox cycling to produce ROS, or deactivate antioxidant enzymes in physiology system. Hence, many transition metals or their oxides, such as cadmium, palladium, platinum, wolframium and silver are deliberately designed and served for antimicrobial purpose.13–18
However in the case of biomaterials applied in vivo, the actual situation was oblivious of any light. Moreover, using non-essential elements which cannot be mediated by human physiological system and possess protein dysfunction threat as well, should lead to safety concerns. On the other hand, iron (Fe), as an essential element for cellular metabolism in almost all organisms,19–22 has been reported to serve as a Fenton regent to facilitate the generation of ROS under limited light illumination.23 Accordingly, in this study, pure titanium was modified by using the iron plasma immersion ion implantation process (Fe PIII), so that an iron-doped layer was produced on titanium surface. And the antimicrobial and osteogenic activities of the iron-modified titanium were evaluated.
2 Experimental
2.1 Sample preparation
Commercially pure titanium plates (Cp Ti, grade 2) with size of 10 mm × 10 mm × 1 mm were used. The plates were mirror polished and ultrasonically cleaned with acetone and deionized water. Then the plates were transferred into chamber of a PIII system and cleaned for 15 min with a radio frequency argon plasma source at bias voltage of −550 V, serving as control group (denoted as Ti). For Fe PIII treatment, a pure metallic iron (99.99%) rod (10 mm in diameter) was used as cathode, at where iron was discharged by the main arc current between cathode and anode. A bias voltage of 30 kV with pulse duration of 450 μs and pulse frequency of 6 Hz was applied onto the as prepared Ti samples for 0.5, 1.0 and 1.5 hours and iron is implanted into them using a filtered cathodic arc plasma source (denoted as 0.5 h-Fe PIII, 1.0 h-Fe PIII and 1.5 h-Fe PIII respectively).
2.2 Surface structure and chemistry
The surface views of Ti and Fe PIII treated samples were observed by scanning electron microscopy (SEM) (FE-SEM, HITACHI, S-4800, Japan). The chemical states and elemental depth profiles were determined by X-ray photoelectron spectroscopy (XPS) (Physical electronics PHI 5802). The cross-section of Fe PIII treated sample was investigated by transmission electron microscopy (TEM) (FEI Tecnai G2 F20) together with the corresponding energy-dispersive X-ray spectroscopy images. The TEM specimens were thinned using a focused ion beam (FIB) system (FEI Helios). Contact angles of water droplets on the various surfaces were measured using a contact angle instrument (SL200B, Solon, China) according to the method used in the literature.24 The zeta potential was determined using a Surpass electro-kinetic analyzer (Anton Parr, Austria) according to the method used in the literature.25 UV-Vis absorption spectra of the samples were recorded using a UV-Vis spectrophotometer (Cary 300, Varian, USA). The intrinsic electron storage capability of sample Ti and Fe PIII treated ones were evaluated using photoluminescence spectra (PL, FluoroMax-4).
2.3 Iron release
The Fe PIII treated samples were immersed in normal saline solution under dark condition for 1, 4, 9, 14 and 72 days, then the elemental concentration of post immersion solution was measured using inductively coupled plasma/optical emission spectroscopy (ICP-OES; Vista AX, Varian, USA).
2.4 Electrochemical characteristics
All the electrochemical tests were performed using a typical three electrodes cell which consisting a sample (exposed area of 0.5 cm2) as working electrode, a graphite electrode as counter electrode and a saturated calomel electrode (SCE) as reference electrode. Normal saline solution was used as electrolyte in our work. Before performing electrochemical tests, all the samples were exposed to the solution medium for 4000 seconds to ensure a stable open circuit potential. Linear polarization tests were conducted over potential range of −2 V to 2 V vs. SCE employing a scan rate of 5 mV s−1. The corrosion parameter values were obtained from the Tafel extrapolation method. Electrochemical impedance spectroscopy (EIS) was conducted in the frequency range between 10−2 Hz and 105 Hz, applying a small perturbation AC signal with amplitude of ±5 mV. The obtained EIS data was analyzed by equivalent circuit modelling using ZRx Model software. The semiconducting properties of the sample Ti and Fe PIII treated ones were studied by Mott–Schottky analysis, which were performed under potential ranging from −3 V to 3 V vs. SCE with an interval of 0.05 V at frequency of 100 Hz. Cyclic voltammetry (CV) curves were acquired in normal saline under room temperature at a scanning rate of 10 mV min−1. The potential values will be converted with respect to standard hydrogen electrode (SHE) in the result and discussion section (potential vs. SHE = potential vs. SCE + 0.24 V).
2.5 Proliferation of MC3T3
AlamarBlue™ assay was performed to evaluate proliferation of MC3T3-E1 cells cultured on the samples. Briefly, MC3T3 cells were seeded at a density of 3 × 10⁴ cells per well. After cultured for 1, 4 and 7 days, the cells were incubated in a basal medium supplemented with 10% AlamarBlue (AbD Serotec Ltd, UK) for 4 h at 37 °C. Post reaction medium aliquots (100 μL) were transferred to 96-well plates and the absorbance values at 570 nm and 600 nm were recorded. The relative cell reduction was calculated according to the manufacturer's instruction. Besides the proliferation rate measurement, morphology of the cells at each measurement time point was also observed. After each culturing period, the specimens with cells were transferred into a new 24-well plate and rinsed with PBS twice, then fixed with 2.5% glutaraldehyde solution (pH = 7.4, Gibco, Invitrogen). Prior to SEM examination, the specimens were dehydrated in gradient ethanol solution (30, 50, 75, 90 and 95 v/v%) for 10 min each sequentially, then dehydrated in 100% ethanol for twice. Finally the specimens were dried in the hexamethyl disilazane ethanol solution series and observed by SEM.
2.6 Osteogenic behavior of rBMSCs
The rat bone mesenchymal stem cells (rBMSCs) (Stem Cell Bank, Chinese Academy of Sciences, Shanghai, China) with densities of 0.5 × 10⁴ cells per mL were cultured on different samples for 14 days and the extracellular matrix (ECM) mineralization, collagen (Coll) secretion, alkaline (ALP) phosphatase activity was investigated as follow. The cell culture process was similar to the process mentioned above except the culture medium (α-MEM) used here. For ECM measurement, the specimens with cells cultured for 14 days were then washed with PBS thrice, fixed in 75% ethanol for 1 h, and stained with 40 mM Alizarin Red for 10 min. Afterwards, the specimens were washed with distilled water until no red color can be seen. The stain was then dissolved in 10% cetylpyridinium chloride in 10 mM sodium phosphate. The OD values of absorbance at 600 nm were measured. Sirius Red staining was used to quantify the collagen secretion of cells cultured on different samples for 14 days. After 14 days of culture, the specimens were rinsed with PBS three times then fixed in 4% paraformaldehyde (PFA) for 20 min, followed by PBS rinsing for three times. And then they were stained in 0.1% Sirius Red solution (Sigma) in saturated picric acid for 18 h. The cells were washed with 0.1 M acetic acid until no more red color appeared. The stain was then dissolved in 0.5 mL of the distaining solution (0.2 M NaOH/methanol = 1/1 (v/v)). Then measure the OD values of absorbance at 570 nm. All the experiments were carried out in triplicate. Alkaline phosphatase activity assay was carried out according to the method described in the literature.25,26
2.7 Antibacterial tests
The antibacterial effect of samples against Escherichia coli ATCC 25922 (E. coli) and Pseudomonas aeruginosa ATCC 9027 (P. aeruginosa) was explored with respect to bacterial morphology, bacterial colony counting, propagation assay and live/dead viability test. The experiment procedures of each measurement were briefly described below. Additional antibacterial effect test against Staphylococcus aureus ATCC 25923 (S. aureus) was also conducted as described in supporting information. E. coli and P. aeruginosa were cultured using Luria–Bertani (LB) broth or LB agar plates. It should be noted that this culture medium were absent of iron element. The samples to be evaluated were sterilized through immersion in 75% alcohol solution for 120 min. Bacterial suspension of 60 μL with concentration of 107 cfu mL−1 was introduced onto sample surfaces. The samples with bacterial suspension were incubated at 37 °C for 24 hours under dark condition. For morphological observation via SEM, the specimens with bacteria cultured on through the aforementioned approach were fixed with 2.5% glutaraldehyde solution in a sodium cacodylate buffer (pH 7.4, Invitrogen) for 1 h at 4 °C, then dehydrated in the same procedure with MC3T3-E1 cell morphology observation. To evaluate the antibacterial effect, the specimens with bacterial suspension incubated for 24 hours were put into a test tube containing 5 mL normal saline solution. The test tube was vigorously vortexed for 90 seconds with the help of a vortex mixer to detach the bacteria from the sample surfaces. Subsequently, the suspension of detached bacteria was serially diluted in ten-fold steps with sterile normal saline. Then 100 μL of the diluted bacterial suspension was inoculated onto LB agar plates, incubated at 37 °C for 18 hours for colony comparison. AlamarBlue™ assay of bacterial propagation test after 24 hours culturing was conducted via the same procedure described above. A live/dead viability kit (L13152 BacLight Viability Kit, Invitrogen) was applied to determine the viability of bacteria after incubated on different samples for 24 hours under dark conditions. 500 μL of the fluorescent dye solution was added to the specimens and reacted in the dark for 15 min. Then the samples were turned over and placed on cover slips, and observed under fluorescent microscope (Olympus, Japan).
2.8 Measure the ROS level
The samples' different ROS inducing ability was examined by comparing hydroxyl level in solution through a fluorescence assay which had been introduced in previous researches.27 Briefly, samples were immersed in 5 mL pure terephthalic acid (PTA) solution (containing 5 mM PTA and 10 mM NaOH) in the dark at 37 °C for 5 days. The photoluminescence (PL) spectra of the resulting solution was then examined by the fluorescence spectrophotometer (HORIBA Jobin Yvon, France, Ex = 310 nm), in which the intensities were in respect to the hydroxyl levels in solution. As for intracellular ROS level, MC3T3 cells were introduced onto four groups of samples in 24-well plate. After cultured for 1 day, the cells were washed with 1× PBS for 3 times. Then, a mixture of 2′,7′-dichlorodihydrofluorescein diacetate (DCFH-DA, final concentration of 10 μg mL−1; Invitrogen, USA) solution were added to the specimens and stained for 30 min. The stained cells were observed using a fluorescent microscope (Olympus, Japan).
2.9 Statistical analysis
Statistically significant difference (P) between the various groups is measured using two-way analysis of variance and Tukey's multiple comparison tests while P values < 0.05 was considered statistically significant. All the data are processed by GraphPad Prism statistical software package and expressed as means ± standard deviation (SD).
3 Results
3.1 Surface characterization of the materials
The surface morphologies of pure titanium before and after being treated by iron plasma ion implantation for 0.5 h, 1.0 h, and 1.5 h (designated as Ti, 0.5 h-Fe PIII, 1.0 h-Fe PIII and 1.5 h-Fe PIII, respectively) were observed by scanning electron microscopy (SEM). As shown in Fig. 1, the original Ti group was flat in nano-scale, while the Fe PIII treated samples appeared nano-dots, which grew bigger with increasing duration of the Fe PIII treatment. Given that the maximum solubility of Fe in α-Ti was reported to be less than 0.05 at% (ref. 28) and the peak concentrations of iron in the Fe PIII groups were beyond this threshold (Fig. 2c), the aforementioned transformation in the surface topography of the titanium substrate can be ascribed to the interactions between the energetic iron plasma particles and Ti substrates which end up in partial nucleation into superficial grains.29 The surface composition of the Fe PIII treated samples were investigated by X-ray photoelectron spectroscopy (XPS). The valent state of iron (Fe) and titanium (Ti) at depths of 0 nm (the outermost surface), 20 nm and 40 nm on the Fe PIII groups was examined by XPS, and typical results of the 1.0 h-Fe PIII group were shown in Fig. 2a and b. In the case of Fe at a depth of 0 nm (Fig. 2(a-1)), the peaks of binding energy located at about 710 eV and 724 eV can be assigned to Fe2O3 or Fe3O4 (ref. 30–32) which is consistent with the previous report demonstrated that the passive film of iron usually resembles spinel Fe3O4 or defective γ-Fe2O3.33 At depths of 20 nm and 40 nm, the corresponding peaks of iron obviously shifted to 707 eV and 720 eV (Fig. 2(a-2 and 3)), which can be ascribed to the existence of zero valent iron.34 As to titanium, the binding energy peaks located at 459 eV and 464 eV (Fig. 2(b-1)) can be assigned to TiO2,35 and the peaks shifted to lower energies at depths of 20 nm and 40 nm (Fig. 2(b-2 and 3)), demonstrating the presence of zero valent titanium.36 The XPS spectra of oxygen (O 1s) at depths of 0 nm (the outermost surface) were presented in Fig. S1.† The spectra of binding energy located over a consistent region (529–532 eV) for all four groups of samples, representing the O atoms bound to metal atoms (Ti and/or Fe in this work) but varied in the proportion of each component. After undergoing Fe PIII, the atomic concentration distributions of Fe at different depths were displayed in Fig. 2c. Fe concentration resembled typical Gaussian distributions from depth of 20 nm to 100 nm and the peaks located at ca. 40 nm. Besides the main peaks, iron concentration of sample 0.5 h-Fe PIII and 1.0 h-Fe PIII exhibited smaller peaks (at ca. 20 nm) at outer side of the main peaks. The characteristic Gaussian distributions arose from the penetration effect of the plasma and can be predicted by one-dimensional plasma sheath model.37 During Fe PIII, a metallic iron rod was electrically ionized to produce iron ions (mainly Fe+ and Fe2+ (ref. 38)), which were accelerated by a negative bias (fixed at 30 kV in this study) and penetrated into the near surface of the titanium target. Since iron ions carrying different charges can acquire different kinetic energies and penetrate different depths in titanium surface, the major peak concentration of iron at ca. 40 nm (Fig. 2a) was likely resulted by Fe2+ ions, and the minor peak at ca. 10 nm was produced by Fe+ ions. As Fe PIII duration prolonged, the two peaks merged into one.
 |
| | Fig. 1 Surface views of the as-prepared Ti, 0.5 h-Fe PIII, 1.0 h-Fe PIII and 1.5 h-Fe PIII samples. | |
 |
| | Fig. 2 Fe 2p high-resolution XPS spectra of sample 1.0 h-Fe PIII obtained from apparent surface (a-1), 20 nm depth (a-2), 40 nm depth (a-3); Ti 2p high-resolution XPS spectra of sample 1.0 h-Fe PIII obtained from apparent surface (b-1), 20 nm depth (b-2), 40 nm depth (b-3); depth profiles of Fe (c); zeta potentials versus pH acquired from Ti and Fe PIII treated samples (d); Fe concentration in natural saline after immersion for 1, 4, 9, 14, 72 days (e). | |
The wetting property of the samples was investigated by measuring their water contact angles. After Fe PIII, the contact angle increases from ca. 75° degrees to ca. 95°, and all contact angles for the Fe PIII treated groups see a slight decrease as the samples were post-exposed to atmosphere for 12 weeks (Fig. S2†). The electrical charges on the surface of the samples were evaluated by tracing their changes in zeta potential. The results demonstrated that the zeta potentials for all the groups decrease as the pH values increase (Fig. 2d), and all the Fe PIII treated samples were more electro-negative than the titanium control over the physiological pH range (5.6 to 7.5). In addition, in this pH range, the 1.5 h-Fe PIII group was the most negative among the three Fe PIII groups. In aqueous systems, metal oxides can be hydrated to produce a hydroxylated layer on the materials. The shift in zeta potentials of the samples can be attributed to the abundant reactive surface sites produced by the doped-iron and its oxides, which tend to be highly hydroxylated.39 When the samples were immersed in aqueous solution for as long as 72 days, sample 1.0 h-Fe PIII released the largest amount of iron ions according to the result shown in Fig. 2e. In addition, iron releasing after 9 days of immersion was almost negligible.
The 1.5 h-Fe PIII sample was further examined by cross-sectional transmission electron microscopy (TEM). Small crystal regions can be identified by high-resolution transmission electron microscopy, and a typical image was shown in Fig. 3b. Fast Fourier Transformation (FTT) demonstrated that these small grains are likely pure iron (region A and C, PDF# 34-0529), Fe2O3 (region D, PDF# 33-0664), and compound of iron and titanium alloy (region B, PDF# 19-0636), respectively. The energy dispersive X-ray spectroscopy (EDX) mapping (Fig. 3c) acquired from a random area pictured in Fig. 3a further confirmed that Fe was introduced into the Ti substrate (Fig. 3-Fe). And the thickness of the oxidized layer was ca. 30 nm (Fig. 3-O) which apparently smaller than that of the iron-doped layer (ca. 45 nm).
 |
| | Fig. 3 Cross-sectional TEM analysis of the 1.5 h-Fe PIII group: HAADF image (a); HR-TEM image with the corresponding fast Fourier transform (FFT) patterns of the circled regions (b); EDX mapping of Fe, O and Ti (c). | |
3.2 Electrochemical behaviors and electronic structure
As demonstrated above (Fig. 1–3), Fe PIII treatment can produce nano crystal regions composed of iron or/and titanium, which can behave as semiconducting characteristics.40 Therefore, Mott–Schottky analysis was carried out to evaluate the electrochemical behaviors of the materials in a physiological solution. According to the Mott–Schottky theory, the relation between the capacitance and the applied potential is given by,| |
 | (1) |
where N represents the carrier concentration (donor or acceptor), ε the dielectric constant of the passive film, ε0 the vacuum permittivity, e the elementary charge, k the Boltzmann constant, T the absolute temperature and Efb the flat band potential. Fig. 4a depicts the C−2 vs. E plots of the four groups concerned in this study. The linear profile of the left parts for the plots indicates that the materials behave as n-type semiconductors; hence, the donor density (Nd) could be calculated and the Efb determined by extrapolating the linear part of the plots to C = 0. The data (Table 1) see a slight decrease in Efb for Fe PIII treated groups (about −0.46 V/SHE) as compared to the titanium control (about −0.40 V/SHE); and an increase in Nd for Fe PIII treated groups, i.e. the Nd for 0.5 h-Fe PIII, 1.0 h-Fe PIII, 1.5 h-Fe PIII, and Ti groups are 2.44 × 10¹⁸, 1.78 × 10¹⁸, 1.82 × 10¹⁸, and 1.14 × 10¹⁸, respectively. This semiconducting behavior is likely related to the titanium oxide (a classic n-type semiconductor) component in the Fe PIII produced layer on titanium (Fig. 3), and the source of shallow donor ionized at lower potential region is oxygen vacancy.41 As the potential is increased, a quadratic profile can be observed following each linear range for all the sample groups. This behavior is likely associated with the thickness of the semiconducting layer spontaneously formed as the samples exposing to atmosphere (Fig. 3), which can produce a space charge region (SCL) that surpass the semiconducting regions as the potential increased.42–44 Therefore, the minority carriers (the holes in this study) became more abundant as revealed by the quadratic profile of M–S plots (Fig. 5a).45,46
 |
| | Fig. 4 Mott–Schottky plots of Ti and Fe PIII samples (a); UV-vis absorption spectrum measurements (dashed lines) and photoluminescence spectra (solid lines) of Ti and Fe PIII samples, λEx = 345 nm (b); admittance diagrams of measured impedance spectra acquired from Ti and Fe PIII samples and the equivalent circuit of each sample were inserted respectively (c). | |
Table 1 Flat band potential (Efb) and donor concentration (Nq) values for all samples
| Samples |
Nd (cm−3) |
Efb (V vs. SHE) |
| Ti |
1.14 × 10¹⁸ |
−0.40 |
| 0.5 h-Fe PIII |
2.44 × 10¹⁸ |
−0.46 |
| 1.0 h-Fe PIII |
1.78 × 10¹⁸ |
−0.46 |
| 1.5 h-Fe PIII |
1.82 × 10¹⁸ |
−0.45 |
 |
| | Fig. 5 Cyclic voltammetry curves of Ti and the Fe PIII samples (a); fluorescence assay of the hydroxyl radical degree in normal saline under dark condition (b). | |
UV-vis absorption and photoluminescence (PL) spectra of our samples were shown in Fig. 4b. The UV-vis absorption of sample 0.5 h-Fe PIII was enhanced in comparison to sample Ti, but those of the 1.0 h and 1.5 h-Fe PIII samples decreased to below Ti. As for PL measurement, the samples gave consistent emission band around 400 nm (3.1 eV) which suggested that the recombination occurred mainly in the titanium oxide component. The PL spectra intensity of 0.5 h-Fe PIII was close to that of Ti while that of 1.0 Fe-PIII and 1.5 h-Fe PIII were distinctly increased and reduced respectively. The medium PL emission in combination with strong absorption from sample 0.5 h-Fe PIII was of special interest for charge separation. The recombination process of separated charges was mediated by surface states and oxygen vacancies which were resulted from disordered crystalline surface.47,48 Fe PIII treatment 1.0 h and 1.5 h produced modification layers with fewer defects according to the fitting result of Nd listed in Table 1. Therefore, the enhancement of PL intensity of 1.0 h-Fe PIII was ascribed to the passivation of surface states which diminishes the recombination centers of photo-generated carriers.
EIS analysis was conducted to further examine the effect Fe PIII had on the electronic structure of the materials. The equivalent circuits for each sample shown in Fig. 4c were adapted from previous reports.49–51 Generally, the Ti and Fe PIII groups had similar equivalent circuits, which can be divided into two branches. The R1 (C1R2) branch represents the resistance of solution and the charge-layer adjacent to the sample surfaces, and the Q1(C2R3Q2) branch (that of Ti was in the form of C2R3Q2) relates to the presence of interface states in the surface of the samples. Constant phase elements (Q1 and Q2) were used to model non-ideal capacitors of the samples, and the specific values of elements in a circuit can be determined by fitting the plots in the frequency range of 10−2 to 105 Hz (Table 2). Although the R1(C1R2) branches were generally identical among the four groups, the R3 values for the Fe PIII treated samples significantly decreased as compared to the Ti control, suggesting that the electron transfer rates in Fe PIII treated samples are faster than that in Ti group. The 0.5 h-Fe PIII and 1.0 h-Fe PIII groups saw a higher C2 values in comparison to that of Ti group, demonstrating that double layer capacitance of the former groups is higher than the latter one, which is likely related to the presence of reactive sites because of charge storage.52,53
Table 2 Various electrical parameter values obtained from equivalent circuit fitting of the EIS data for different samples (the equivalent circuit is: R(CR)Q(CRQ))
| Samples |
R1 (Ω cm2) |
C1 (×10−6) |
R2 (Ω cm2) |
Q1 |
n1 |
C2 |
R3 (Ω cm2) |
Q2 (×10−4) |
n2 |
| Ti |
7.90 |
4.08 |
27.51 |
|
|
1.03 × 10⁻¹¹ |
3.68 × 10⁴ |
1.09 |
0.72 |
| 0.5 h-Fe PIII |
8.89 |
4.92 |
20.63 |
6.47 × 10⁻⁵ |
0.82 |
1.76 × 10⁻¹⁰ |
150.1 |
0.99 |
0.81 |
| 1.0 h-Fe PIII |
8.87 |
4.11 |
22.20 |
5.44 × 10⁻⁵ |
0.86 |
4.08 × 10⁻⁶ |
712 |
1.72 |
0.67 |
| 1.5 h-Fe PIII |
8.55 |
3.90 |
22.42 |
6.07 × 10⁻⁵ |
0.86 |
8.07 × 10⁻²⁰ |
249.2 |
1.47 |
0.72 |
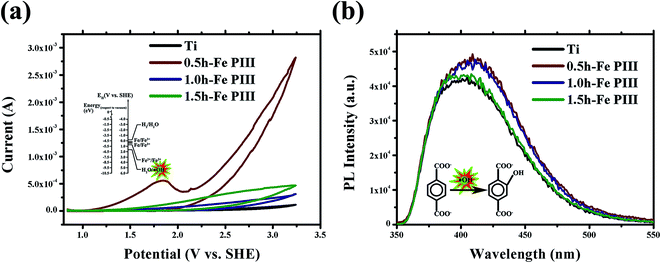
The surface reactivity of the samples was evaluated in normal saline by using cyclic voltammograms (CV). In the potential range studied, only one peak at ca. 1.8 V/SHE (Fig. 5a) was observed in 0.5 h-Fe PIII group during the first anodic scan. The peak can be assigned to the following reaction,
| | |
2H2O ↔ H2O2 + 2H+ + 2e−
| (2) |
There is no any cathodic peak detected by CV, indicating that the reaction was not completely reduced. Furthermore, the hydroxyl radicals (˙OH) production in normal saline solution without applying any bias potential was measured under dark condition. The results demonstrated that all the Fe PIII groups can generate more hydroxyl radicals than Ti (Fig. 5b), and the 0.5 h-Fe PIII group is better than the other two PIII-treated groups. These results indicate that Fe PIII for 0.5 h can endow a titanium surface with abundant reactive sites consequently facilitating the generation of ROS in the dark.
The corrosion behaviors of the samples were evaluated by measuring their Tafel plots. The corrosion potential (Ecorr) and corrosion current (Icorr) for Ti group were −0.405 V/SHE and 1.801 × 10⁻⁶ A cm−2, respectively (Fig. 6 and Table 3). The Ecorr values for the Fe PIII groups were more positive than that of the Ti control, indicating that Fe PIII does not deteriorate the corrosion property of titanium. The test result of iron ion releasing shown in Fig. 2e was generally in accordance with the Tafel result.
 |
| | Fig. 6 Potential dynamic polarization behavior of Ti, 0.5 h-Fe PIII, 1.0 h-Fe PIII and 1.5 h-Fe PIII samples in natural saline (0.9% NaCl solution). | |
Table 3 Parameters of potentiodynamic polarization curves of various samples
| Samples |
Ecorr (V vs. SHE) |
Icorr (A cm−2) |
| Ti |
−0.405 |
1.801 × 10⁻⁶ |
| 0.5 h-Fe PIII |
0.306 |
0.332 × 10⁻⁶ |
| 1.0 h-Fe PIII |
−0.295 |
0.853 × 10⁻⁶ |
| 1.5 h-Fe PIII |
−0.287 |
1.147 × 10⁻⁶ |
3.3 Antibacterial activity
According to the SEM observation of bacterial cells cultured on the samples for 24 h, the cell membrane of E. coli strain cultured on Ti was intact without apparent damage and so was those cultured on the Fe PIII treated samples. Intercellular tubes (green arrows) can be detected on all the groups which indicated that the state of E. coli strain cells was good. In the case of P. aeruginosa, the cells on 0.5 h and 1.0 h-Fe PIII groups present obvious shrunk and distorted shapes (pointed out by red arrows).
For E. coli strain, continuous bacteria colonies were prevalent on the agar culture medium, implying that E. coli cells survived on the Fe PIII treated samples. In regard to P. aeruginosa strain, there were significant decrease in bacteria colonies, indicating that the P. aeruginosa cells survived poorly on the Fe PIII treated samples, especially the 0.5 h-Fe PIII and 1.0 h-Fe PIII. Inactivation rate obtained from colonial plates was presented in Fig. 7c. Fe PIII treated samples showed effective inhibition towards P. aeruginosa strain, the maximum inactivation rate is ca. 80% on 0.5 h-Fe PIII. On the contrary, E. coli strain cultured on the Fe PIII treated samples was not suppressed according the results. Fluorescence staining was also used to verify the antibacterial effect of Fe PIII treated samples towards different bacteria strains, and the results were shown in Fig. 8. For E. coli strain, there are slightly less living cells (green ones) found on Fe PIII treated samples while scant dead cells (red ones) can be seen. However, the amount of dead P. aeruginosa cells is evidently larger on the Fe PIII treated samples. The decrease of living cell attachment was resulted from the electrostatic repulsion between the negatively charge sample surface and the also negatively charged bacteria cells (ζP. aeruginosa = −14.4 ± 0.7 mV; ζE. coli = −38.4 ± 0.3 mV).54 AlarmaBlue assay also confirmed that Fe PIII treated samples was able to suppress P. aeruginosa strain more effectively than E. coli strain as shown in Fig. S3.†
 |
| | Fig. 7 SEM morphology of the bacterium cells cultured on Ti, 0.5 h-Fe PIII, 1.0 h-Fe PIII and 1.5 h-Fe PIII samples (a); photos of re-cultivated bacterial colonies on agar (b) and reduction percentage of each bacteria strain cultured on Fe PIII samples (c). | |
 |
| | Fig. 8 Microscopic images of BacLight live/dead staining of E. coli and P. aeruginosa lived on Ti, 0.5-Fe PIII, 1.0 h-Fe PIII and 1.5 h-Fe PIII samples. | |
3.4 Responses of bone cells
In this work, we used MC3T3-E1 cells to examine a general requirement for hard-tissue implants which is the ability of maintaining osteoblast cell proliferation. Then, a tentative examination was made additionally to see whether the differentiation of rBMSCs cultured on our samples was desirable. The results were demonstrated below. The morphology of the MC3T3-E1 cells cultured for 1, 4, and 7 days on the Ti and Fe PIII treated samples was displayed in Fig. 9a. A larger amount of cells adhered onto Fe PIII treated samples after 1 day cultivation, and so was the situation after 4 days cultivation. When cultured for 1 day, most of the cells on the Fe PIII treated samples greatly spread and revealed larger number of filopodia. When cultured for 4 days, clustered osteoblasts had fully covered the surface of Fe PIII treated samples while Ti surface was only partly covered. After being cultured for 7 days, compact cellular layers were seen on 0.5 h and 1.0 h-Fe PIII samples. According to the quantitative evaluation of the MC3T3-E1 cell proliferation through AlamarBlue assay (Fig. 9b), 0.5 h and 1.0 h-Fe PIII samples were affirmably able to promote cell proliferation, and the 1.5 h-Fe PIII didn't show negative effect towards the cells. The production of ROS within MC3T3-E1 cells cultured on our samples for 6 hours was observed by fluorescence microscope as shown in Fig. 9c. Cells cultured on Fe PIII treated samples were glowing with bright fluorescent while that cultured on Ti were rather dim. Furthermore, larger number of luminous cell was distinguished on Fe PIII treated samples. Basing on previous researches which had demonstrated that mitochondrial production of ROS in osteoclast and osteoblast cells was induced by iron transferring,55 we believed that iron releasing from the modification layers possibly resulted in this higher level of intracellular ROS production in our work.
 |
| | Fig. 9 SEM morphology of the MC3T3 cells cultured on various surfaces after 1, 4, 7 days (a); reduction percentage of AlamarBlue for MC3T3 cells cultured on Ti and Fe PIII samples for different duration (1, 4 and 7 day) (b); microscopic images of ROS staining of MC3T3 cells cultured on different samples for 6 hours (c). | |
Besides playing a role in antibacterial effect, ROS also had great influence on animal cells living status and stem cells differentiating directions. The rBMSCs cultured on Ti and Fe PIII treated samples for 14 days were stained by Alizarin Red as shown in Fig. 10(a-1). The Fe PIII treated sample surfaces exhibited significantly enhanced matrix mineralization. From the corresponding colorimetrically qualitative result, it was confirmed that sample 1.0 h-Fe PIII and 1.5 h-Fe PIII exhibited up-regulated extracellular matrix mineralization. Collagen secretion evaluation by Sirius Red staining (Fig. 10(b-1)) showed similar result that more collagen was secreted on the Fe PIII treated samples than on Ti. Colorimetrically qualitative result confirmed that sample 0.5 h-Fe PIII was able to effectively up-regulate collagen secretion of rBMSCs. The alkaline phosphatase activity was measured by dissociating the rBMSCs off the surfaces and incubated with p-nitrophenylphosphate at 37 °C for 30 min and observed and quantified, as shown in Fig. 10c. Alkaline phosphatase activity of cells living on 1.0 h-Fe PIII and 1.5 h-Fe PIII for 14 days was promoted while that on 0.5 h-Fe PIII was generally flat. The above results confirmed that Fe PIII treated samples induced higher ROS production within the cells while were also able to enhance cell adherence and proliferation of bone cells.
 |
| | Fig. 10 Matrix mineralization of rBMSCs cultured on various samples for 14 days and the qualitative result (a-1, 2); collagen secretion of rBMSCs cultured on various surfaces for 14 days and the qualitative result (b-1, 2); ALP activity of rBMSCs cultured on various surfaces for 14 days and the qualitative result (c-1, 2). | |
4 Discussion
In this study, pure titanium was surface-modified by a one-step iron plasma immersion ion implantation (Fe PIII) process, so that a nano-thick iron-doped layer was produced on the material. The Fe PIII treated titanium was able to inhibit bacterial adhesion (E. coli and P. aeruginosa), but facilitate the proliferation of MC3T3-E1 and the osteogenic differentiation of rBMSCs.
The iron-doped layers consist of iron oxide, zero-valent iron, titanium oxide, and zero-valent titanium (Fig. 1–3), which provide the titanium substrates of abundant reactive sites capable of regulating the electrochemical properties of the materials in aqueous solution (Fig. 4–6). It has been reported that water adsorption displays a greater diversity of adsorption state on a Fe3+/TiO2 system in comparison to pure TiO2.56 The existence of such adsorption states and surface hydroxyl groups was considered to be a prerequisite for a surface having appreciable activity for production of ROS.56 As a result, the defect-abundant oxidation layer formed on Fe PIII treated titanium, when immersed in aqueous solution, likely facilitates producing proper amount of hydroxyl radicals according to the following reactions with water and oxygen (dissolved),23,57
| | |
2H2O ↔ H2O2 + 2H+ + 2e−
| (2) |
| | |
Fe2+ + H2O2 ↔ Fe3+ + ˙OH + OH−
| (3) |
| | |
H2O + Os− ↔ ˙OH + OHs−
| (4) |
where the subscript “s” refers to surface species. This inference was evidenced by the enhanced generation of ROS by the Fe PIII treated groups under dark condition (without light illumination,
Fig. 5b).
The Fe PIII treated titanium was able to act against bacterial adhesion, whereas its reduction efficacy to E. coli strain is apparently different to that of P. aeruginosa strain, i.e. the material is more harmful to the latter strain than to the former one (Fig. 7 and 8). It was reported that bacteria respiration is an oxidation process that released electrons via electron transport chains (ETC) located at bacterial membranes and further influenced by the types of electron acceptor available. As sketched in Fig. 11, the anaerobic respiration ETC in E. coli (a Gram-negative strain) is confined to the intracellular routs by using NO3−/SO4− as the electron acceptors (route i in Fig. 11), whereas the P. aeruginosa (also a Gram-negative strain) possess extracellular ETC pathways (route ii in Fig. 11), which is sensitive to the redox property of the materials they adhere to. That is to say, P. aeruginosa was more potent than E. coli in reducing the iron oxide in the Fe PIII groups to produce iron ions that are able to trigger reaction (4), subjecting to enhanced ROS production and answered for the different responses of the two bacterial strains (E. coli and P. aeruginosa) to the same materials. In addition, the samples responses towards S. aureus strain (a Gram-positive strain), the ETC of which is also confined to the intracellular routs, was conducted and the results were showed in Fig. S4.† The Fe PIII treated samples didn't show bactericidal effect towards S. aureus, the same as in the case of E. coli strain. Furthermore, the activity of the Fe PIII groups against P. aeruginosa strain was highly related to the generation kinetics of ROS of the materials. The 0.5 h-Fe PIII and 1.0 h-Fe PIII groups can generate much more ROS than the 1.5 h-Fe PIII groups (Fig. 5b), hence antibacterial efficacy of the former groups was better than the latter one (Fig. 9). As aforementioned, abundant reactive sites can be produced on titanium by Fe PIII treatment, this claim was evidenced by the photoluminescence (PL) spectra (Fig. 4b). From this point of view, the antibacterial efficacy of Fe PIII groups is determined by both the intrinsic potential of the materials in ROS generation and the availability of electrons supplied by respiration ETC in bacterial cells.
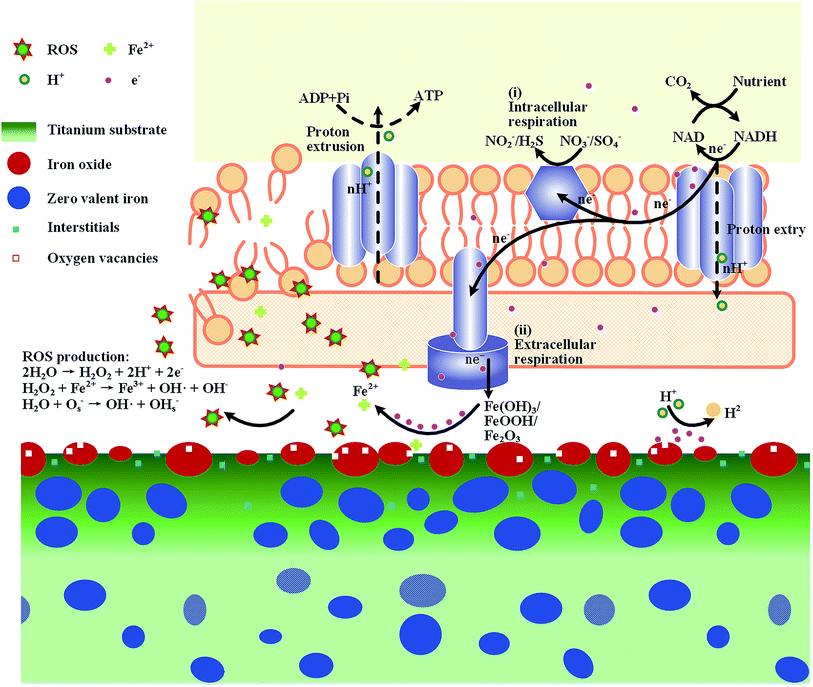 |
| | Fig. 11 An illustration of the modification layers and their interactions with bacterial cells. | |
The important thing is that the ROS generated by Fe PIII groups does no harm to the functions (adhesion, proliferation, osteogenic differentiation) of MC3T3-E1 and rBMSC. Interestingly, enhanced osteogenic property of the Fe PIII groups was evidenced in the present study (Fig. 9 and 10). There were many studies demonstrated that a proper level of ROS is critical for cell function maintenance,55,58 and the intrinsic ROS level generated by Fe PIII treated samples may meet this condition. In addition, the structural difference in bacterial and mammalian cells may also contribute to the selective performance of Fe PIII groups. Eukaryotic cells are normally much bigger than prokaryotic cells. Moreover, although similar electron transport chains (ETC) can also be found on mitochondria in eukaryotic cells, it is membrane-bounded into a more complex endomembrane system different from that of prokaryotic cells.15 Hence, the intrinsic potential of the Fe PIII groups in ROS generation does no harm to mammalian cells but enhances the adhesion, proliferation, and osteogenic differentiation in MC3T3-E1 and/or rBMSC.
5 Conclusions
Iron (Fe) was incorporated onto titanium surface by a one-step iron plasma immersion ion implantation (Fe PIII) process. Nano-grains of iron were precipitated on and underneath the titanium surface via local nucleation process and undergone spontaneous oxidation in atmosphere. The iron-doped layer provide titanium (Fe PIII groups) of antibacterial activity, which is determined by both the intrinsic potential of the materials in ROS generation and the availability of electrons supplied by respiration ETC in bacterial membrane. Due to the structural differences between microbes and mammalian cells, the intrinsic ROS level generated by Fe PIII groups does no harm to the adhesion, proliferation, and osteogenic differentiation in MC3T3-E1 and/or rBMSC.
Acknowledgements
Financial support from the National Basic Research Program of China (973 Program, 2012CB933600), National Science Fund for Distinguished Young Scholars (51525207), National Natural Science Foundation of China (31570973, 31370962), Shanghai Committee of Science and Technology, China (15441904900, 14XD1403900), and Shanghai Rising-Star Program (15QA1404100) are acknowledged.
References
- M. Geetha, A. K. Singh, R. Asokamani and A. K. Gogia, Prog. Mater. Sci., 2009, 54, 397 CrossRef CAS
 .
. - X. Liu, P. Chu and C. Ding, Mater. Sci. Eng., R, 2004, 47, 49 CrossRef .
- E. Taylor and T. J. Webster, Int. J. Nanomed., 2011, 6, 1463 CrossRef CAS PubMed .
- A. Montali, Injury, 2006, 37, 81 CrossRef PubMed .
- M. Kazemzadeh-Narbat, J. Kindrachuk, K. Duan, H. Jenssen, R. E. Hancock and R. Wang, Biomaterials, 2010, 31, 9519 CrossRef CAS PubMed .
- M. Ferraz, F. Monteiro, A. Serro, B. Saramago, I. Gibson and J. Santos, Biomaterials, 2001, 22, 3105 CrossRef CAS PubMed .
- J. A. Lemire, J. J. Harrison and R. J. Turner, Nat. Rev. Microbiol., 2013, 11, 371 CrossRef CAS PubMed .
- L. Yang, S. Perez-Amodio, F. Y. Barrere-de Groot, V. Everts, C. A. van Blitterswijk and P. Habibovic, Biomaterials, 2010, 31, 2976 CrossRef CAS PubMed .
- Y. Qiao, W. Zhang, P. Tian, F. Meng, H. Zhu, X. Jiang, X. Liu and P. K. Chu, Biomaterials, 2014, 35, 6882 CrossRef CAS PubMed .
- B. Jayeeta, K. M. Amit, B. Avik, C. Yusuf and C. B. Uttam, Nano Res., 2015, 8, 1373 CrossRef .
- G. St. D. Tyler, D. Tianhong, I. Leonid, A. Christos, R. A. Richard, R. H. Michael and P. T. George, Virulence, 2011, 2, 509 CrossRef PubMed .
- T. Nicole, S. Andreas and P. Kristjan, Photochem. Photobiol. Sci., 2014, 13, 1402 Search PubMed .
- T. Tatsuma, S. Takeda, S. Saitoh, Y. Ohko and A. Fujishima, Electrochem. Commun., 2003, 5, 793 CrossRef CAS .
- P. V. Kamat, J. Phys. Chem. Lett., 2012, 3, 663 CrossRef CAS PubMed .
- L.-C. Jiang, W.-D. Zhang, Y.-X. Yu and J. Wang, Electrochem. Commun., 2011, 13, 627 CrossRef CAS .
- V. Chakrapani, K. Tvrdy and P. V. Kamat, J. Am. Chem. Soc., 2010, 132, 1228 CrossRef CAS PubMed .
- P. Wu, J. A. Imlay and J. K. Shang, Biomaterials, 2010, 31, 7526 CrossRef CAS PubMed .
- H. Cao, X. Liu, F. Meng and P. K. Chu, Biomaterials, 2011, 32, 693 CrossRef CAS PubMed .
- C. D. Kaplan and J. Kaplan, Chem. Rev., 2009, 109, 4536 CrossRef CAS PubMed .
- J. Laskey, I. Webb, H. M. Schulman and P. Ponka, Exp. Cell Res., 1988, 176, 87 CrossRef CAS PubMed .
- N. Terada, R. Or, A. Szepesi, J. J. Lucas and E. W. Gelfand, Exp. Cell Res., 1993, 204, 260 CrossRef CAS PubMed .
- E. C. Theil and D. J. Goss, Chem. Rev., 2009, 109, 4568 CrossRef CAS PubMed .
- E. Neyens and J. Baeyens, J. Hazard. Mater., 2003, 98, 33 CrossRef CAS PubMed .
- J. Li, X. Liu, Y. Qiao, H. Zhu, J. Li, T. Cui and C. Ding, RSC Adv., 2013, 3, 112 Search PubMed .
- G. Jin, Y. Qin, H. Cao, S. Qian, Y. Zhao, X. Peng, X. Zhang, X. Liu and P. K. Chu, Biomaterials, 2014, 35, 7699 CrossRef CAS PubMed .
- G. Jin, H. Cao, Y. Qiao, F. Meng, H. Zhu and X. Liu, Colloids Surf., B, 2014, 117, 158 CrossRef CAS PubMed .
- Y. Zhao, Y. Zhu, J. Fu and L. Wang, Chem.–Asian J., 2014, 9, 790 CrossRef CAS PubMed .
- J. L. Murray, Bull. Alloy Phase Diagrams, 1981, 2, 320 CrossRef .
- J. W. Christian, The theory of transformations in metals and alloys (part I + II), Newnes, 2002 Search PubMed .
- B. J. Tan, K. J. Klabunde and P. M. Sherwood, Chem. Mater., 1990, 2, 186 CrossRef CAS .
- D. D. Hawn and B. M. DeKoven, Surf. Interface Anal., 1987, 10, 63 CrossRef CAS .
- T. Yamashita and P. Hayes, Appl. Surf. Sci., 2008, 254, 2441 CrossRef CAS .
- M. F. Toney, A. J. Davenport, L. J. Oblonsky, M. P. Ryan and C. M. Vitus, Phys. Rev. Lett., 1997, 79, 4282 CrossRef CAS .
- D. J. Joyner, O. Johnson and D. M. Hercules, J. Am. Chem. Soc., 1980, 102, 1910 CrossRef CAS .
- J.-H. Yun, R. J. Wong, Y. H. Ng, A. Du and R. Amal, RSC Adv., 2012, 2, 8164 RSC .
- B. Siemensmeyer, K. Bade and J. W. Schultze, Ber. Bunsenges. Phys. Chem., 1991, 95, 1461 CrossRef CAS .
- V. Vahedi, M. Lieberman, M. V. Alves, J. Verboncoeur and C. Birdsall, J. Appl. Phys., 1991, 69, 2008 CrossRef CAS .
- A. Anders, Appl. Phys. Lett., 2002, 80, 1100 CrossRef CAS .
- M. Erdemoğlu and M. Sarıkaya, J. Colloid Interface Sci., 2006, 300, 795 CrossRef PubMed .
- I. Diez-Perez, F. Sanz and P. Gorostiza, Electrochem. Commun., 2006, 8, 1595 CrossRef CAS .
- T. L. Thompson and J. T. Yates, Top. Catal., 2005, 35, 197 CrossRef CAS .
- E. Sikora and D. D. Macdonald, J. Electrochem. Soc., 2000, 147, 4087 CrossRef CAS .
- I. Dıez-Pérez, P. Gorostiza and F. Sanz, J. Electrochem. Soc., 2003, 150, B348 CrossRef .
- A. Stepanov, Rev. Adv. Mater. Sci., 2012, 30, 150 CAS .
- S. R. Morrison, Electrochemistry at semiconductor and oxidized metal electrodes, Plenum Press, New York, 1980 Search PubMed .
- I. Díez-Pérez, C. Vericat, P. Gorostiza and F. Sanz, Electrochem. Commun., 2006, 8, 627 CrossRef .
- M. Zhang, W. Luo, N. Zhang, Z. Li, T. Yu and Z. Zou, Electrochem. Commun., 2012, 23, 41 CrossRef CAS .
- I. Cesar, K. Sivula, A. Kay, R. Zboril and M. Graetzel, J. Phys. Chem. C, 2009, 113, 772 CAS .
- N. Yang, J. Zhai, D. Wang, Y. Chen and L. Jiang, ACS Nano, 2010, 4, 887 CrossRef CAS PubMed .
- P. J. Cameron and L. M. Peter, J. Phys. Chem. B, 2003, 107, 14394 CrossRef CAS .
- P. K. Chu, Thin Solid Films, 2013, 528, 93 CrossRef CAS .
- X. Peng, H. Yu, X. Wang, N. Gao, L. Geng and L. Ai, J. Power Sources, 2013, 223, 94 CrossRef CAS .
- S. Jung, Y.-H. Ahn, S.-E. Oh, J. Lee, K. T. Cho, Y. Kim, M. W. Kim, J. Shim and M. Kang, Bull. Korean Chem. Soc., 2012, 33, 3349 CrossRef CAS .
- V. K. Truong, S. Rundell, R. Lapovok, Y. Estrin, J. Y. Wang, C. C. Berndt, D. G. Barnes, C. J. Fluke, R. J. Crawford and E. P. Ivanova, Appl. Microbiol. Biotechnol., 2009, 83, 925 CrossRef CAS PubMed .
- G. D. Roodman, Cell Metab., 2009, 9, 405 CrossRef CAS PubMed .
- J. A. Navio, M. Macias, M. Gonzalez-Catalan and A. Justo, J. Mater. Sci., 1992, 27, 3036 CrossRef CAS .
- K. B. Hewett, L. C. Anderson, M. P. Rosynek and J. H. Lunsford, J. Am. Chem. Soc., 1996, 118, 6992 CrossRef CAS .
- A. Sena Laura and S. Chandel Navdeep, Mol. Cell, 2012, 48, 158 CrossRef CAS PubMed .
Footnote |
| † Electronic supplementary information (ESI) available. See DOI: 10.1039/c6ra08359e |
|
| This journal is © The Royal Society of Chemistry 2016 |
Click here to see how this site uses Cookies. View our privacy policy here. 


