DOI:
10.1039/C6RA08311K
(Paper)
RSC Adv., 2016,
6, 55307-55311
Optical temperature sensing in β-NaLuF4:Yb3+/Er3+/Tm3+ based on thermal, quasi-thermal and non-thermal coupling levels
Received
31st March 2016
, Accepted 27th May 2016
First published on 31st May 2016
Abstract
Three methods for optical temperature sensing are investigated in the NaLuF4:Yb3+/Er3+/Tm3+ phosphor, which is prepared by a hydrothermal method. The temperature-dependent luminescence is investigated under 980 nm excitation. Utilizing fluorescence intensity ratio (FIR) technique, the temperature sensing behaviors are studied in the range of 300–600 K based on thermal coupling levels (2H11/2 and 4S3/2 of Er3+), “quasi-thermal coupling levels” (4F7/2 of Er3+ and 3F2 of Tm3+) and non-thermal coupling levels (1D2 and 1G4 of Tm3+), respectively. The maximum sensitivity is 604 × 10−4 K−1 at 300 K, which is based on non-thermal coupling levels of Tm3+. Meanwhile, the temperature dependent emission colors are discussed, which are changed from bluish green to light blue with the temperature rising. These significant results, high sensitivity and the temperature dependent multicolor emissions, indicate that the NaLuF4:Yb3+/Er3+/Tm3+ phosphor is robust for optical temperature sensing.
1. Introduction
Trivalent rare earth (RE3+) doped upconversion (UC) materials are extensively investigated because of their attractive applications, such as in display devices, remote temperature sensors, cell imaging, biomedical diagnostics and therapeutics.1–6 Their unique optical characters arise from their intra-4f transitions which are allowed due to the mixing of configurations having opposite parity.7–9 Generally, the abundant 4FN electronic states lead to multicolor emission, which is tunable from ultraviolet (UV) to NIR.10–14 Under near-infrared (NIR) excitation, RE3+ doped host materials can emit visible light through two-photon or multi-photon processes.15–18 Up to now, NaLuF4 has been known as one of the most excellent host material due to low phonon energy and highly luminescent efficiency.19,20
Temperature is a significant parameter for both scientific and industrial fields, thus, high accuracy and high sensitivity temperature measurement is crucial. FIR technique, based on measurement of luminescent intensities from two thermal coupling levels of RE ions, can realize accurate measurement, because it is independent of spectrum losses and fluctuations of exciting intensity.21–24 The energy gap between these two thermal coupling levels should be in the range of 200–2000 cm−1. Generally, the larger the energy gap is the higher sensor sensitivity. Therefore, further enhancement of the sensing sensitivity is a challenge due to the restriction of the energy gap between the thermal coupling levels. Therefore, improving the sensitivity is urgently needed, and lots of researches are reported, such as the SPR method,25 organic molecules modification,26,27 core–shell structure28–30 and the non rare earth ions doped method,31–34 and so on. These methods are based on thermal coupling levels of RE3+. Heretofore, few results on optical thermometry have been reported mainly concerning the non-thermal coupling levels of RE3+.
Herein, we report a strategy to enhance the sensitivity of optical thermometer, based on non-thermal coupling levels. The NaLuF4:Yb3+/Er3+/Tm3+ phosphor is prepared by hydrothermal method. According to FIR technique, the temperature sensing behaviors are studied based on three pairs of levels (thermal coupling levels (2H11/2 and 4S3/2 of Er3+), “quasi-thermal coupling levels” (4F7/2 of Er3+ and 3F2 of Tm3+) and non-thermal coupling levels (1D2 and 1G4 of Tm3+)), respectively. Meanwhile, multicolor emission in the visible region was discussed in detail at different temperature.
2. Experimental
The OA-capped NaLuF4:20%Yb3+/2%Er3+/1%Tm3+ phosphor was synthesized by a hydrothermal method. In a typical procedure, 18 mL OA was slowly added into the 12 mL methanol solution containing NaOH (15 mmol). The solution was magnetically stirred for 30 min at room temperature. Then, 6 mL deionized water solution of 1 mmol of RE(NO3)3 (Lu3+![[thin space (1/6-em)]](https://www.rsc.org/images/entities/char_2009.gif) :
:![[thin space (1/6-em)]](https://www.rsc.org/images/entities/char_2009.gif) Yb3+
Yb3+![[thin space (1/6-em)]](https://www.rsc.org/images/entities/char_2009.gif) :
:![[thin space (1/6-em)]](https://www.rsc.org/images/entities/char_2009.gif) Er3+
Er3+![[thin space (1/6-em)]](https://www.rsc.org/images/entities/char_2009.gif) :
:![[thin space (1/6-em)]](https://www.rsc.org/images/entities/char_2009.gif) Tm3+ = 79
Tm3+ = 79![[thin space (1/6-em)]](https://www.rsc.org/images/entities/char_2009.gif) :
:![[thin space (1/6-em)]](https://www.rsc.org/images/entities/char_2009.gif) 18
18![[thin space (1/6-em)]](https://www.rsc.org/images/entities/char_2009.gif) :
:![[thin space (1/6-em)]](https://www.rsc.org/images/entities/char_2009.gif) 2
2![[thin space (1/6-em)]](https://www.rsc.org/images/entities/char_2009.gif) :
:![[thin space (1/6-em)]](https://www.rsc.org/images/entities/char_2009.gif) 1) was added to the above mixture and stirred for another 30 min. A 6 mL solution of NH4F (5 mmol) was added to the resultant solution to form a colloidal suspension. Then, the above solution was moved into a autoclave and kept at 180 °C for 12 h. The resultant product was collected by centrifugation (5 min, 8000 rpm). Finally, the product is washed with ethanol, deionized water and cyclohexane several times, and dried at 60 °C for 2 h.
1) was added to the above mixture and stirred for another 30 min. A 6 mL solution of NH4F (5 mmol) was added to the resultant solution to form a colloidal suspension. Then, the above solution was moved into a autoclave and kept at 180 °C for 12 h. The resultant product was collected by centrifugation (5 min, 8000 rpm). Finally, the product is washed with ethanol, deionized water and cyclohexane several times, and dried at 60 °C for 2 h.
Upconversion luminescence spectrum were recorded by HORIBA Jobin Yvon iHR550 Spectrometers which employs a photon-counting detection system using a Hamamatsu R928 photomultiplier tube. Powder X-ray diffraction patterns were measured by Panalytical Empyrean diffractometer.
3. Results and discussions
The crystal structure was characterized using the XRD pattern. It is clear found that the pattern is be consistent with standard values of hexagonal phase NaLuF4 (JCPDS no. 27-0726), as shown in Fig. 1. The UC spectrum of NaLuF4:Yb3+/Er3+/Tm3+, under the 980 nm laser excitation, are shown in Fig. 2. The characteristic emissions, originated from the 1D2 → 3F4 (450 nm), 1G4 → 3H6 (475 nm), 3F2 → 3H6 (695 nm) of Tm3+ and 2H11/2 → 4I15/2 (525 nm), 4S3/2 → 4I15/2 (545 nm) and 4F9/2 → 4I15/2 (660 nm) of Er3+ transitions, are observed respectively. Fig. 3 gives the schematic of UC mechanism for the NaLuF4:Yb3+/Er3+/Tm3+ with the 980 nm laser excitation. The 1D2, 1G4, 2H11/2, 4S3/2 and 4F9/2 levels are populated via four-, three-, two-, two- and two- photons process, respectively.
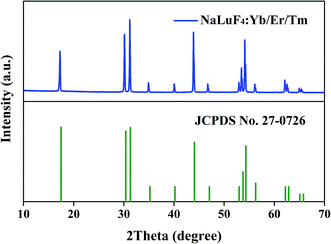 |
| | Fig. 1 XRD pattern of NaLuF4:20%Yb3+/2%Er3+/1%Tm3+ and the standard date for hexagonal NaLuF4 (JCPDS no. 27-0726). | |
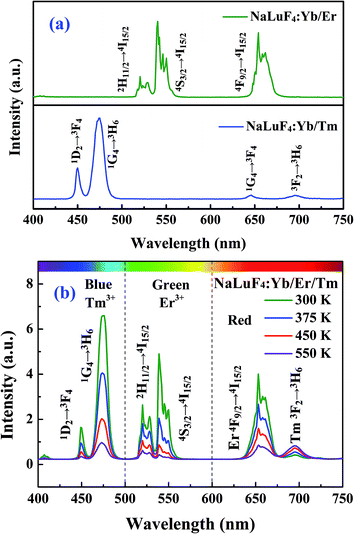 |
| | Fig. 2 (a) Upconversion emission spectrum of NaLuF4:Yb3+/Er3+ and NaLuF4:Yb3+/Tm3+. (b) Temperature-dependent upconversion emission spectrum of NaLuF4:Yb3+/Er3+/Tm3+. | |
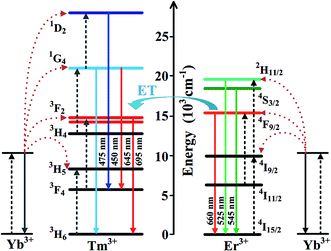 |
| | Fig. 3 Schematic energy level diagram for Yb3+, Er3+ and Tm3+ system and the proposed UC emission mechanism under 980 nm excitation. | |
It is interesting to found that the intensity of luminescence exhibits a significantly temperature-dependent behavior. The intensity of each emission band shows an obvious decrease with the temperature increasing apart from emission band at 695 nm (Tm:3F2 → 3H6 transition). The intensity decreasing is attributed to multiphonon relaxation rising, and different multiphonon relaxation rate is responsible for the variety of relative intensity. It is well known that luminescent intensity largely depend on matrix material.35,36 Wang et al. reported that thermal excitation (3H4 → 3F2 transition) is responsible for the intensity rising (3F2 → 3H6 transition) with the temperature increasing in LiNbO3:Tm3+/Yb3+ phosphor.37 Meanwhile,Xu et al. presented that the decrease of luminescent intensity (3F2 → 3H6 transition) is attributed to the multiphonon relaxation rising in α-NaYb(Mn)F4:Tm3+@NaYF4 phosphor.38 In addition, the energy transfer (ET) (4F9/2 (Er3) → 3F2 (Tm3+)) is an efficient pathway,39,40 because the energy gap (∼400 cm−1) is much closer to the maximal phonon energy of the host.41,42 Thus, these results suggest that the increase of emission intensity at 695 nm may be attributed to influence of matrix material and ET from Er3+ to Tm3+.
The FIR can be written as43–45
| |
 | (1) |
where
I is the integral intensity of emission band, Δ
E is the energy gap between two levels of RE ions,
C,
T and
k are a constant, absolute temperature and the Boltzmann constant, respectively. For sensing application, the absolute sensitivity (denote as
S) is a very important parameter, which has been calculated using the formula:
46–48| |
 | (2) |
The FIR variation with temperature is plotted in Fig. 4. In the case of Er3+, the 2H11/2 and 4S3/2 levels (thermal coupling levels) can be populated by thermal excitation. Therefore, the FIR arising from the 2H11/2 and 4S3/2 levels of Er3+ to the ground state transitions (denote as REr) can be used for the thermometer by using the following formula:
| |
 | (3) |
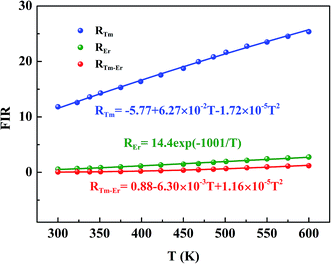 |
| | Fig. 4 The FIR based on thermal coupling levels (REr), “quasi-thermal coupling levels” (RTm–Er) and non-thermal coupling levels (RTm) as a function of temperature. | |
The energy gap between the 1G4 and 1D2 levels (ΔEDG ≈ 6476 cm−1) does not meet the requirement of eqn (1) application (200–2000 cm−1). Therefore, the FIR originated from the1G4 → 3H6 and 1D2 → 3F4 of Tm3+ transitions (denote as RTm) do not allow an estimation of temperature in the same approach.49 The experimental data for RTm (I475/I450) as a function of the temperature can be fitted by a polynomial function.
| | |
RTm = I475/I450 = C1 + B1T + B2T2 = −5.75 + 6.27 ×10⁻²T − 1.72 × 10⁻⁵T2
| (4) |
Due to non-resonant energy matching between the Er3+ and Tm3+ energy states, the multiphonon assisted energy transfer rate (denote as KET) described by Mott–Seitz model:50,51
| |
 | (5) |
Thus, the intensity of emission band at 660 nm (Er3+) and 695 nm (Tm3+) shows the temperature dependent behavior. In addition, The energy mismatch (ΔE ≈ 400 cm−1) between 4F7/2 state of Er3+ and 3F2 state of Tm3+ meet the requirement of thermal coupling levels (200–2000 cm−1). Therefore, the 4F7/2 state of Er3+ and the 3F2 state of Tm3+ can regard as a “quasi-thermal coupling levels”, and the FIR based on 3F2 → 3H6 (Tm3+) and 4F9/2 → 4I15/2 (Er3+) transition (denote as RTm–Er) shows a significant temperature dependence. The experimental data for RTm–Er (I695/I660) as a function of the temperature can be fitted by a polynomial function (Fig. 4).
| | |
RTm–Er = I695/I660 = 0.88 − 6.30 × 10⁻³T + 1.16 × 10⁻⁵T2
| (6) |
The corresponding sensitivity curves are given in Fig. 5. Obviously, the sensitivity (denote as STm) of optical thermometer based on non-thermal coupling levels (1D2 and 1G4 level of Tm3+) is highest in the whole temperature range, and the obtained maximum sensitivity is 604 × 10−4 K−1 at 300 K. In view of “quasi-thermal coupling levels” (4F7/2 of Er3+ and 3F2 of Tm3+), the sensitivity (denote as STm–Er) increases with temperature rising, and obtained maximum is 76 × 10−4 K−1 at 600 K. In the case of thermal coupling levels (2H11/2 and 4S3/2 of Er3+), the sensitivity (denote as SEr) firstly increases and then decreases. The maximum sensitivity (SEr) is 77 × 10−4 K−1 at 500 K. Table 1 lists the sensitivities of several typical optical thermometer doped with different RE3+ ions.
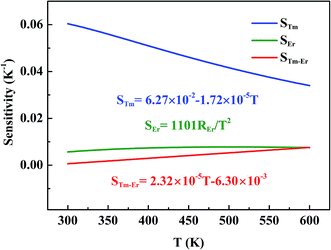 |
| | Fig. 5 The sensitivity based on thermal coupling levels (SEr), “quasi-thermal coupling levels” (STm–Er) and non-thermal coupling levels (STm) as a function of temperature. | |
Table 1 Values of the maximum sensitivity (SMax) of different material, including the corresponding transitions and the temperature range
| Material |
Ions (transitions) |
SMax (10−4 K−1) |
T (K) |
References |
| NaYF4:Yb, Er |
Er (2H11/2, 4S3/2 → 4I15/2) |
36.8 |
223–403 |
52 |
| BaTiO3:Yb, Er, Zn |
Er (2H11/2, 4S3/2 → 4I15/2) |
47.5 |
120–505 |
53 |
| NaLuF4:Yb, Er |
Er (4D7/2, 4G9/2 → 4I15/2) |
52 |
303–523 |
54 |
| NaLuF4:Yb, Tm, Gd |
Gd (6I9/2, 6I7/2 → 8S7/2) |
29 |
298–523 |
55 |
| NaYbF4:Tm, Mn@NaYF4 |
Tm (1G4 → 3H5, 3H4 → 3H6) |
24 |
123–423 |
38 |
| NaGdF4:Yb, Tm@NaGdF4:Tb, Eu |
Tb (5D4 → 7F5), Eu (5D0 → 7F2) |
12 |
125–300 |
50 |
| NaLuF4:Yb, Tm, Er |
Tm (1D2 → 3F4, 1G4 → 3H6) |
604 (STm) |
300–600 |
This work |
| Er (2H11/2, 4S3/2 → 4I15/2) |
77 (SEr) |
300–600 |
This work |
| Tm (3F2 → 3H6), Er (4F9/2 → 4I15/2) |
76 (STm–Er) |
300–600 |
This work |
The relative intensity of the blue colors (400–500 nm) and green colors (500–600 nm) decreases, contrarily, and the red light (600–750 nm) increases with the increase of temperature (Fig. 6). The CIE coordinates for the luminescent spectra of NaLuF4:Yb3+/Er3+/Tm3+ phosphor with different temperature (300, 400, 500 and 600 K) are located in the bluish green and light blue regions, as given in Fig. 7, respectively. Thus, the multicolor emission of temperature dependence can be also applied in temperature sensing.
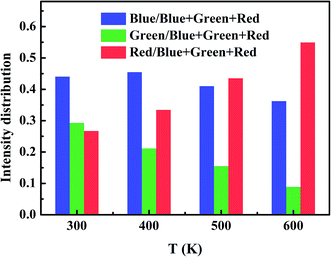 |
| | Fig. 6 Relative intensity of blue, green and red light of NaLuF4:Yb3+/Er3+/Tm3+ changed with temperature. | |
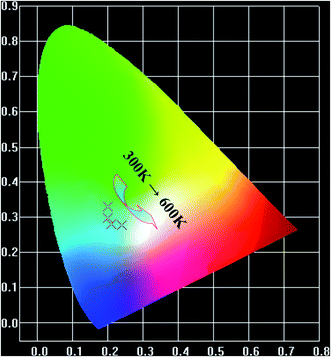 |
| | Fig. 7 Color coordinates of NaLuF4:Yb3+/Er3+/Tm3+ phosphor at different temperature (300 K, 400 K, 500 K and 600 K). | |
4. Conclusions
In summary, the hexagonal phase NaLuF4:20%Yb3+/2%Er3+/1%Tm3+ phosphor was synthesized by a hydrothermal method. Utilizing 980 nm laser excitation, the luminescent intensity exhibits a significantly temperature-dependent behavior. Using the FIR technique, three methods are adopted for investigating temperature sensing, which is based on thermal coupling levels (2H11/2 and 4S3/2 of Er3+), “quasi-thermal coupling levels” (4F7/2 of Er3+ and 3F2 of Tm3+) and non-thermal coupling levels (1D2 and 1G4 level of Tm3+), respectively. It is found that the sensitivity based on non-thermal coupling levels (1D2 and 1G4 level of Tm3+) is highest in the whole temperature range (300–600 K). The maximum sensitivity is 604 × 10−4 K−1 at 300 K. In addition, the luminescent color exhibit temperature-dependent behavior, which display from bluish green to light blue. These merits indicate that NaLuF4:Yb3+/Er3+/Tm3+ phosphor can be applied in optical temperature sensing, due to sensing performance of high sensitivity and temperature dependent multicolor emissions in the visible region.
Acknowledgements
This work has been supported by the grant of National Natural Science Foundation of China under project No. 11374079, 11474078 and 61275117.
References
- J. Zhou, Q. Liu, W. Feng, Y. Sun and F. Y. Li, Chem. Rev., 2015, 115, 395–465 CrossRef CAS PubMed.
- G. Chen, J. Seo, C. Yang and P. N. Prasad, Chem. Soc. Rev., 2013, 42, 8304–8338 RSC.
- X. D. Wang, O. S. Wolfbeis and R. J. Meier, Chem. Soc. Rev., 2013, 42, 7834–7869 RSC.
- D. Yang, Z. Hou, Z. Cheng, C. Li and J. Lin, Chem. Soc. Rev., 2015, 44, 1416–1448 RSC.
- X. Liu, R. Deng, Y. Zhang, Y. Wang, H. Chang, L. Huang and X. Liu, Chem. Soc. Rev., 2015, 44, 1479–1508 RSC.
- S. Gai, C. Li, P. Yang and J. Lin, Chem. Rev., 2013, 114, 2343–2389 CrossRef PubMed.
- H. Dong, L.-D. Sun and C.-H. Yan, Nanoscale, 2013, 5, 5703–5714 RSC.
- W. B. Niu, S. L. Wu, S. F. Zhang, L. T. Su and A. I. Y. Tok, Nanoscale, 2013, 5, 8164–8171 RSC.
- F. Auzel, Chem. Rev., 2004, 104, 139–173 CrossRef CAS PubMed.
- R. Dey and V. K. Rai, Dalton Trans., 2014, 43, 111–118 RSC.
- C. Zaldo and C. Cascales, Phys. Chem. Chem. Phys., 2014, 16, 23274–23285 RSC.
- D. Geng, M. Shang, Y. Zhang, H. Lian and J. Lin, Inorg. Chem., 2013, 52, 13708–13718 CrossRef CAS PubMed.
- K. Zheng, Y. Liu, Z. Liu, Z. Chen and W. Qin, Dalton Trans., 2013, 42, 5159–5166 RSC.
- Y. Liu, D. Tu, H. Zhu, R. Li, W. Luo and X. Chen, Adv. Mater., 2010, 22, 3266–3271 CrossRef CAS PubMed.
- Q. Lu, Y. Hou, A. Tang, H. Wu and F. Teng, Appl. Phys. Lett., 2013, 102, 233103 CrossRef.
- H. Liu, C. T. Xu, D. Lindgren, H. Xie, D. Thomas, C. Gundlach and S. Andersson-Engels, Nanoscale, 2013, 5, 4770–4775 RSC.
- A. Pandeya, V. K. Rai, V. Kumar, V. Kumar and H. C. Swart, Sens. Actuators, B, 2015, 209, 352–358 CrossRef.
- N. Niu, F. He, S. Gai, C. Li, X. Zhang, S. Huang and P. Yang, J. Mater. Chem., 2012, 22, 21613–21623 RSC.
- K. Zheng, Z. Liu, C. Lv and W. Qin, J. Mater. Chem. C, 2013, 1, 5502–5507 RSC.
- N. Niu, P. Yang, F. He, X. Zhang, S. Gai, C. Li and J. Lin, J. Mater. Chem., 2012, 22, 10889–10899 RSC.
- F. Vetrone, R. Naccache, A. Zamarron, A. J. de la Fuente, F. Sanz-Rodriguez, L. M. Maestro, E. M. Rodriguez, D. Jaque, J. G. Sole and J. A. Capobianco, ACS Nano, 2010, 4, 3254–3258 CrossRef CAS PubMed.
- D. Wawrzynczyk, A. Bednarkiewicz, M. Nyk, W. Strek and M. Samoc, Nanoscale, 2012, 4, 6959–6961 RSC.
- X. Wang, J. Zheng, Y. Xuan and X. Yan, Opt. Express, 2013, 21, 21596–21606 CrossRef CAS PubMed.
- N. Rakov and G. S. Maciel, Opt. Lett., 2014, 39, 3767–3769 CrossRef CAS PubMed.
- Q. Xiao, Y. Li, F. Li, M. Zhang, Z. Zhang and H. Lin, Nanoscale, 2014, 6, 10179–10186 RSC.
- E. Hemmer, M. Quintanilla, F. Légaré and F. Vetrone, Chem. Mater., 2014, 27, 235–244 CrossRef.
- R. Chen, V. D. Ta, F. Xiao, Q. Zhang and H. Sun, Small, 2013, 9, 1052–1057 CrossRef CAS PubMed.
- G. Jiang, S. Zhou, X. Wei, Y. Chen, C. Duan, M. Yin, B. Yang and W. Cao, RSC Adv., 2016, 6, 11795–11801 RSC.
- L. Marciniak, K. Prorok, L. Francés-Soriano, J. Pérez-Prieto and A. Bednarkiewicz, Nanoscale, 2016, 8, 5037–5042 RSC.
- S. Zhou, G. Jiang, X. Li, S. Jiang, X. Wei, Y. Chen, M. Yin and C. Duan, Opt. Lett., 2014, 39, 6687–6690 CrossRef CAS PubMed.
- X. Yi, Z. Chen, S. Ye, Y. Li, E. Song and Q. Zhang, RSC Adv., 2015, 5, 49680–49687 RSC.
- B. S. Cao, Y. Y. He, Z. Q. Feng, Y. S. Li and B. Dong, Sens. Actuators, B, 2011, 159, 8–11 CrossRef CAS.
- A. Pandey and V. K. Rai, Dalton Trans., 2013, 42, 11005–11011 RSC.
- B. Singh, A. Parchur, R. Ningthoujam, P. Ramakrishna, S. Singh, P. Singh, S. Rai and R. Maalej, Phys. Chem. Chem. Phys., 2014, 16, 22665–22676 RSC.
- A. Singh, P. K. Shahi, S. Rai and B. Ullrich, RSC Adv., 2015, 5, 16067–16073 RSC.
- H. Dong, L.-D. Sun, Y.-F. Wang, J. Ke, R. Si, J.-W. Xiao, G.-M. Lyu, S. Shi and C.-H. Yan, J. Am. Chem. Soc., 2015, 137, 6569–6576 CrossRef CAS PubMed.
- L. Xing, Y. Xu, R. Wang, W. Xu and Z. Zhang, Opt. Lett., 2014, 39, 454–457 CrossRef CAS PubMed.
- X. Xu, Z. Wang, P. Lei, Y. Yu, S. Yao, S. Song, X. Liu, Y. Su, L. Dong and J. Feng, ACS Appl. Mater. Interfaces, 2015, 7, 20813–20819 CAS.
- E. M. Chan, D. J. Gargas, P. J. Schuck and D. J. Milliron, J. Phys. Chem. B, 2012, 116, 10561–10570 CrossRef CAS PubMed.
- G. Monteiro, Y. Li, L. F. Santos and R. M. Almeida, J. Lumin., 2013, 134, 284–296 CrossRef CAS.
- Y. Yang, B. Yao, B. Chen, C. Wang, G. Ren and X. Wang, Opt. Mater., 2007, 29, 1159–1165 CrossRef CAS.
- K. Maheshvaran, S. Arunkumar, V. Sudarsan, V. Natarajan and K. Marimuthu, J. Alloys Compd., 2013, 561, 142–150 CrossRef CAS.
- M. K. Mahata, K. Kumar and V. K. Rai, Sens. Actuators, B, 2015, 209, 775–780 CrossRef CAS.
- L. Li, C. F. Guo, S. Jiang, D. K. Agrawal and T. Li, RSC Adv., 2014, 4, 6391–6396 RSC.
- Y. Tian, B. Tian, P. Huang, L. Wang and B. Chen, RSC Adv., 2015, 5, 14123–14128 RSC.
- T. V. Gavrilović, D. J. Jovanović, V. Lojpur and M. D. Dramićanin, Sci. Rep., 2014, 4, 4209 CrossRef PubMed.
- W. Xu, X. Gao, L. Zheng, Z. Zhang and W. Cao, Sens. Actuators, B, 2012, 173, 250–253 CrossRef CAS.
- D. Jaque and F. Vetrone, Nanoscale, 2012, 4, 4301–4326 RSC.
- S. A. Wade, S. F. Collins and G. W. Baxter, J. Appl. Phys., 2003, 94, 4743–4756 CrossRef CAS.
- S. Zheng, W. Chen, D. Tan, J. Zhou, Q. Guo, W. Jiang, C. Xu, X. Liu and J. Qiu, Nanoscale, 2014, 6, 5675–5679 RSC.
- A. Bednarkiewicz, M. Stefanski, R. Tomala, D. Hreniak and W. Strek, Phys. Chem. Chem. Phys., 2015, 17, 24315–24321 RSC.
- B. Dong, R. N. Hua, B. S. Cao, Z. P. Li, Y. Y. He, Z. Y. Zhang and O. S. Wolfbeis, Phys. Chem. Chem. Phys., 2014, 16, 20009–20012 RSC.
- M. K. Mahata, T. Koppe, T. Mondal, C. Brüsewitz, K. Kumar, V. K. Rai, H. Hofsäss and U. Vetter, Phys. Chem. Chem. Phys., 2015, 17, 20741–20753 RSC.
- K. Zheng, W. Song, G. He, Z. Yuan and W. Qin, Opt. Express, 2015, 23, 7653–7658 CrossRef PubMed.
- K. Zheng, Z. Liu, C. Lv and W. Qin, J. Mater. Chem. C, 2013, 1, 5502–5507 RSC.
|
| This journal is © The Royal Society of Chemistry 2016 |
Click here to see how this site uses Cookies. View our privacy policy here. ![[thin space (1/6-em)]](https://www.rsc.org/images/entities/char_2009.gif) :
:![[thin space (1/6-em)]](https://www.rsc.org/images/entities/char_2009.gif) Yb3+
Yb3+![[thin space (1/6-em)]](https://www.rsc.org/images/entities/char_2009.gif) :
:![[thin space (1/6-em)]](https://www.rsc.org/images/entities/char_2009.gif) Er3+
Er3+![[thin space (1/6-em)]](https://www.rsc.org/images/entities/char_2009.gif) :
:![[thin space (1/6-em)]](https://www.rsc.org/images/entities/char_2009.gif) Tm3+ = 79
Tm3+ = 79![[thin space (1/6-em)]](https://www.rsc.org/images/entities/char_2009.gif) :
:![[thin space (1/6-em)]](https://www.rsc.org/images/entities/char_2009.gif) 18
18![[thin space (1/6-em)]](https://www.rsc.org/images/entities/char_2009.gif) :
:![[thin space (1/6-em)]](https://www.rsc.org/images/entities/char_2009.gif) 2
2![[thin space (1/6-em)]](https://www.rsc.org/images/entities/char_2009.gif) :
:![[thin space (1/6-em)]](https://www.rsc.org/images/entities/char_2009.gif) 1) was added to the above mixture and stirred for another 30 min. A 6 mL solution of NH4F (5 mmol) was added to the resultant solution to form a colloidal suspension. Then, the above solution was moved into a autoclave and kept at 180 °C for 12 h. The resultant product was collected by centrifugation (5 min, 8000 rpm). Finally, the product is washed with ethanol, deionized water and cyclohexane several times, and dried at 60 °C for 2 h.
1) was added to the above mixture and stirred for another 30 min. A 6 mL solution of NH4F (5 mmol) was added to the resultant solution to form a colloidal suspension. Then, the above solution was moved into a autoclave and kept at 180 °C for 12 h. The resultant product was collected by centrifugation (5 min, 8000 rpm). Finally, the product is washed with ethanol, deionized water and cyclohexane several times, and dried at 60 °C for 2 h.


