Impact of EGR on the surface functional groups of diesel engine particles based on NEXAFS
Y. Zhao*a,
Z. Wangb,
G. J. Xua and
M. D. Lia
aDepartment of Automobile Engineering, Changshu Institute of Technology, Hushan Road NO.99, Chang shu, Jiangsu 215500, China. E-mail: zhaoyangujs@163.com
bDepartment of Automobile and Traffic Engineering, Jiangsu University, Xuefu Road No. 301, Zhen Jiang, Jiangsu 212013, China
First published on 10th June 2016
Abstract
The thermal, dilution and chemical effects of EGR result in relatively significant changes in the formation environment, in the physical and chemical reactions of particles and in the functional groups of the matter that constitutes the particles. In this paper, the surface functional groups of particles generated from a diesel engine (2000 rpm, 2.6 kW) under different EGR rates (0, 10%, 30%), EGR gas composition (CO2, N2) and EGR temperature (423 K, 373 K, 323 K) was studied by near-edge X-ray absorption fine-structure (NEXAFS) spectroscopy. The near-edge energy of the C functional groups of diesel engine particles are mainly distributed at the near energy range of 284–292 eV, and these C functional groups exhibited a typical graphite structure. The content of the O-lacking functional groups of particles gradually decreased with increases in the EGR rate, whereas the contents of the O-containing functional groups and the aliphatic C–H functional group increased with increases in the EGR rate. The presence of CO2 in the exhaust gas caused the content of the O-containing and aliphatic C–H functional groups of particles to increase, whereas the contents of the O-lacking functional groups decreased. The presence of N2 had an insignificant impact on the relative content of the functional groups. The content of the O-lacking functional groups increased significantly with increases in the EGR temperature, whereas the content of the O-containing and aliphatic C–H functional groups all decreased to some extent with increases in the EGR temperature.
1 Introduction
By directing the exhaust gas generated from combustion into the cylinder, exhaust gas recirculation (EGR) reduces the oxygen concentration of the gas mixture in the combustion chamber, the maximum combustion temperature in the cylinder and the amount of NOX. However, the use of EGR has an adverse impact on the emission of diesel engine particles. To meet higher emission standards, post-processing methods (e.g., diesel particulate filters [DPFs]) can often be used.The structural and oxidation characteristics of the particles have a significant impact on the regeneration efficiency of the carrier in a DPF. Studies1,2 have revealed that there are large amounts of O-containing functional groups (e.g., hydroxyl and carboxyl groups) and O-lacking functional groups (e.g., C–H and C–C groups) on the surfaces and edges of the microlamellar structures of diesel engine particles. These functional groups have a significant impact on the graphitization and reactive/catalytic activity of the particles. The thermal, dilution and chemical effects of EGR result in relatively significant changes in the formation environment, in the physical and chemical reactions of particles and in the functional groups of the matter (e.g., organic matter and dry soot) that constitutes particles, which in turn results in changes in the composition and contents of the particles themselves.
Researchers around the world have conducted extensive research on the functional groups of particles. Song et al.3 reported that hydroxyl and carbonyl functional groups were found at the graphitic edges of diesel engine particles and that the particles generated from the combustion of O-containing fuels contained higher contents of C and O functional groups. Braun et al.4 found that the initial temperatures at which the reactions of different O-containing functional groups occurred were different and that the initial reaction temperature of functional groups that contain the carbonyl functional group or the lactone functional group was approximately 250 °C. Wan et al.5 demonstrated that O-containing isomers, particularly the carbonyl group or the isomeric ring structure, could improve the reactive activity of particles through mutual exchanges between electrons.
Methods such as Fourier transform infrared spectroscopy, X-ray diffraction and electron energy loss spectroscopy (EELS) can be used to study the functional groups of particles.6,7 A number of EELS studies on carbonaceous fine particulates and carbon black have been published in the past, a discussion of the EELS spectra of carbon black is given in,8 and for ambient particulate matter in,9 for instance. Katrinak et al.10 studied carbonaceous urban PM, i.e. variations in carbon structure among different spherules within and between aggregates. Their EELS data suggested that soot particles show structural variations including carbon single, double and triple bonds, implying presence of elemental and organic carbon. In EELS, inner shell absorption is used to probe elements. Often, transmission electron microscopes (TEM) come with an EELS spectrometer that allows for some rudimentary chemical analysis, including carbon.11 However, in an electron microscope, electrons are accelerated to energies of up to 200 keV. Most of these electrons scatter inelastically with the specimen. But the energy deposited by these inelastically scattered electrons also leads to radiation damage in the specimen. Moreover, Braun A. et al.12 find that most of experimental EELS spectra do not show typical sidebands at 286 and 288 eV, which arise from carboxyl or carbonyl groups or hydrocarbons on the solid, black carbon material. However, the researchers13,14 implicitly must have assumed presence of such groups in or on their carbon samples.
Near-edge X-ray absorption fine-structure (NEXAFS) spectroscopy has been used for the speciation of carbon in materials for almost 25 years,15 but has only been used to examine PM quite recently,16 especially for examining particle from diesel engine.17,18 The spectra from NEXAFS experiments are quite similar to EELS data.19 Absorption peaks in EELS and NEXAFS spectra of carbon occur at energy positions that depend on which molecular or atomic environment the carbon atom is experiencing. For review articles on EELS and NEXAFS see for instance.20,21 The energy position of ionization edges gives the chemical or elemental information on the atoms present in the sample. If particular molecular species in the sample are reduced or oxidized, the edge position is shifted by a characteristic energy (chemical shift). The spectrum can be considered as a fingerprint of the sample irradiated by the electrons.
While, NEXAFS spectroscopy has a lower primary electron energy and a lower risk of radiation damage than EELS. In addition, it can be used to measure various types of functional groups due to its wider energy range. Rightor et al.22 gave a comparison of carbon and oxygen NEXAFS and EELS. They found good agreement in the overall shape of the spectra, but the NEXAFS spectra exhibit a number of finer structures which were not resolved by the EELS. Stefano di Stasio et al.18 studied on soot obtained from an ethylene/air flame, a diesel engine, and graphite by NEXAFS. They found that graphite, diesel soot, and ethylene soot had in common the dip in the NEXAFS spectra at energies higher than 288 eV, which was absent in the case of carbon black owing to the larger presence in the last of C–H groups. Braun A. et al.12 reported on the structure of a set of diesel exhaust samples that were obtained from reference diesel fuel and diesel fuel mixed with ferrocene. Their data suggested that the soot specimen from the diesel mixed with ferrocene had an entirely different structure and lacks significantly in graphite like characteristics. NEXAFS spectra of such soot barely show aromatics but pronounced contributions from aliphatic structures.
In the present work, exhaust particles emitted from the diesel engine were collected under conditions of different EGR rates, different compositions of EGR exhaust gases and different EGR gas temperatures. The NEXAFS spectroscopy technique was used to investigate the effects of EGR on the composition of the functional groups of particles. The multi-peak fitting method was used to comparatively analyze the relative content of each major functional group in the particles. The results of the present study provide a basis for further reducing the emission of diesel engine particles and optimizing the control strategy for the regeneration of DPF.
2 Experimental sections
2.1 Particle collection and particle size measurement
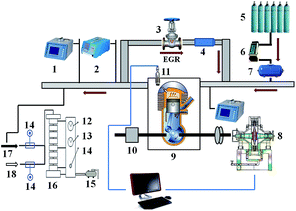
A refitted single-cylinder test diesel engine was used in this study. The diesel engine had a cylinder diameter of 86 mm, a compression ratio of 19, a rated rotation speed of 3600 rpm and a rated power of 6.3 kW. Commercially available diesel (sulfur content: 47 ppm), which met the 50 ppm fuel sulfur limit of the Chinese Phase IV Emission Regulations for Diesel Vehicles, was used in the study. The lubricating oil was a 15W-40 full mineral oil with a measured sulfur content of 2687 ppm.A MEXA-324F gas analyzer was used to measure the oxygen concentration in the intake air and the composition of the exhaust gas. A MOUDI multi-size particle-collecting device (pore size: 0.1–17.1 mm) was used to collect diesel engine particles. Different EGR rates could be achieved by manual opening/closing EGR valve. The EGR rate was controlled using an electronic gas flow control valve. Particle samples were generated under different EGR temperatures and different EGR exhaust gas compositions. The EGR temperature was altered by controlling the flow of cooling water through the EGR cooler. The EGR exhaust gas composition was altered by altering the CO2 and N2 flows via controlling the opening of the valves of the CO2 and N2 tanks. Fig. 1 shows the experimental system.
During the particle collection process, the diesel engine had a stable rotation speed of 2000 rpm and a power of 2.6 kW, and the exhaust gas intercooler temperature was controlled at 373 K. Particles were collected at EGR rates of 0%, 10% and 30%. When N2 or CO2 was pumped in, the opening of the valve of the inert gas tank was adjusted. Particles were collected when the inert gas flow was the same as the flow at the EGR rate of 30%. The EGR temperature was altered by adjusting the flow of cooling water through the EGR cooler. Particles were collected when the EGR rate was 30% and the EGR temperature was 423 K and 323 K. Before the collection process began, the flow was calibrated based on the difference between the upper pressure and lower pressure. Under the effect of the vacuum air pump, the diluted engine exhaust gas entered the impactor at a constant-volume flow of 30 L min−1. The sampling process lasted for 20 min. Aluminium foil filter paper (Φ = 47 nm) manufactured was used for sampling.
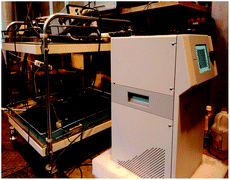
We also took a measurement on the particle size and number concentration by using engine exhaust particle sizer (EEPS) as shown in Fig. 2. Before entering the EEPS, the sample of exhaust gas was taken by a 1.5 m long line heated at 150 °C and it was diluted by the Dekati Engine Exhaust Diluter (DEED), a Particle Measurement Program (PMP)-compliant conditioning system. In the dilution system, the sample was first diluted with air heated above 150 °C. Then, the sample passed through an evaporation chamber at a temperature above 300 °C for removing volatile particles. After the thermal conditioning, the sample was further diluted to reduce the particle concentration along with the temperature to a suitable level for the aerosol particle sensors for size distribution measurement.
2.2 NEXAFS spectroscopy
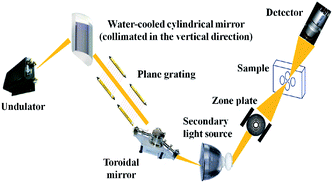
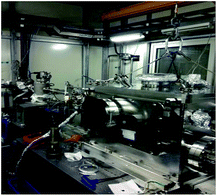
The main principle of NEXAFS spectroscopy is as follows: photoelectrons excited by X-rays are scattered by the surrounding coordination atoms, resulting in the absorption intensity of the X-rays oscillating with energy. The electronic and geometric local structures of matter can be obtained by analyzing the oscillation signal. Electrons in storage rings are extracted by an undulator. After being monochromatized by a variable-included angle plane-grating monochromator, X-rays are focused onto the sample by a zone plate. Subsequently, transmitted photons are detected by a rapid proportional detector (Fig. 3).The soft X-ray spectromicroscopy beamline at the Shanghai Synchrotron Radiation Facility was used to measure the functional groups of particles generated under different EGR rates, different EGR temperatures and different EGR exhaust gas compositions. Fig. 4 shows the test site. The test parameters were set as follows: photon energy range: 250–2000 eV; energy resolution (E/ΔE): ≥2500; spatial resolution: ≤50 nm; photon flux: 106–109 photons per s; pressure in the sample chamber: approximately 10–6 Torr (1 Torr = 1.33322 × 10² Pa); test beam current: 150–210 m; scanning step: 0.1 eV.
3 Test result and analysis
3.1 Effect of EGR on particle emission
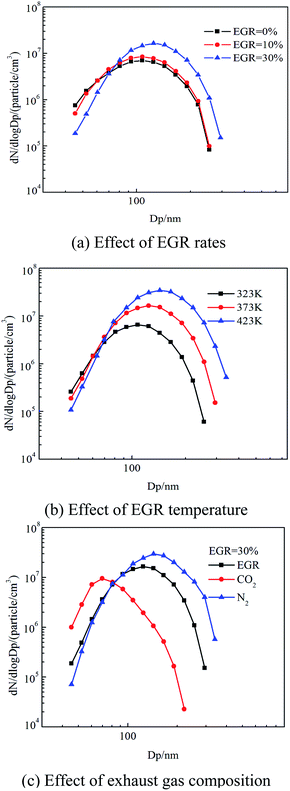
Fig. 5 shows the effect of EGR on the particle size and number concentration. The peak diameter of particle number concentration shifted to the right side when EGR rate increased from 0% to 30%. That indicated that a decrease of the number of nucleation mode particles with an increase in EGR rate yet the number of accumulation mode particles increase and the total number concentration of particles also had an obvious increasing. In addition, the EGR temperature had an insignificant effect on the number of nucleation mode particles but the number of accumulation mode particles had a significant increase when EGR temperature raised from 323 K to 423 K. Moreover, N2 led to the increase of size, number concentration of the accumulation mode particles with EGR introduced. However, CO2 followed the opposite pattern to N2.3.2 Effect of EGR rate
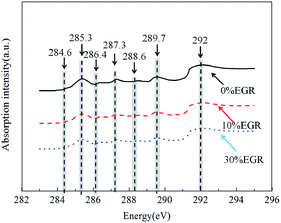
The functional groups of particles exist in various forms.23,24 The near-edge energy of the functional groups of particles is generally distributed over a range of 280–300 eV. The 1s → π* transition energy of most of the functional groups is in the range of 284–291 eV,25 and the 1s → σ* transition energy is greater than 292 eV.19,26 Fig. 6 shows the NEXAFS spectra of particles generated under different EGR rates. The diesel engine particles exhibited characteristics typical of a graphitic structure and significant absorption peaks in the energy range of 284–292 eV due to the presence of C–H and C–COOH groups as well as other similar functional groups. We can get the same variation in the discussion of the NEXAFS spectra of diesel soot carried out by Braun A. et al.12 Meanwhile, there are some other obvious peaks in the curves, such as a relatively intense absorption peak appeared near 285 eV, which was mainly caused by the unsaturated C![[double bond, length as m-dash]](https://www.rsc.org/images/entities/char_e001.gif) C bond and a relatively significant absorption peak also appeared near 292 eV, which was mainly caused by large amounts of crystal structures in an orderly arrangement. These peaks have also been noticed in ref. 12 and 17–19.
C bond and a relatively significant absorption peak also appeared near 292 eV, which was mainly caused by large amounts of crystal structures in an orderly arrangement. These peaks have also been noticed in ref. 12 and 17–19.
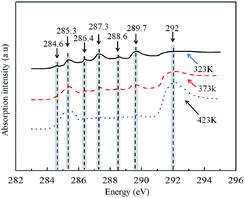
All of the NEXAFS spectra of particles in the energy range of 284–292 eV exhibited seven peaks. For peak assignments, an earlier EELS study by Francis and Hitchcock27 as well as a list published by Cody et al.25 is helpful (the list is reproduced in Table 1.) The corresponding energies of these peaks were 284.6 eV, 285.3 eV, 286.4 eV, 287.3 eV, 288.6 eV, 289.7 eV and 292 eV. Table 1 lists the detailed corresponding relationships.
| Functional group | Energy/eV | Transition |
|---|---|---|
Quinones (C![[double bond, length as m-dash]](https://www.rsc.org/images/entities/char_e001.gif) O) O) |
283.7–284.8 | 1s → π* |
| Aromatic base (C–C) | 284.9–285.5 | 1s → π* |
| Phenols/ketones (C–OH) | 286.5–287.2 | 1s → π* |
| Aliphatic group (C–H) | 287.1–287.8 | 1 s → 3p/σ* |
Carboxyl group (C![[double bond, length as m-dash]](https://www.rsc.org/images/entities/char_e001.gif) O) O) |
287.7–288.8 | 1s → π* |
Carbonyl group (C![[double bond, length as m-dash]](https://www.rsc.org/images/entities/char_e001.gif) O) O) |
290.2–290.5 | 1s → π* |
Graphite (C![[double bond, length as m-dash]](https://www.rsc.org/images/entities/char_e001.gif) C) C) |
292 | 1s → σ* |
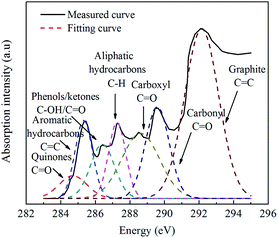
There was some overlap among the peaks in each NEXAFS spectrum of particles. Therefore, it was impossible to accurately calculate and compare the relative contents of the functional groups. To further analyze the effects of EGR on the functional groups of particles, the GRAMS spectral analysis software and the Levenberg–Marquardt algorithm were used to perform multi-peak fitting on the seven peaks in each spectrum. The fitting results of the seven peaks in the NEXAFS spectrum of the original diesel engine particles (EGR rate: 0%) are shown in Fig. 7 as a representative example.
Table 2 lists the relative contents of the functional groups of particles generated under different EGR rates. The O-lacking functional groups of particles mainly existed in the forms of the graphite C and aromatic C (C![[double bond, length as m-dash]](https://www.rsc.org/images/entities/char_e001.gif) C). Compared to 0% EGR rate, the contents of the graphite C and aromatic C functional groups of particles decreased by approximately 16.3% and 8.4%, respectively, as the EGR rate increased. In addition, the contents of the O-containing functional groups, namely the quinone (C
C). Compared to 0% EGR rate, the contents of the graphite C and aromatic C functional groups of particles decreased by approximately 16.3% and 8.4%, respectively, as the EGR rate increased. In addition, the contents of the O-containing functional groups, namely the quinone (C![[double bond, length as m-dash]](https://www.rsc.org/images/entities/char_e001.gif) O), carboxyl (C
O), carboxyl (C![[double bond, length as m-dash]](https://www.rsc.org/images/entities/char_e001.gif) O), carbonyl (C
O), carbonyl (C![[double bond, length as m-dash]](https://www.rsc.org/images/entities/char_e001.gif) O) and phenol/ketone functional groups (C–OH), increased by approximately 8.8%, 15.7%, 16.3% and 23.4%, respectively, as the EGR rate increased. Furthermore, the content of the aliphatic functional group (C–H) increased by approximately 16.1% as the EGR rate increased.
O) and phenol/ketone functional groups (C–OH), increased by approximately 8.8%, 15.7%, 16.3% and 23.4%, respectively, as the EGR rate increased. Furthermore, the content of the aliphatic functional group (C–H) increased by approximately 16.1% as the EGR rate increased.
| Functional group types | Relative contents of functional groups (%) | ||
|---|---|---|---|
| 0% EGR | 10% EGR | 30% EGR | |
Quinones (C![[double bond, length as m-dash]](https://www.rsc.org/images/entities/char_e001.gif) O) O) |
6.2 | 6.4 | 6.8 |
| Aromatic base (C–C) | 27.4 | 26.9 | 25.1 |
| Phenols/ketones (C–OH) | 5.2 | 5.9 | 6.7 |
| Aliphatic group (C–H) | 20.8 | 22.6 | 24.8 |
Carboxyl group (C![[double bond, length as m-dash]](https://www.rsc.org/images/entities/char_e001.gif) O) O) |
4.3 | 4.6 | 5.1 |
Carbonyl group (C![[double bond, length as m-dash]](https://www.rsc.org/images/entities/char_e001.gif) O) O) |
3.6 | 3.8 | 4.3 |
Graphite (C![[double bond, length as m-dash]](https://www.rsc.org/images/entities/char_e001.gif) C) C) |
32.5 | 29.8 | 27.2 |
A study28 has shown that O-containing and aliphatic C–H functional groups have a promoting effect on the oxidative activity of particles; the higher the contents of these functional groups, the higher the oxidative activity of particles, indicating that the introduction of EGR promotes improvements in the oxidative activity of particles. The preliminary analysis indicated that the aforementioned variation pattern may have been caused by the following: after EGR is introduced, the exhaust gas generated by combustion re-enters the cylinder and decreases, to a large extent, the O concentration of the gas mixture in the cylinder under the dilution effect. As a result, the rate of the chemical reaction controlled by the concentration decreases and the first oxidative dehydrogenation reaction (C7H16 + O2 → C7H15 + HO2) is inhibited at the low-temperature reaction stage of diesel and the H2O2 decomposition reaction. The above effects have a significant impact on the combustion temperature in the cylinder, resulting in an extension of the ignition delay period during the combustion process and a decrease in the combustion temperature in the cylinder (approximately increase by 200 K). Lu et al.29 and Zhang et al.30 demonstrated that a high-temperature environment is the main cause of the formation of the graphite layer in particles. In addition, the longer the high-temperature environment lasts, the more orderly the microcrystalline structure is, the higher the graphitization degree is, and the lower the combustion temperature in the cylinder is. A low combustion temperature inhibits the graphitization process of particle precursors, such as polycyclic aromatic hydrocarbons. Compared to the high-temperature duration, temperature has a larger impact on the graphitization process. The increase in the content of O-containing functional groups may be mainly caused by the following: after EGR is introduced, the ignition delay period is extended and the combustion duration period is shortened, resulting in large amounts of O-containing functional groups being incompletely oxidized and remaining on the surface of particles. It has been noted31,32 that the higher the combustion temperature is, the more intense the high-temperature dehydrogenation reaction and carbonation reaction on the surface of particles are, and the lower the content of the aliphatic C–H functional group is. In addition, the higher the graphitization degree of particles is, the more orderly and dense the arrangement of the C atoms in the particles is, the denser the lamellar structures are, and the relatively lower the carbon and hydrogen contents at the particle edges are. After EGR is introduced, the content of the aliphatic C–H functional group of particles increases due to the decreases in both the maximum combustion temperature and the graphitization degree of particles.
3.3 Effects of exhaust gas composition
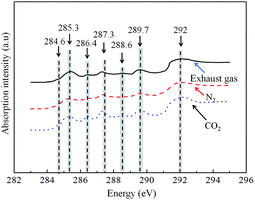
The EGR exhaust gas mainly includes the remaining air (mainly N2 and O2), the products of complete combustion (CO2 and H2O) and a small amount of intermediate products. A change in the EGR rate is, in fact, a change in the proportions of N2, O2 and CO2. To further analyze the effects of the introduction of EGR on the functional groups of particles, we investigated the compositions and relative contents of the functional groups of particles when the exhaust gas, N2 or CO2 was pumped in while the EGR rate remained the same (30%). Fig. 8 shows the NEXAFS spectra of the particles generated under different EGR exhaust gas compositions. The shapes of the spectrum of the particles did not vary significantly according to whether only N2, CO2 or the exhaust gas was pumped in. The energy ranges corresponding to the peaks of these three spectra were generally consistent with each other; only the peak values differed, indicating that the EGR exhaust gas composition has an insignificant impact on the category of the functional groups of particles but has an impact on the contents of the functional groups.Table 3 lists the relative contents of the functional groups of the particles generated under different exhaust gas compositions. The contents of the two O-lacking functional groups, namely the graphite C and aromatic C functional groups, decreased by approximately 32.4% and 11.2%, respectively, when only CO2 was pumped in compared to when only the exhaust gas was pumped in. The contents of the O-containing functional groups, namely the quinone (C![[double bond, length as m-dash]](https://www.rsc.org/images/entities/char_e001.gif) O), carboxyl (C
O), carboxyl (C![[double bond, length as m-dash]](https://www.rsc.org/images/entities/char_e001.gif) O), carbonyl (C
O), carbonyl (C![[double bond, length as m-dash]](https://www.rsc.org/images/entities/char_e001.gif) O) and phenol/ketone functional groups (C–OH), all increased to a relatively large extent (by approximately 16.1%, 34.6%, 33.8% and 23.9%, respectively) when only CO2 was pumped in compared to when only the exhaust gas was pumped in. The content of the aliphatic functional group (C–H) increased by approximately 11.7% when only CO2 was pumped in compared to when only the exhaust gas was pumped in. The relative contents of the functional groups did not differ significantly between when only N2 was pumped in and when only the exhaust gas was pumped in, due to N2 is the main composition in exhaust gas, in addition, the thermal capacity of N2 and exhaust gas had no big difference, and the affection on combustion process was only reflected through the dilution effect. Besides that the data in Table 3 also indicating that the CO2 in the exhaust gas has a significant impact on the functional groups of particles, is the main gas component that causes changes in the relative contents of the functional groups of particles and plays a role in increasing the oxidative activity of particles. A preliminary analysis was conducted to investigate the possible causes of the aforementioned effects of CO2. On one hand, CO2 had a relatively high thermal capacity compared to the exhaust gas and N2, and it can also decrease the oxygen concentration in mixed gas by dilutive effect. Thus, the combustion temperature in the cylinder decreases to a relatively large extent (approximately increase by 300 K) when CO2 is pumped into the cylinder, resulting in a decrease in the resonance stability of the electrons of the pentacyclic aromatic hydrocarbons, which causes the carbon layers to bend and the C
O) and phenol/ketone functional groups (C–OH), all increased to a relatively large extent (by approximately 16.1%, 34.6%, 33.8% and 23.9%, respectively) when only CO2 was pumped in compared to when only the exhaust gas was pumped in. The content of the aliphatic functional group (C–H) increased by approximately 11.7% when only CO2 was pumped in compared to when only the exhaust gas was pumped in. The relative contents of the functional groups did not differ significantly between when only N2 was pumped in and when only the exhaust gas was pumped in, due to N2 is the main composition in exhaust gas, in addition, the thermal capacity of N2 and exhaust gas had no big difference, and the affection on combustion process was only reflected through the dilution effect. Besides that the data in Table 3 also indicating that the CO2 in the exhaust gas has a significant impact on the functional groups of particles, is the main gas component that causes changes in the relative contents of the functional groups of particles and plays a role in increasing the oxidative activity of particles. A preliminary analysis was conducted to investigate the possible causes of the aforementioned effects of CO2. On one hand, CO2 had a relatively high thermal capacity compared to the exhaust gas and N2, and it can also decrease the oxygen concentration in mixed gas by dilutive effect. Thus, the combustion temperature in the cylinder decreases to a relatively large extent (approximately increase by 300 K) when CO2 is pumped into the cylinder, resulting in a decrease in the resonance stability of the electrons of the pentacyclic aromatic hydrocarbons, which causes the carbon layers to bend and the C![[double bond, length as m-dash]](https://www.rsc.org/images/entities/char_e001.gif) C bond energy to decrease at the sites of bending. In addition, a decrease in the combustion temperature in the cylinder inhibits the high-temperature dehydrogenation and carbonization reactions on the surface of particles, resulting in a decrease in the contents of the O-lacking functional groups and an increase in the content of the aliphatic C–H functional group C–H on the surface of the particles. On the other hand, CO2 can react directly with C (C + CO2 = 2CO) during the combustion process.33 As a result, more micropores are formed on the surface of particles and the particles have a larger specific surface area. In addition, more aromatic C structures are destroyed. Most of these destroyed structures are emitted in the form of gas products, CO and CO2, whereas a portion of these destroyed structures are stored on the surface of particles in the form of O-containing functional groups (e.g., phenols/ketones and carboxyl and carbonyl groups), which is also the main cause of the increases in the relative contents of the O-containing functional groups of particles after EGR is introduced.
C bond energy to decrease at the sites of bending. In addition, a decrease in the combustion temperature in the cylinder inhibits the high-temperature dehydrogenation and carbonization reactions on the surface of particles, resulting in a decrease in the contents of the O-lacking functional groups and an increase in the content of the aliphatic C–H functional group C–H on the surface of the particles. On the other hand, CO2 can react directly with C (C + CO2 = 2CO) during the combustion process.33 As a result, more micropores are formed on the surface of particles and the particles have a larger specific surface area. In addition, more aromatic C structures are destroyed. Most of these destroyed structures are emitted in the form of gas products, CO and CO2, whereas a portion of these destroyed structures are stored on the surface of particles in the form of O-containing functional groups (e.g., phenols/ketones and carboxyl and carbonyl groups), which is also the main cause of the increases in the relative contents of the O-containing functional groups of particles after EGR is introduced.
| Functional group types | Relative contents of functional groups (%) | ||
|---|---|---|---|
| Exhaust | N2 | CO2 | |
Quinones (C![[double bond, length as m-dash]](https://www.rsc.org/images/entities/char_e001.gif) O) O) |
6.8 | 6.5 | 8.1 |
| Aromatic base (C–C) | 25.1 | 25.3 | 22.3 |
| Phenols/ketones (C–OH) | 6.7 | 6.5 | 8.8 |
| Aliphatic group (C–H) | 24.8 | 24.4 | 28.1 |
Carboxyl group (C![[double bond, length as m-dash]](https://www.rsc.org/images/entities/char_e001.gif) O) O) |
5.1 | 5.2 | 7.8 |
Carbonyl group (C![[double bond, length as m-dash]](https://www.rsc.org/images/entities/char_e001.gif) O) O) |
4.3 | 4.5 | 6.5 |
Graphite (C![[double bond, length as m-dash]](https://www.rsc.org/images/entities/char_e001.gif) C) C) |
27.2 | 27.6 | 18.4 |
3.4 Effects of EGR temperature
After EGR is introduced, the exhaust gas generated from combustion heats up the intake air, alters the formation conditions of the intermediate products that are relatively sensitive to temperature during the combustion process (e.g., H, N and OH), and affects the formation and oxidation processes of particles in the cylinder. Fig. 9 shows the NEXAFS spectra of particles generated under different EGR temperatures. The shapes of the spectra of particles generated under different EGR temperatures were essentially the same, and the energy ranges corresponding to the peaks were generally consistent with each other. However, there was a relatively large difference in the peak values among the different spectra, indicating that the EGR temperature has an insignificant impact on the category of the functional groups of particles but has an impact on the relative contents of the functional groups.Table 4 lists the changes in the relative contents of the functional groups of particles generated under different EGR temperatures. Under the same EGR rate but increase EGR temperatures, the contents of the graphite C and aromatic C functional groups gradually increased (by approximately 23.9% and 12%, respectively). In addition, under the same EGR rate but increasing EGR temperatures, the contents of the O-containing functional groups, namely the quinone, carboxyl, carbonyl and phenol/ketone functional groups, decreased by approximately 9.3%, 32.9%, 37.7% and 11.8%, respectively. Furthermore, under the same EGR rate but increasing EGR temperatures, the content of the aliphatic C–H functional group decreased by approximately 10.1%. These findings indicate that the higher the EGR temperature is, the more significant the adverse impact of the EGR temperature will be on the oxidative activity of particles.
| Functional group types | Relative contents of functional groups (%) | ||
|---|---|---|---|
| 323 K | 373 K | 423 K | |
Quinones (C![[double bond, length as m-dash]](https://www.rsc.org/images/entities/char_e001.gif) O) O) |
7.5 | 7.1 | 6.8 |
| Aromatic base (C–C) | 22.1 | 23.7 | 25.1 |
| Phenols/ketones (C–OH) | 7.6 | 7.4 | 6.7 |
| Aliphatic group (C–H) | 27.6 | 26.2 | 24.8 |
Carboxyl group (C![[double bond, length as m-dash]](https://www.rsc.org/images/entities/char_e001.gif) O) O) |
7.6 | 6.1 | 5.1 |
Carbonyl group (C![[double bond, length as m-dash]](https://www.rsc.org/images/entities/char_e001.gif) O) O) |
6.9 | 5.2 | 4.3 |
Graphite (C![[double bond, length as m-dash]](https://www.rsc.org/images/entities/char_e001.gif) C) C) |
20.7 | 24.3 | 27.2 |
This phenomenon may occur due to the following reason: when the intake air pressure remains the same, the intake air temperature increases, the air density decreases, and the thermal throttling effect of the intake air increases with the increasing EGR temperature, resulting in a decrease in the O concentration of the intake air and a tendency for the ignition delay period to increase. However, Zhang et al.34 demonstrated that the increase in the intake air temperature is somewhat amplified at the fuel injection moment, resulting in a relatively high temperature in the cylinder at the fuel injection moment, the advancement of the ignition moment of the fuel and a decrease in the ignition delay period, which in turn results in a certain decrease in the time required for the mixing of diesel and air, the advancement of the premixed combustion, an increase in the combustion temperature in the cylinder (approximately increase by 150 K) and an extension of the combustion duration. A relatively high combustion temperature provides energy and active sites for the rearrangement of the C atoms in particles. The relatively active C atoms in the amorphous regions with disorderly arranged atoms and a relatively low graphitization degree are the first atoms to become oxidized and form holes. The original pores and cracks are also easily oxidized and thus expanded. The C atoms in the relatively stable crystalline regions are retained to form the skeletons of particles, resulting in an increase in the overall graphitization degree. In addition, a relatively long combustion duration results in an extension of the particle oxidation time in the cylinder, which in turn results in the consumption of large amounts of the O-containing functional groups on the surface of particles. Furthermore, the C atoms at the edges of the C layer contain unpaired sp2 electrons and thus easily form bonds with O atoms, resulting in a decrease in the content of the aliphatic C–H functional group located at the edges of the C layer.
4 Conclusions
In the present study, the surface functional groups of particles generated from a diesel engine under different EGR rate, EGR gas composition and EGR temperature was studied by near-edge X-ray absorption fine-structure (NEXAFS). Some main conclusions of the investigation were drawn as follows:The near-edge energy of the C functional groups of diesel engine particles was in the range of 284–292 eV, and these C functional groups exhibited a typical graphite structure. These C functional groups mainly included O-lacking functional groups (the aromatic and graphite C functional groups), O-containing functional groups (the quinone, carboxyl, carbonyl and phenol/ketone functional groups) and the aliphatic C–H functional group.
The contents of the O-lacking functional groups of particles gradually decreased with increases in the EGR rate, whereas the contents of the O-containing functional groups and the aliphatic C–H functional group increased with increases in the EGR rate, indicating that EGR promotes increases in the oxidative activity of particles and it is benefit for the regeneration process of filter in DPF, especially for decreasing the regeneration temperature.
The presence of CO2 in the exhaust gas caused the contents of the O-containing and aliphatic C–H functional groups of particles to increase, whereas the contents of the O-lacking functional groups decreased. The presence of N2 had an insignificant impact on the relative contents of the functional groups.
The contents of the O-lacking functional groups increased significantly with increases in the EGR temperature, whereas the contents of the O-containing and aliphatic C–H functional groups all decreased to some extent with increases in the EGR temperature.
Acknowledgements
This study was financially supported by the National Natural Science Foundation of China under Grant (No.51376083 and 51506011), and Basic research project of Suzhou (SYG201515).Notes and references
- K. Heymann, J. Lehmann and D. Solomon, et al., C-1s K-edge near edge X-ray absorption fine structure (NEXAFS) spectroscopy for characterizing functional group chemistry of black carbon, Org. Geochem., 2011, 42, 1055–1064 CrossRef CAS.
- S. Bernard, O. Beyssac and K. Benzerara, et al., Raman and XRD study of anthracene-based cokes and saccharose-based chars submitted to high temperature pyrolysis, Carbon, 2010, 48, 2506–2516 CrossRef CAS.
- J. Song, M. Alam and A. L. Boehman, et al., Examination of the oxidation behavior of biodiesel soot, Combust. Flame, 2006, 146(4), 589–604 CrossRef CAS.
- B. Artur, E. H. Frank and E. K. Kerry, et al., Impact of ferrocene on the structure of diesel exhaust soot as probed with wide-angle X-ray scattering and C(1s) NEXAFS spectroscopy, Carbon, 2006, 44, 2904–2911 CrossRef.
- W. Jiamin, T. Tolek and K. T. Tetsu, Organic carbon distribution, speciation, and elemental correlations within soil microaggregates: Applications of STXM and NEXAFS spectroscopy, Geochim. Cosmochim. Acta, 2007, 71, 5439–5449 CrossRef.
- E. Koivisto, N. Ladommatos and M. Gold, Systematic study of the effect of the hydroxyl functional group in alcohol molecules on compression ignition and exhaust gas emissions, Fuel, 2015, 153, 650–663 CrossRef CAS.
- O. B. Popovicheva, E. D. Kireeva and N. K. Shonija, et al., FTIR analysis of surface functionalities on particle matter produced by off-road diesel engines operating on diesel and biofuel, Environ. Sci. Pollut. Res., 2015, 22, 6–10 CrossRef PubMed.
- S. Paciornik, Multi-scale analysis of the dielectric properties and structure of resin/carbon-black nanocomposites, Eur. Phys. J.: Appl. Phys., 2003, 21(1), 17–26 CrossRef CAS.
- Y. Chen, N. Shah and F. E. Huggins, et al., Characterization of Ambient Airborne Particles by Energy-Filtered Transmission Electron Microscopy, Aerosol Sci. Technol., 2005, 39(6), 509–518 CrossRef CAS.
- K. A. Katrinak, P. Rez and P. R. Buseck, Structural variations in individual carbonaceous particles from an urban aerosol, Environ. Sci. Technol., 1992, 26(10), 1967–1976 CrossRef CAS.
- A. Braun, B. S. Mun and F. E. Huggins, et al., Carbon speciation of diesel exhaust and urban particulate matter NIST standard reference materials with C(1s) NEXAFS spectroscopy, Environ. Sci. Technol., 2007, 41(1), 173–178 CrossRef CAS PubMed.
- A. Braun, A. Kubatova and S. Wirick, et al., Radiation damage from EELS and NEXAFS in diesel soot and diesel soot extracts, J. Electron Spectrosc. Relat. Phenom., 2009, 170(1–3), 42–48 CrossRef CAS.
- J. M. Martin, B. Vacher and L. Ponsonnet, et al., Chemical bond mapping of carbon by image-spectrum EELS in the second derivative mode, Ultramicroscopy, 1996, 65(3), 229–238 CrossRef CAS.
- R. Schneider, J. Woltersdorf and A. Röder, Chemical-Bond Characterization of Nanostructures by EELS[M], Microbeam and Nanobeam Analysis, 1996, pp. 545–552 Search PubMed.
- J. Stöhr, Series in Surface Science, NEXAFS Spectroscopy, Springer, 1992 Search PubMed.
- A. Braun, Carbon speciation in airborne particle matter with C (1s) NEXAFS spectroscopy, J. Environ. Monit., 2005, 7, 1059–1065 RSC.
- A. Braun, F. E. Huggins and N. Shah, et al., The Contribution of C(1s) NEXAFS Spectroscopy to the Understanding of Air Pollution from Diesel Soot and Biomass Smoke[C], Swiss Geoscience Meetig, 2011 Search PubMed.
- S. D. Stasio and A. Braun, Comparative NEXAFS Study on Soot Obtained from an Ethylene/Air Flame, a Diesel Engine, and Graphite, Energy Fuels, 2006, 20(1), 187–194 CrossRef.
- A. Braun, S. Wirick, C. Jacobsen, F. E. Huggins, S. B. Mun, N. Shah, Y. Chen and G. P. Huffman, Advantages of NEXAFS before EELS in carbon analysissComparative study on diesel soot, Carbon, 2005, 43(1), 117–124 CrossRef CAS.
- R. F. Egerton and M. Malac, EELS in the TEM, J. Electron Spectrosc. Relat. Phenom., 2005, 143(2–3), 43–50 CrossRef CAS.
- S. C. B. Myneni and S. C. B. Myneni, Soft X-ray Spectroscopy and Spectromicroscopy Studies of Organic Molecules in the Environment, Rev. Mineral. Geochem., 2002, 49(1), 485–579 CrossRef CAS.
- E. G. Rightor, A. P. Hitchcock and H. Ade, et al., Spectromicroscopy of Poly(ethylene terephthalate):
![[thin space (1/6-em)]](https://www.rsc.org/images/entities/char_2009.gif) Comparison of Spectra and Radiation Damage Rates in X-ray Absorption and Electron Energy Loss, J. Phys. Chem. B, 1997, 101(11), 1950–1960 CrossRef CAS.
Comparison of Spectra and Radiation Damage Rates in X-ray Absorption and Electron Energy Loss, J. Phys. Chem. B, 1997, 101(11), 1950–1960 CrossRef CAS. - X. Tang, X. Bi and Y. Cheng, et al., Study on the size distribution of organic carbon (OC) and elemental carbon (EC) in the aerosol, Res. J. Environ. Sci., 2006, 19(1), 104–108 Search PubMed.
- A. Braun, N. Shan and F. E. Huggins, et al., A study of diesel PM with X-ray microspectroscopy, Fuel, 2004, 83, 997–1000 CrossRef CAS.
- G. D. Cody, H. Ade and S. Wirick, et al., Determination of chemical-structural changes in vitrinite accompanying luminescence alteration using C-NEXAFS analysis, Org. Geochem., 1998, 28(7–8), 441–455 CrossRef CAS.
- C. F. Bohren and D. R. Huffman, Absorption and scattering of light by small particles, Wiley, New York, 1983, vol. 307, pp. 290–291 Search PubMed.
- J. T. Francis and A. P. Hitchcock, Inner-shell spectroscopy of p-benzoquinone, hydroquinone, and phenol: distinguishing quinoid and benzenoid structures, ChemInform, 2002, 23(47), 6598–6610 Search PubMed.
- K. Yehliu, R. L. Vander Wal and O. Armas, et al., Impact of fuel formulation on the nanostructure and reactivity of diesel soot, Combust. Flame, 2012, 159(12), 3597–3606 CrossRef CAS.
- T. Lu, Z. Huang, C. Cheung and J. Ma, Size distribution of EC, OC and particle-phase PAHs emissions from a diesel engine fueled with three fuels, Sci. Total Environ., 2012, 438, 33–41 CrossRef CAS PubMed.
- J. Zhang, K. He, X. Shi and Y. Zhao, Comparison of particle emissions from an engine operating on biodiesel and petroleum diesel, Fuel, 2011, 90, 2089–2097 CrossRef CAS.
- J. Watson, J. Chow and D. Lowenthal, Differences in the carbon composition of source profiles for diesel- and gasoline-powered vehicles, Atmos. Environ., 1994, 28, 2493–2505 CrossRef CAS.
- S. Collura, N. Chaoui, B. Azambre and G. Finqueneisel, et al., Influence of the soluble organic fraction on the thermal behaviour, texture and surface chemistry of diesel exhaust soot, Carbon, 2005, 43, 605–613 CrossRef CAS.
- W. Zhang, W. Wu and G. Chen, et al., Chemical kinetics of the effects of the main components of EGR on n-heptane combustion and emissions, Trans. CSICE, 2015, 33(2), 154–162 Search PubMed.
- J. Zhang, Numerical simulation study on effect of intake conditions on diesel low temperature combustion [D], Tianjin University, Tianjin, 2012 Search PubMed.
| This journal is © The Royal Society of Chemistry 2016 |

