DOI:
10.1039/C6RA08063D
(Paper)
RSC Adv., 2016,
6, 63463-63471
Interaction between carisoprodol and bovine serum albumin and effect of β-cyclodextrin on binding: insights from molecular docking and spectroscopic techniques†
Received
29th March 2016
, Accepted 26th June 2016
First published on 28th June 2016
Abstract
Biomolecular interactions of carisoprodol (CAP) with bovine serum albumin (BSA) have been studied by fluorescence and UV-visible spectroscopy and confirmed by multispectroscopic methods including molecular docking studies. The intrinsic intensity of BSA was quenched by a dynamic quenching mechanism. The binding constant and number of binding sites were calculated according to the Stern–Volmer equation. The effect of β-cyclodextrin on the binding has been studied. Thermodynamic parameters were calculated which reveal the involvement of hydrophobic interactions in the binding. Based on Förster's theory of non-radiation energy transfer, the average binding distance (r) between BSA and CAP was evaluated. Spectral results showed that the binding of CAP to BSA induced conformational changes in BSA. A molecular docking study confirmed the drug binding sites and interaction of CAP with amino acid residues.
Introduction
Drug–protein interactions extensively influence the biological activity of a drug. The design of new drugs depends on the nature of the interactions between the drug molecule and the target protein. Therapeutic effectiveness of drugs depends on their binding ability and the extent of binding of the drug to the organism.
Carisoprodol (N-isopropyl-2-methyl-2-propyl-1,3-propanediol dicarbamate) is a centrally acting muscle relaxant drug for acute painful musculoskeletal treatment (Fig. 1(A)).1 Upon being ingested and metabolized, drugs can have the ability to form substances called metabolites. Similarly, carisoprodol is metabolized to a pharmacologically active compound meprobamate which is indicated for the treatment of anxiety.2 The pharmacological effects of carisoprodol are due to the combination of the effects of carisoprodol and meprobamate. In addition to the desired skeletal muscle-relaxing effects, carisoprodol and meprobamate also produce weak anticholinergic, antipyretic, and analgesic effects.3
 |
| Fig. 1 Chemical structure of drug carisoprodol (CAP) (A) and model structure of bovine serum albumin (BSA) (B) showing the domains and binding sites. | |
Serum albumins are the most abundant plasma proteins found in the circulatory system of wide variety of organisms.4 Bovine serum albumin (BSA) consists of three linearly arranged domains (I–III) that are composed of two subdomains (A and B) (Fig. 1(B)).5 There are two tryptophan residues (Trp134 and Trp213), of which Trp134 is located on the surface of the molecule and Trp213 resides in the hydrophobic pocket. There is evidence of conformational changes of serum albumin induced by its interaction with low molecular weight dyes and drugs, which appear to affect secondary and tertiary structures of proteins.6
β-Cyclodextrin (β-CD), is composed of seven units of D(+)-glucopyranose units joined by α-1,4-glycosidic bonds arranged in a truncated cone-shaped structure.7 As one of the water-soluble cyclic oligosaccharides, it can form inclusion complexes with a large variety of organic and inorganic compounds, which may improve the solubility, stability and bioavailability of guest molecules. As a result, β-CD has been widely applied in food research, organic synthesis, environment protection and especially in the area of pharmacological science.8 β-Cyclodextrins are used as additives with drugs (mixed with drug solution) to improve their stability, solubility and cover up the smell of medicine.
Experimental
Chemicals and reagents
Bovine serum albumin (protease free and essentially α-globulin free) and carisoprodol (CAP) were purchased from Sigma Chemical Company (St. Louis, USA) and used as such. β-Cyclodextrin hydrate was obtained from Alfa Aesar (Ward Hill, Massachusetts). All chemicals were of analytical reagent grade, and Millipore water was used throughout the work. Stock solutions of bovine serum albumin (molecular weight of BSA 65
000) and carisoprodol (CAP) were prepared in phosphate buffer of pH 7.4.
Instrumentation
Double-beam CARY 50-BIO UV-Vis spectrophotometer (Varian, Australia) equipped with a 150 W xenon lamp and a slit width of 5 nm was used for absorption spectral studies. Spectrofluorophotometer (RF-5301 PC) of Model F-2000 (Hitachi, Japan) equipped with a 150 W xenon lamp, 1 cm quartz cell and thermostatic cuvette holder was employed to record steady state fluorescence spectra. System temperature was maintained by recycling water throughout the experiment. Jasco J-715 spectropolarimeter (Tokyo, Japan) was used for circular dichroism (CD) spectral analysis. The pH of the solution was measured using an Elico LI120 pH meter (Elico Ltd., India).
Interaction study of CAP–BSA system by spectrofluorometric method
Reaction mixture containing BSA (40 μM from 250 μM stock) and CAP solution (40 μM from 250 μM stock) were diluted with phosphate buffer (pH 7.4) to make the total volume (2 mL) and mixed by shaking. Keeping BSA concentration constant (5 μM), CAP concentration was varied from 5–45 μM. The spectra were recorded at three different temperatures (288, 298 and 308 K) in the range 300–550 nm upon excitation at 296 nm.
UV-visible spectral studies
UV-vis absorption spectra were recorded in the presence and absence of CAP in the range 200–340 nm. Keeping BSA concentration constant (5 μM), carisoprodol concentration was varied from 5–45 μM.
Effect of some metal ions
Effect of some metal ions, Cu2+, Co2+, Mg2+, Ba2+, Fe2+, Na+, Zn2+, and K+ on the binding constant were recorded in the range 200–400 nm upon excitation at 296 nm. The BSA and metal ion concentration was fixed at 5 μM, while that of CAP concentration was varied from 5–45 μM.
Effect of β-cyclodextrin
The effect of β-cyclodextrin on the binding was studied. Keeping BSA (5 μM) and β-cyclodextrin (5 μM) concentration constant, CAP concentration was varied from 5–45 μM. Fluorescence measurements were recorded in the range 300–450 nm at three different temperatures (288, 298 and 308 K).
Site probes studies
Site probes studies were performed, in order to find out the exact binding site of CAP in BSA. Warfarin, ibuprofen and digitoxin were used as site probes for site I, II and III respectively. Fluorescence spectra were recorded by varying CAP concentration from 5–45 μM and keeping BSA (5 μM) and probe concentration constant (5 μM).
Synchronous fluorescence studies
Synchronous fluorescence spectra were recorded at 298 K using different values of Δλ. Keeping BSA concentration constant (5 μM), CAP concentration was varied from 0–45 μM. The spectra were recorded in the range of 200–550 nm.
Energy transfer between CAP and BSA
Based on Förster's theory of energy transfer, the overlap of the UV-visible absorption spectrum (in the range 240–490 nm) of CAP with the fluorescence emission spectrum of BSA (in the range 300–500 nm) was used to calculate the energy transferred between CAP and BSA.
3D fluorescence spectral studies
The 3D fluorescence spectra for CAP–BSA system were performed in the presence and absence of CAP at an excitation wavelength range of 200–350 nm and emission wavelength range of 200–600 nm upon excitation at 296 nm and emission at 340 nm.
Circular dichroism (CD) spectral study
The CD spectral studies for BSA (10 μM) were recorded in the presence and absence of CAP in the range of 200–260 nm. The BSA to CAP concentration was varied in the ratio 1
:
0, 1
:
4 and 1
:
6 at room temperature.
Resonance Rayleigh scattering spectral study
Resonance Rayleigh scattering (RRS) spectra for BSA–CAP system were recorded by means of synchronous scanning at Δλ = 0 (λem = λex) through the wavelength range of 200–800 nm.
Molecular docking using surflex-dock
Molecular docking was performed with Surflex-Dock9 program that is interfaced with Sybyl-X 2.0. The crystal structure of bovine serum albumin (PDB entry code 3V03) was extracted from the Brookhaven Protein Database (PDB: http://www.rcsb.org/pdb).10 All the hydrogen atoms were added to define the correct configuration and tautomeric states. Then the modeled protein structure was energy-minimized using Tripos force field with distance dependent dielectric function. Partial atomic charges were calculated by AMBER7F9902 method and finally water molecules were removed from the model. The geometry of the each CAP molecule in the data set was subsequently optimized to minimum energy using the Powell energy minimization algorithm, Tripos force field with Gasteiger-Hückel charges. Carisoprodol was then separately docked into the binding pocket for docking-scoring analysis. To identify the ligand–protein interactions, the top pose and protein were loaded into work area and the MOLCAD (Molecular Computer Aided Design) program was employed to visualize the binding mode between the protein and ligand.
Results and discussion
Biomolecular interaction between BSA and CAP
Fluorescence spectral study is a sensitive tool to explore the conformation changes in protein upon binding. Binding studies of BSA with carisoprodol was studied by fluorescence quenching method.11 Intrinsic fluorescence intensity of the BSA was recorded before and after addition of CAP.
A decrease in fluorescence intensity of BSA was observed when concentration of carisoprodol was varied (5–45 μM), keeping BSA concentration constant (5 μM) (Fig. 2). There are two types of quenching mechanisms viz., dynamic quenching and static quenching, which can be differentiated by their dependence of binding constant values on temperature. Binding constant value decrease in static quenching mechanism, due to the reduction in the stability of the complex with increase in temperature. In contrary to this, binding constant values increases in dynamic quenching mechanism, due to the increase in the number of collisions with increasing temperature.12 The obtained fluorescence data were subjected to Stern–Volmer analysis, according to eqn (1);
|
 | (1) |
where
Fo and
F are the steady state fluorescence intensities of BSA in the absence and presence of the quencher, respectively.
KSV is the Stern–Volmer quenching constant,
Kq is the quenching rate constant of the biomolecule and [Q] is the concentration of the quencher (CAP). The values of
KSV and the correlation coefficient (
R2) were determined at three different temperatures and are reported in
Table 1.
Γo is the average lifetime of the biomolecule without quencher. The value of
Γo of the biopolymer
13 is 10
−8 s
−1. Using slope of the Stern–Volmer plot of
Fo/
F vs. [Q], the values of
Kq and
KSV were calculated (
Fig. 3).
KSV values increased with increasing temperature which reveals that the quenching process was dynamic rather than static.
 |
| Fig. 2 Fluorescence spectra of BSA (5 μM) in presence of carisoprodol (a) 0 μM, (b) 5 μM, (c) 10 μM, (d) 15 μM, (e) 20 μM, (f) 25 μM, (g) 30 μM, (h) 35 μM, (i) 40 μM and (j) 45 μM. | |
Table 1 Stern–Volmer quenching constant (KSV), binding constant (KA) and relative thermodynamic parameters of the CAP–BSA system
Temperature (K) |
KSV × 10−3 (L mol−1) |
Kq × 10−11 (L mol−1 s−1) |
(R2) |
Binding constant, KA × 10−3 (L mol−1) |
Number of binding sites (n) |
ΔHo (kJ mol−1) |
ΔSo (J K−1 mol−1) |
ΔGo (kJ mol−1) |
288 |
3.87 |
3.87 |
0.994 |
2.40 |
0.960 |
|
|
−19.5 |
298 |
5.03 |
5.03 |
0.998 |
5.75 |
1.017 |
49.30 |
235.0 |
−21.4 |
308 |
9.84 |
9.84 |
0.995 |
8.91 |
0.991 |
|
|
−21.8 |
 |
| Fig. 3 Stern–Volmer curves for the binding of carisoprodol with BSA at 308 K (a), 298 K (b), 288 K (c); λex = 296 nm; λem = 340 nm; [BSA] = 5 μM, [CAP] = 5–45 μM. | |
Analysis of binding equilibria
In the dynamic quenching mechanism, it is assumed that, when small molecules bind independently to a set of equivalent sites on a macromolecule, the equilibrium between free and bound molecules14 is represented by eqn (2); |
 | (2) |
where KA and n are binding constant and the number of binding sites respectively. A plot of log[(Fo − F)/F] vs. log[Q] gives a straight line (Fig. 4), from the intercept and slope of this plot binding constant (KA) and the number of binding sites (n) were calculated. The binding studies were carried out at 288, 298 and 308 K and the values are given in Table 1. It was observed that the binding constant (KA) values increased with increase in temperature. The value of n is equal to 1, which indicated that there is one independent class of binding site on BSA for CAP.
 |
| Fig. 4 The plot of log(Fo − F)/F vs. log[Q] for quenching of BSA by CAP at 288 K (a), 298 K (b), 308 K (c); λex = 296 nm; λem = 340 nm; [BSA] = 5 μM, [CAP] = 5–45 μM. | |
Site marker competitive experiments
BSA is composed of three homologous domains named I, II and III (each domain consists of two sub-domains called A and B). The main regions of ligand-binding sites on albumin are located in the hydrophobic cavities in sub-domains IIA and IIIA, which exhibit similar chemical properties. The binding cavities associated with sub-domains IIA and IIIA are also referred to as site I and site II. As per Sudlow et al.15 and Sjoholm et al.;16 different binding site competitor's viz., warfarin, ibuprofen and digitoxin are used for site I, II and III respectively.
Here, BSA and site probe concentration was held in the ratio 1
:
1 (5 μM) with varying concentration of CAP (5–45 μM). A shift in λmax of BSA was observed in the presence of warfarin (Fig. 5(A)). This indicates that, the BSA–CAP binding was affected by warfarin. Whereas wavelength shift was not observed in the presence of ibuprofen and digitoxin and fluorescence intensity was nearly same as that of BSA–CAP complex indicating that, both had negligible effect on the binding (Fig. 5(B)). The binding constant values for different site probes are given in Table 2. The binding constant value decreased remarkably in the presence of warfarin while this value remained almost same for ibuprofen and digitoxin which supports the above observation. Hence CAP binds to site I of BSA, which is located in the hydrophobic pocket of subdomain IIA.
 |
| Fig. 5 Influence of site probes on the fluorescence of BSA–CAP system; (A) [BSA] = 5 μM (a); [warfarin] = 5 μM (b); [CAP] = 5–45 μM (c–k); (B) [BSA] = 5 μM (a); [ibuprofen] = 5 μM (b); [CAP] = 5–45 μM (c–k). | |
Table 2 Comparison of binding constants of carisoprodol–BSA before and after addition of site probes (warfarin, ibuprofen and digitoxin); [BSA] = 5 μM, [probe] = 5 μM and [CAP] = 5–45 μM
System |
Binding constant KA × 10−3 (L mol−1) |
BSA + CAP |
5.75 |
BSA + CAP + warfarin |
3.31 |
BSA + CAP + ibuprofen |
5.52 |
BSA + CAP + digitoxin |
5.02 |
Thermodynamic parameters and binding mode
Hydrogen bonds, electrostatic interactions, hydrophobic interactions and van der Waals attractions are the four types of binding modes through which the small molecules binds to macromolecules. Thermodynamic parameters (ΔHo, ΔSo and ΔGo) are the main evidences for confirming the binding mode17 and these are evaluated using the following eqn (3) and (4): |
 | (3) |
where KA and R are the binding constant and gas constant, respectively. From the plot of log
KA versus 1/T, the values of ΔHo and ΔSo were determined. The free energy change (ΔGo) was calculated using eqn (4) and corresponding results are reported in Table 1.
Binding mode confirmation: usually, positive values of ΔHo and ΔSo imply a hydrophobic association; negative values of ΔHo and ΔSo reflect the van der Waals forces or hydrogen bond formation and negative values of ΔHo and, positive values of ΔSo suggests involvement of electrostatic force in the interaction.18 In the present study, both ΔHo and ΔSo have positive value, which indicates the involvement of hydrophobic interactions and negative value of ΔGo indicates involvement of spontaneous reactions in the binding (Table 1).
Energy transfer between CAP and BSA
Using fluorescence resonance energy transfer (FRET), the distance between protein residue (donor) and the bound drug (acceptor) can be determined.19 Since BSA has two tryptophan residues (Trp-135 and Trp-214), the distance ‘r’ was calculated by taking the average value among the bound CAP and the two tryptophan residues.20 Generally FRET occurs whenever the emission spectrum of a fluorophore (BSA) overlaps with the absorption spectrum of quencher (CAP) (Fig. 6). The distance between the donor and acceptor and extent of spectral overlap determines the amount of energy transferred.
 |
| Fig. 6 The overlap fluorescence spectrum of BSA (a) and absorbance spectrum of carisoprodol (b) [λex = 296 nm, λem = 340 nm, c(BSA)/c(CAP) = 1 : 1]. | |
The energy transfer effect is related not only to the distance between the acceptor and the donor, but also on the critical energy transfer distance (Ro). According to Förster's non-radiative energy transfer theory,21 the energy transfer efficiency (E) was calculated using the eqn (5):
|
 | (5) |
where
F and
Fo are fluorescence intensities of BSA in presence and absence of carisoprodol,
r is the distance between acceptor and donor and
Ro is the critical energy transfer distance when transfer efficiency is 50%. The value of
Ro was evaluated using the
eqn (6):
|
Ro6 = 8.8 × 10⁻²⁵k2N−4ΦJ
| (6) |
where
k2 is spatial orientation factor of the dipole,
N is refractive index of the medium,
Φ is the fluorescence quantum yield of the donor.
J is the overlap integral of the fluorescence emission spectrum of donor and absorption spectrum of the acceptor which given by,
|
 | (7) |
where
F(
λ) is the fluorescence intensity of the fluorescent donor of wavelength
λ,
ε(
λ) is the molar absorption coefficient of the acceptor at wavelength
λ. In the present case,
22 k2 = 2/3,
N = 1.336 and
Φ = 0.15. From
eqn (5)–(7), the value of overlap integral (
J) was calculated as
J = 1.15 × 10
−14 cm
3 L mol
−1. The values of
Ro,
E and
r were found to be 2.62 nm, 0.028 and 4.70 nm respectively. An essential criterion for energy transfer to take place is that the distance between donor and acceptor must be within 2–8 nm.
23 This criterion is satisfied in the present study and hence quenching of Try fluorescence of BSA in the presence of the probe is attributed to energy transfer. The shorter distance between the bound CAP and Try residues in the proposed study suggested the significant interaction between CAP and BSA.
Binding studies using UV-vis absorption spectra
UV-vis absorption study is the reliable way to determine the complex formation and to know the change in hydrophobicity during the interaction.24 Maximum ‘λ’ value of BSA observed at around 280 nm was mainly due to the presence of tryptophan and tyrosine residues in BSA. It is evident from Fig. 7 that the absorption intensity of BSA increased regularly with increasing concentration of carisoprodol.
 |
| Fig. 7 Absorption spectra of BSA and BSA–CAP system. [BSA] = 5 μM (a) and [CAP] = 5 μM (b), 10 μM (c), 15 μM (d), 20 μM (e), 25 μM (f), 30 μM (g), 35 μM (h), 40 μM (i) and 45 μM (j). | |
Effect of metal ions on CAP–BSA binding
Metal ions, especially the bivalent ions which are present in blood plasma, are vital to the human body and exhibit a structural role for many proteins based on coordinate bonds. Protein molecules contain the elements C, H, O and N and some also contain S and/or P. In addition, some trace metal ions exist in the organism, have a definite ability to bind with proteins.25,26 It is reported that Cu2+, Zn2+, Ni2+, Co2+ and Ca2+ and other metal ions can form complexes with serum albumins.27 Hence, the effect of some common metal ions such as, Cu2+, Co2+, Mg2+, Ba2+, Fe2+, Na+, Zn2+, and K+ on the binding was studied. The binding constant values in presence of above ions are given in Table 3. The binding constant values decreased in the presence of Co2+, Mg2+, Ba2+, K+ and Cu2+, this would shorten the storage time of the drug in blood plasma and more amount of free drug would be available.28 This led to the need for more doses of the drug to achieve the preferred therapeutic effect. The binding constant values increased in the presence of Zn2+ and Fe2+ thereby indicating the strong binding between the CAP and BSA and availability of more of the drug for action. This led to the need of smaller dose of the drug. The presence of Na+ ion did not showed any significant effect on the binding.
Table 3 Effect of some common metal ions on binding constant of BSA–CAP system [BSA] = 5 μM, [metal ion] =5 μM and [CAP] = 5–45 μM
Systems (common ions) |
Binding constant (KA) (L mol−1) |
BSA + CAP |
5.75 × 10³ |
BSA + CAP + Zn2+ |
7.40 × 10³ |
BSA + CAP + Mg2+ |
1.65 × 10³ |
BSA + CAP + Co2+ |
0.95 × 10³ |
BSA + CAP + Cu2+ |
1.03 × 10³ |
BSA + CAP + Ba2+ |
1.67 × 10³ |
BSA + CAP + Fe2+ |
9.12 × 10³ |
BSA + CAP + Na+ |
5.52 × 10³ |
BSA + CAP + K+ |
1.26 × 10³ |
Influence of β-cyclodextrin on CAP–BSA binding
Effect of inclusion compound β-cyclodextrin on CAP–BSA binding was studied, with varying concentrations of CAP (5–45 μM), keeping BSA and β-cyclodextrin concentration constant (5 μM each) (Fig. S1†). The fluorescence intensity of BSA slightly increases with the addition of β-CD. The fluorescence data were analysed using Stern–Volmer eqn (1) as shown in Fig. S2.† The Stern–Volmer quenching constant (KSV) and binding constant (KA) in the presence of β-CD are given in Table 4. The smaller values of binding constant in the presence β-CD, suggests that the β-CD molecule encapsulates the CAP molecule and blocks it from direct collision with Trp residues in the binding pocket of BSA.29 It also means CAP was gradually removed from β-CD by BSA to bind with protein to perform its medicinal effect.30 Thus, β-CD might be applied in CAP dosage without any side effect. The entropy change (ΔSo) enumerated in Table 4 is 266 J K−1 mol−1, which indicates that this inclusion interaction is spontaneous. In other words, β-CD acts as a potential controlled releaser for CAP from the perspective of thermodynamics.
Table 4 Stern–Volmer quenching constant (KSV), binding constant (KA) and thermodynamic parameters of the CAP–BSA–β-CD system
Temperature (K) |
KSV × 10−3 (L mol−1) |
Kq × 10−11 (L mol−1 s−1) |
(R2) |
Binding constant, KA × 10−3 (L mol−1) |
Number of binding sites (n) |
ΔHo (kJ mol−1) |
ΔSo (J K−1 mol−1) |
ΔGo (kJ mol−1) |
288 |
4.65 |
4.65 |
0.983 |
1.58 |
0.900 |
|
|
−19.5 |
298 |
6.45 |
6.45 |
0.997 |
2.51 |
0.901 |
59.0 |
266 |
−20.4 |
308 |
8.40 |
8.40 |
0.999 |
7.94 |
1.027 |
|
|
−20.8 |
Conformational studies
Synchronous fluorescence studies (SFS)
Synchronous fluorescence spectroscopy is a useful technique to investigate the conformational changes in protein by measuring the possible shift in maximum emission wavelength. This involves the simultaneous scanning of excitation and emission monochromators of a fluorimeter maintaining a fixed wavelength difference31 (Δλ). The synchronous fluorescence intensity of BSA was recorded before and during the addition of the drug. When the difference in wavelength (Δλ) between excitation and emission wavelength was fixed at 15 nm and 60 nm (Δλ = λemission − λexcitation), the SFS gave the characteristic information about tyrosine and tryptophan residues, respectively.32
Synchronous fluorescence spectrum of BSA–CAP system is given in Fig. 8(A) and (B) for Δλ = 60 and 15 nm. When Δλ = 15 nm, the emission wavelength represents a negligible shift for tyrosine residue indicates that the BSA conformation was unchanged around tyrosine residue. Whereas a slight blue shift was observed at Δλ = 60 nm, which indicates the change in the microenvironment around tryptophan residue.
 |
| Fig. 8 Synchronous fluorescence spectrum of BSA–CAP (T = 298 K, pH 7.40), (A) Δλ = 15 nm, (B) Δλ = 60 nm. (a) [BSA] = 5 μM; (b) [CAP] = 5 μM, (c) 10 μM, (d) 15 μM, (e) 20 μM, (f) 25 μM, (g) 30 μM, (h) 35 μM, (i) 40 μM and (j) 45 μM. | |
3D fluorescence spectroscopy
The 3D spectroscopy is used to study the interaction between drugs and biomolecules. The counter map in 3D spectrum provides a lot of important information regarding the structural and conformational changes of proteins. In the present work, the conformational changes of BSA induced by CAP have been investigated by 3D fluorescence spectroscopy. The maximum emission wavelength and the fluorescence intensity of the residues have a close relation to the polarity of their micro-environment.33 The conformational and micro environmental changes of BSA were investigated by comparing their spectral characteristics in the absence and presence of CAP (Fig. 9(A) and (B)). Peak ‘a’ denotes the Rayleigh scattering peak (λex = λem), where as strong peak ‘b’ reveals the spectral characteristics of Trp and Tyr residues on proteins.
 |
| Fig. 9 Three dimensional (3D) fluorescence spectra of BSA (A) and BSA + CAP (B) systems. | |
In the present study, the fluorescence intensity of peak ‘a’ increased with the addition of CAP due to the formation of CAP–BSA complex (Fig. 9(B)). So the diameter of the macromolecule increased and resulted in the enhancement of scattering effect.34 The fluorescence intensity of peak ‘b’ decreased noticeably with the addition of CAP. Analyzing the intensity changes of peak ‘a’ and peak ‘b’ revealed that the binding of CAP to BSA induced some conformational changes in BSA.
CD spectroscopy studies
Circular dichroism is a convenient technique for detecting and monitoring the extent of conformational changes that is associated with the activity of a protein. The CD spectra of the BSA exhibited two negative bands in UV region at 208 and 222 nm. Addition of CAP decreases the ellipticity at these wavelengths without any considerable shift in the peaks (Fig. 10). This indicates that the secondary structure of BSA was predominantly α-helical even after the binding and also indicates that binding with CAP induces some alteration in the secondary structure of BSA. The results are expressed in terms of mean residue ellipticity (MRE) in deg cm2 dmol−1 as given in eqn (8); |
 | (8) |
where Cp is the molar concentration of the protein, n is the number of amino acid residues, and l is the path length. |
 | (9) |
where MRE208 is the observed MRE value at 208 nm; 4000 is the MRE of the α-form and random coil conformation cross at 208 nm, and 33
000 is the MRE value of a pure α-form at 208 nm. Using eqn (9) the percentage of α-helicity in the secondary structure of the BSA was calculated. The α-helical content of protein decreased from 56.08% in free BSA to 48.08% in bound BSA (at 1
:
4 ratio of BSA to CAP). The CD spectra of BSA in the presence and absence of CAP were observed to be similar in shape, indicating thereby that the structure of BSA was predominantly α-helical even after binding with drug.35
 |
| Fig. 10 CD spectra of (a) BSA (10 μM) in presence of (b) 40 μM and (c) 60 μM of carisoprodol. | |
Resonance Rayleigh scattering spectroscopic studies
Resonance Rayleigh scattering (RRS) is a special scattering produced when the wavelength of Rayleigh scattering (RS) is located at or close to its molecular absorption band. RRS is used to study the interaction of biological macromolecule and the molecular recognition. It is very sensitive to the interactions caused by weak binding forces such as intermolecular electrostatic attraction, hydrogen bonding and hydrophobic interactions.36 The RRS spectra of BSA and CAP–BSA were recorded by synchronous scanning from 200 to 800 nm with Δλ = 0 nm. The spectra were shown in Fig. 11. The RRS intensities of BSA were weak in absence of carisoprodol, and a sudden increase in intensity was observed after the addition of CAP, which indicates the interaction of BSA with CAP. This is probably due to larger size of CAP–BSA particles than that of BSA and formation of BSA–CAP ground state complex.
 |
| Fig. 11 The effect of carisoprodol on the RRS spectra of BSA–CAP system. [BSA] = 5 μM (a) and [CAP] = 5 μM (b), 10 μM (c), 15 μM (d), 20 μM (e), 25 μM (f). | |
Molecular docking for CAP–BSA binding study
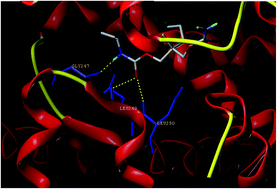
Surflex-docking was employed to understand the interaction between BSA and CAP and to elucidate the binding mechanism. Results obtained by surflex-docking tools presented twenty conformations of CAP. We selected the best conformation for further analysis, owing to its higher binding affinity (3.00 kcal mol−1) and lowest molecular energy. Fig. 12(A) and (B) shows the best docked confirmations of CAP involving three H-bonds, oxygen at CO–NH making two H-bonds with Leu249 (C
O⋯H-Leu249, 2.33 Å) and Leu250 (C
O⋯H-Leu250, 2.26 Å) that of hydrogen of NH making H-bond with Gly247 (NH⋯O-Gly247, 2.01 Å). Fig. 12(C) shows the CAP surrounded with hydrophobic amino acids (Val23, Phe19, Phe102, Leu249, Leu250, Phe11, Leu69, Ala50, Ile7, Ala8) and Fig. 12(D) represents the binding domain for CAP at the active site of BSA (chain A). The principal ligand binding site on BSA is located in the hydrophobic cavities in subdomains IIA and IIIA, which are consistent with sites I and II, which plays an important role in the transportation of drugs in BSA. It is important to note that Leu249, Leu250 and Gly247 are in subdomain IIA. The H-bonding interactions and surrounded hydrophobic amino acids indicate that the binding location was Sudlow's site I in subdomain IIA.
 |
| Fig. 12 Interactions between the BSA and CAP in the docked model (A), 3D representation of hydrogen bond interactions (B), hydrophobic amino acids surrounded to CAP (C), and binding domain for CAP at BSA (chain A) (D). | |
Conclusions
Biomolecular interaction study of muscle relaxant drug carisoprodol with bovine serum albumin has been studied using fluorescence emission, UV-visible, 3D, synchronous fluorescence, CD and molecular docking techniques. Carisoprodol quenches the intrinsic fluorescence of BSA through a dynamic quenching mechanism. Thermodynamic parameters show that, hydrophobic interactions played major role in the binding of CAP to BSA. Results showed that the carisoprodol bound to site I of BSA, which is located in the hydrophobic pocket of subdomain IIA. The distance between donor and acceptor was obtained based on fluorescence resonance energy transfer. Effect of inclusion compound, β-cyclodextrin on CAP–BSA interaction was studied, in which β-cyclodextrin encapsulates carisoprodol molecule. Three dimensional and CD spectra showed that the conformation and micro-environment of BSA had changed because of the binding of CAP. Molecular docking study suggested that CAP can bind in the large hydrophobic cavity of subdomain IIA, mainly by the hydrophobic interaction and also by hydrogen bond formation.
Acknowledgements
One of the authors, Mallavva B. Bolattin gratefully acknowledges the University Grants Commission (UGC), New Delhi for the award of “Research Fellowship in Science for Meritorious Students”(RFSMS) (Award Letter No: KU/Sch/RFSMS/2013-14/672). The authors also thank the Chairman, Department of Molecular Biophysics, Indian Institute of Science, Bangalore for CD measurement facilities and Dr V. H. Kulkarni, Principal, S.E.T's College of Pharmacy, Dharwad for docking studies.
References
- F. Berger, M. Kletzkin, B. Ludwig and S. Margolin, Ann. N. Y. Acad. Sci., 1959, 86, 90–107 CrossRef.
- P. D. R. Staff, Physicians' Desk Reference, Medical Economics company, Inc., Montvale, NJ, 54th edn, 2000 Search PubMed.
- D. Goldberg, Mil. Med., 1969, 134, 597–601 CAS.
- J. B. Xiao, J. Shi, H. Cao, S. D. Wu, F. L. Ren and M. Xu, J. Pharm. Biomed. Anal., 2007, 45, 609–615 CrossRef CAS PubMed.
- D. C. Carter and J. X. Ho, Adv. Protein Chem., 1994, 45, 53–203 CrossRef.
- S. H. Lee, J. K. Suh and M. Li, Bull. Korean Chem. Soc., 2003, 24, 45–48 CrossRef CAS.
- J. Szejtli, Cyclodextrine Technology, Kluwer Academic Publishers, Dodrecht, Netherlands, 1988, pp. 143–154 Search PubMed.
- H. Zhang, X. Huang, P. Mei, K. Li and C. Yan, J. Fluoresc., 2006, 16, 287–294 CrossRef CAS PubMed.
- Tripos International, Sybyl-X 2.0, Tripos International, St. Louis, MO, USA, 2012 Search PubMed.
- K. A. Majorek, P. J. Porebski, A. Dayal, M. D. Zimmarman, K. Jablonska, A. J. Stewart, M. Chruszcz and W. Minor, Mol. Immunol., 2012, 52, 174–182 CrossRef CAS PubMed.
- R. K. Nanda, N. Sarkar and R. Banerjee, J. Photochem. Photobiol., A, 2007, 192, 152–158 CrossRef CAS.
- J. R. Lakowicz, Principles of Fluorescence Spectroscopy, Springer, New York, 3rd edn, 2006 Search PubMed.
- J. G. Xu and Z. B. Wang, Methods of Fluorescence Analysis, Science Press, Beijing, 3rd edn, 2006 Search PubMed.
- J. R. Lakowicz, Fluorescence Quenching: Theory and Applications, Principles of Fluorescence Spectroscopy, Kluwer Academic/Plenum Publishers, New York, 1999, pp. 53–127 Search PubMed.
- G. Sudlow, D. J. Birkett and D. N. Wade, Mol. Pharmacol., 1976, 12, 1052–1061 CAS.
- I. Sjoholm, B. Ekman, A. Kober, I. L. Pahlman, B. Seiving and T. Sjodin, Mol. Pharmacol., 1979, 16, 767–777 CAS.
- J. Xiao, J. Shi, H. Cao, S. Wu, F. Ren and M. Xu, J. Pharm. Biomed. Anal., 2007, 4, 609–615 CrossRef PubMed.
- P. D. Ross and S. Subramanian, Biochemistry, 1981, 26, 3096–3102 CrossRef.
- T. Forster, Discuss. Faraday Soc., 1959, 27, 7–17 RSC.
- L. Jiaquin, T. Jianniao, J. Zhang, Z. Hu and C. Xingguo, Anal. Bioanal. Chem., 2003, 376, 864–867 CrossRef PubMed.
- T. Forster, in Modern Quantum Chemistry, ed. O. Sinanoglu, Academic Press, New York, 1996, vol. 3 Search PubMed.
- F. L. Cui, J. Fan, D. L. Ma, M. C. Liu, X. G. Chen and Z. D. Hu, Anal. Lett., 2003, 36, 2151–2166 CrossRef CAS.
- B. Valeur and J. C. Brochon, New Trends in Fluorescence Spectroscopy, Springer Press, Berlin, 2001 Search PubMed.
- H. Yan-Jun, Y. Liu, W. J. Bo, X. X. He and Q. S. Sheng, J. Pharm. Biomed. Anal., 2004, 36, 915–919 CrossRef PubMed.
- W. Y. He, Y. Li, J. N. Tian, H. X. Liu, Z. D. Hu and X. G. Chen, J. Photochem. Photobiol., A, 2005, 174, 53–61 CrossRef CAS.
- H. Liang, J. Huang, C. Q. Tu, M. Zhang, Y. Q. Zhou and P. W. Shen, J. Inorg. Biochem., 2001, 85, 167–171 CrossRef CAS PubMed.
- G. Zhang, Y. Wang, H. Zhang, S. Tang and W. Tao, Pestic. Biochem. Physiol., 2007, 87, 23–29 CrossRef CAS.
- W. He, Y. Li, C. Xue, Z. Hu, X. Chen and F. Sheng, Bioorg. Med. Chem., 2005, 13, 1837–1845 CrossRef CAS PubMed.
- S. Natesan, C. Sowrirajan, P. Dhanraj and I. V. M. V. Enoch, Bull. Korean Chem. Soc., 2014, 35, 2114–2122 CrossRef CAS.
- H. X. Zhang, X. Huang and M. Zhang, J. Fluoresc., 2008, 18, 753–760 CrossRef CAS PubMed.
- J. Zhoua, X. Wu, X. Gu, L. Zhou, K. Song, S. Wei, Y. Feng and J. Shen, Spectrochim. Acta, Part A, 2009, 72, 151–155 CrossRef PubMed.
- P. Mandal and T. Ganguly, J. Phys. Chem. B, 2009, 113, 14904–14913 CrossRef CAS PubMed.
- G. Zhang, Q. Que, J. Pan and J. Guo, J. Mol. Struct., 2008, 881, 132–138 CrossRef CAS.
- F. F. Tian, F. L. Jiang, X. L. Han, C. Xiang, Y. S. Ge, J. H. Li, Y. Zhang, R. Li, X. L. Ding and Y. Liu, J. Phys. Chem. B, 2010, 114, 14842–14853 CrossRef CAS PubMed.
- H. Yan-Jun, L. Yi, S. Xue-Song, F. Xian-Yang and Q. Song-Sheng, J. Mol. Struct., 2005, 738, 145–149 Search PubMed.
- T. Madrakian, H. Bagheri, A. Afkhami and M. Soleimani, J. Lumin., 2014, 155, 218–225 CrossRef CAS.
Footnote |
† Electronic supplementary information (ESI) available. See DOI: 10.1039/c6ra08063d |
|
This journal is © The Royal Society of Chemistry 2016 |
Click here to see how this site uses Cookies. View our privacy policy here.