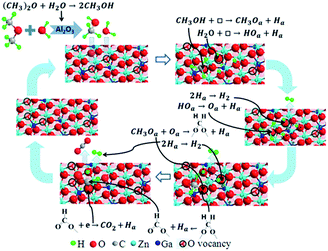
Dimethyl ether steam reforming to produce H2 over Ga-doped ZnO/γ-Al2O3 catalysts†
Shuang Zhou,
Kui Ma,
Ye Tian*,
Ming Meng,
Tong Ding,
Yuqing Zha,
Tianyong Zhang and
Xingang Li*
Collaborative Innovation Center of Chemical Science and Engineering (Tianjin), Tianjin Key Laboratory of Applied Catalysis Science and Technology, School of Chemical Engineering, Tianjin University, Tianjin 300072, China. E-mail: xingang_li@tju.edu.cn; tianye@tju.edu.cn
First published on 23rd May 2016
Abstract
Herein, we report the performance of a series of gallium-doped zinc oxide (GDZ) catalysts mechanically mixed with γ-Al2O3 (GDZ/γ-Al2O3) for the dimethyl ether (DME) steam reforming (SR) to produce H2. Compared with the ZnO catalyst mechanically mixed with γ-Al2O3, the doping of ZnO with gallium can significantly improve the conversion of DME and the yield of hydrogen. The catalyst with a Zn![[thin space (1/6-em)]](https://www.rsc.org/images/entities/char_2009.gif) :
:![[thin space (1/6-em)]](https://www.rsc.org/images/entities/char_2009.gif) Ga molar ratio of 9
Ga molar ratio of 9![[thin space (1/6-em)]](https://www.rsc.org/images/entities/char_2009.gif) :
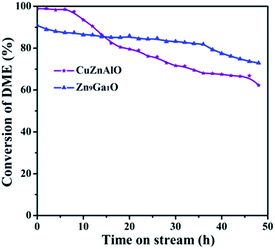
:![[thin space (1/6-em)]](https://www.rsc.org/images/entities/char_2009.gif) 1 has the highest conversion of DME (95.4%) and yield of hydrogen (95.0%) at 450 °C. The carbon dioxide selectivity of GDZ/γ-Al2O3 catalysts is higher than 95%, which is much higher than that of the CuZnAlO/γ-Al2O3 catalyst. Moreover, the GDZ/γ-Al2O3 catalysts have better stability than the CuZnAlO/γ-Al2O3 catalyst. Doping of ZnO with gallium generates a large number of oxygen vacancies on the catalyst, which is beneficial to the DME SR reaction. Our results indicate that HCOO– is an intermedium of DME SR over GDZ/γ-Al2O3 catalysts, and the transformation from HCOO– to CO2 is the rate-controlling step. The results of conductivity indicate that the rate-controlling step is an n-type reaction.
1 has the highest conversion of DME (95.4%) and yield of hydrogen (95.0%) at 450 °C. The carbon dioxide selectivity of GDZ/γ-Al2O3 catalysts is higher than 95%, which is much higher than that of the CuZnAlO/γ-Al2O3 catalyst. Moreover, the GDZ/γ-Al2O3 catalysts have better stability than the CuZnAlO/γ-Al2O3 catalyst. Doping of ZnO with gallium generates a large number of oxygen vacancies on the catalyst, which is beneficial to the DME SR reaction. Our results indicate that HCOO– is an intermedium of DME SR over GDZ/γ-Al2O3 catalysts, and the transformation from HCOO– to CO2 is the rate-controlling step. The results of conductivity indicate that the rate-controlling step is an n-type reaction.
1. Introduction
The increasing consumption of fossil fuels inevitably leads to both energy shortage and various environmental pollutions. So, the exploration and application of new clean energies are becoming more and more important. In recent years the fuel cells using H2 as an energy source, such as the proton exchange membrane fuel cells (PEMFCs), have attracted a lot of attention due to their multiple advantages, e.g. high energy density, rapid start response, compact size and zero pollution.1 To more cleanly and efficiently use the limited fossil fuels, the traditional fuels including hydrocarbons, alcohols and ethers are often converted to hydrogen through reforming processes. Among the reported reforming techniques, steam reforming (SR) operating at relatively low temperatures can generate more H2 due to the efficient utilization of the hydrogen element in water. For instance, the dimethyl ether steam reforming (DME SR) can generate 6 times molar amounts of H2 per molar DME, as described in eqn (1):| (CH3)2O + 3H2O (g) → 6H2 + 2CO2, ΔH298 = 135 kJ mol−1 | (1) |
As a H2 carrier material, DME possesses a lot of advantages, such as high H/C ratio, high energy density, no toxicity and no C–C bonds in DME molecule. The absence of C–C bonds in DME greatly decreases the carbon deposition on catalysts during DME SR. All of these advantages make DME SR technique very promising in areas of onboard hydrogen production. The DME SR reaction consists of two successive steps, namely DME hydrolysis to methanol (DME H) and methanol steam reforming (MSR) as expressed in eqn (2) and (3), respectively.
| (CH3)2O + H2O (g) → 2 CH3OH, ΔH298 = 37 kJ mol−1 | (2) |
| CH3OH + H2O → 3H2 + CO2, ΔH298 = 49 kJ mol−1 | (3) |
The DME hydrolysis is catalyzed by solid acid catalysts, such as bayerite-derived Al2O3, γ-Al2O3, ZSM-5, H-mordenite and TiO2. The alumina-based solid acid catalysts show higher catalytic stability than the zeolite-based ones, since the strong acidity of zeolites can readily lead to the formation of coke, and decrease the activity and durability of the catalysts.2–4
The MSR reaction requires redox catalysts, such as copper and zinc-based catalysts, especially the Cu-containing one.5–9 Our previous work has reported that the CuZnAl1−xMxO (M = Zr or Ce) catalysts were active for MSR during DME SR.5,6 The partial substitution of Al by Zr or Ce can increase the dispersion of copper species, improve the reducibility of the catalysts, and inhibit the sintering of Cu crystallites in the DME SR reaction.5,6 Shimoda et al. reported that the CuFe2O4 spinel mixed with γ-Al2O3 exhibited high activity and stability for DME SR because of formation of a new active phase of Cu–Fe–AlO4 for the MSR step.7 Although the reported Cu-based catalysts displayed high performance for DME SR, they also had some shortcomings, such as high CO selectivity, low thermal stability and short catalyst durability. Thus, it is necessary to develop copper-free catalyst systems for DME SR.
In methanol conversion reactions the CO2 selectivity was highly related to the oxidation of formaldehyde. The literature reported that zinc oxide without copper was a good CO2-selective catalyst in MSR, which gave the CO2 selectivity as high as 95–99.6%.10 ZnO was beneficial to oxidization of the formaldehyde and the formaldehyde-derived intermediates toward CO2, resulting in the high CO2 selectivity.10 However, another study reported that considerable amounts of CH4 and CO could be identified during DME SR over ZnO–Al2O3 catalysts by a co-precipitation method. The presence of vast Al3+ ions probably enhanced the direct decomposition of methanol and DME, producing more CO and CH4.11 Our previous work reported that the partial substitution of Al3+ (20%) by Ce4+ in ZnAlO mixed oxide catalyst can improve the performance of ZnAlO catalyst for DME SR, and the modified ZnAlCeO catalyst exhibited higher CO2 selectivity and better start-off durability than ZnO and ZnAlO catalysts.12 The introduction of Ce not only enhanced the dispersion of Zn species but also inhibited the transformation of ZnO to spinel ZnAl2O4. In addition, the interaction between ceria and zinc oxide may produce new active sites, such as the Ce4+–O–Zn2+ linkages.12
Intrinsic ZnO is an n-type semiconductor.13 According to the electron theory of catalysis on semiconductors, the catalytic activity of semiconductor is determined by the position of the Fermi level on the surface of the crystal, which can be varied to some extent by doping the surface or the bulk of the crystal with the properly chosen impurities in proper concentrations.14 Ga atoms can substitutionally enter the lattice of ZnO acted as donors,15 and it can raise the Fermi level on the surface of ZnO. Zinc oxide catalysts modified by gallium have been proved to be active for many reactions including water splitting,16,17 DME SR18 and MSR reactions.19
Based upon the above analysis, we expected the doping of gallium could improve the catalytic performance of ZnO-based catalysts for DME SR. In this work a series of gallium-doped ZnO (GDZ) catalysts physically mixed with γ-Al2O3 (GDZ/γ-Al2O3) with different zinc/gallium molar ratios were designed and prepared. Our results show that the GDZ/γ-Al2O3 catalysts do display the remarkably improved catalytic performance, such as high DME conversion, high CO2 selectivity and long high-temperature durability, as compared with the traditional CuZnAlO catalyst physically mixed with γ-Al2O3. By using multiple techniques including XRD, TPD-MS-CH3OH, in situ FTIR of CH3OH, X-ray photoelectron spectroscopy (XPS) and four-probe direct current (DC) method, the catalysts were reasonably characterized, and the structure–performance relationship and the reaction pathways of CH3OH reforming were discussed, as well.
2. Experimental
2.1 Catalyst preparation
The GDZ catalysts with different Zn/Ga atomic ratios were prepared by co-precipitation method, using sodium carbonate as precipitant. Zn(NO3)2·6H2O and Ga(NO3)3 solution (purchased from Alfa Aesar) were used as source materials. A Na2CO3 solution with [CO32−] = 0.5 M and a mixed solution of Zn and Ga nitrates with the total cations concentration of 1.0 M were prepared, respectively. Then these two solutions were simultaneously dropped into 100 mL deionized water by keeping the pH around 7.5 under vigorous mechanical stirring at the temperature of 60 °C. After aged at the same temperature for 2 h, the obtained precipitate was filtered and washed by deionized water for three times, then dried overnight at 120 °C and finally calcined at 500 °C for 4 h. According to the Zn/Ga molar ratio, the prepared catalysts were denoted as ZnO, Zn9.5Ga0.5O, Zn9Ga1O, Zn8Ga2O and Zn7Ga3O, respectively. For comparison, a conventional CuZnAlO catalyst was also prepared, the details of which can be found elsewhere.6Before used for the measurements of activity and durability, the GDZ and CuZnAlO catalysts were mechanically mixed with γ-Al2O3 (supplied by Tianjin Chemical Research & Design Institute, calcined at 600 °C for 2 h, SSA = 189 m2 g−1) with the mass ratio of 2![[thin space (1/6-em)]](https://www.rsc.org/images/entities/char_2009.gif) :
:![[thin space (1/6-em)]](https://www.rsc.org/images/entities/char_2009.gif) 1 (GDZ or CuZnAlO to γ-Al2O3), and the catalysts were made into small pellets with the size of 40–60 mesh. The total acidity of γ-Al2O3 calculated by the temperature-programmed desorption of ammonia (NH3-TPD) is 50 μmol g−1. The catalysts were denoted as GDZ/γ-Al2O3 or CuZnAlO/γ-Al2O3.
1 (GDZ or CuZnAlO to γ-Al2O3), and the catalysts were made into small pellets with the size of 40–60 mesh. The total acidity of γ-Al2O3 calculated by the temperature-programmed desorption of ammonia (NH3-TPD) is 50 μmol g−1. The catalysts were denoted as GDZ/γ-Al2O3 or CuZnAlO/γ-Al2O3.
2.2 Catalyst characterization
The specific surface area (SSA) of the catalysts was measured by nitrogen adsorption at −196 °C on a Quantachrome QuadraSorb SI instrument. Before the measurements, the catalysts were degassed under vacuum at 300 °C for 3 h. The specific surface area was calculated using standard BET method in 0–0.3 partial pressure range.The crystal structure of the catalysts was characterized by X-ray diffraction (XRD). The tests were performed on Rigaku D/Max-2500 X-ray diffractometer operating at 200 mA and 40 kV, using Cu Kα (λ = 0.15418 nm) as radiation source. The diffraction data in the range of 2θ from 10° to 90° were collected at a speed of 8° min−1, and the slow scan were collected at a speed of 1° min−1 from 30° to 40°.
The temperature-programmed desorption of CH3OH (TPD-MS-CH3OH) was performed on a TPDRO instrument (Xian Quan TP-5079) connected with a mass spectrometer (Hiden HPR20). 50 mg catalyst powder (40–60 mesh) was put into the quartz tube reactor and pretreated at 400 °C for 1 h under 8% H2/N2 stream (30 mL min−1), then the feed gas was switched to pure helium flow (99.999%, 30 mL min−1) for 0.5 h at the same temperature to purge the gaseous and adsorbed H2. After the temperature cooled down to 60 °C in the same helium flow, pulses of CH3OH (1.0 μL) were injected into the catalyst bed until the MS signal got stable. Subsequently, the temperature-programmed desorption was conducted from ambient temperature to 700 °C at a heating rate of 10 °C min−1 in the same helium flow (99.999%, 30 mL min−1).
To evaluate the quantity of methanol adsorbed on the surface of the catalysts, the CH3OH pulse adsorption was also performed on the TP-5079 with a thermal conductivity detector. Similar to the test of TPD-MS-CH3OH, the catalysts were first pretreated with 8% H2/N2 and purified with helium before measurement. Then, the pulses of CH3OH (1.0 μL) were rapidly injected into the tube every 0.5 h until the detector signal got stable at 60 °C.
The in situ Fourier-transform infrared (FTIR) spectroscopies of CH3OH were performed on a Nicolet Nexus spectrometer equipped with a MCT detector cooled by liquid nitrogen. 20 mg catalyst was ground into fine powder and pressed into a thin wafer, which was then placed in a quartz IR cell connected to a high vacuum system. The catalyst was in situ pretreated for 1 h at 400 °C in 5% H2/N2 mixture gas flow with a rate of 50 mL min−1. The background spectra were collected in vacuum. Subsequently, the catalyst was exposed to CH3OH at 50 °C in N2 flow to achieve adsorption saturation. The FTIR spectra were recorded at the desired temperatures from 50 to 400 °C.
The conductivities of the catalysts were measured with a four-probe direct current (DC) method with an electrochemical workstation (VersaSTAT 3, Ametek). The powders were pressed at 18 MPa and made into rectangular bars with a typical size of 25 × 7 × 1.5 mm and then calcined at 500 °C for 3 h to form dense bars. Four silver wires with silver paste were used as electrodes. Before the test, the bars were reduced in H2 (50 mL min−1) at 400 °C for 0.5 h, and then the conductivities of the catalysts were measured in H2 atmosphere.
The X-ray photoelectron spectra were analyzed using an X-ray photoelectron spectroscopy (XPS) (K-alpha X, Thermo Fisher co., USA). The binding energies were referenced to the C1s line at 284.6 eV from adventitious carbon.
The procedures of NH3-TPD and thermal gravimetric analysis (TG) can be obtained in ESI.†
2.3 Catalytic activity and durability tests
The evaluation of catalytic activity and durability of the catalysts was performed in a continuous flow fixed-bed reactor under atmospheric pressure. Before activity evaluation, 500 mg catalyst was loaded in the quartz reactor and in situ reduced at 400 °C for 0.5 h in 10% H2/N2 (50 mL min−1). The feedstock for activity and durability tests is composed of N2 (40%), H2O vapor (50%) and DME (10%) with the steam/carbon molar ratio (S/C) fixed at 2.5, showing a space velocity of 12![[thin space (1/6-em)]](https://www.rsc.org/images/entities/char_2009.gif) 000 mL h−1 gcat−1. The external and internal mass transfer limitations have already been excluded by variation of the linear flow rate over the catalyst and the catalyst particle size, respectively. A mixture gas of DME and N2 was directly fed to the reactor, and the water was vaporized at 150 °C before entering the reactor. For activity measurements the reaction temperature varied in the range of 370–450 °C, while for durability tests the reaction temperature was fixed at 440 °C. The compositions of the influent and effluent gases containing DME, CH4, CH3OH, N2, CO, CO2 and H2 were analyzed by an Agilent 7890A chromatograph (GC). DME, CH4 and CH3OH were separated by a PoraPak Q capillary column and analyzed by a flame ionization detector (FID), while N2, CO and CO2 were separated by a PoraPak N column and a MoleSieve 5A column, and analyzed by a thermal conductivity detector (TCD). H2 was analyzed by TCD with N2 as carrier gas. The DME conversion (XDME), H2 yield (yH2) and the selectivity (SCi) to Ci (including CO2, CO and CH4) are defined as follows:
000 mL h−1 gcat−1. The external and internal mass transfer limitations have already been excluded by variation of the linear flow rate over the catalyst and the catalyst particle size, respectively. A mixture gas of DME and N2 was directly fed to the reactor, and the water was vaporized at 150 °C before entering the reactor. For activity measurements the reaction temperature varied in the range of 370–450 °C, while for durability tests the reaction temperature was fixed at 440 °C. The compositions of the influent and effluent gases containing DME, CH4, CH3OH, N2, CO, CO2 and H2 were analyzed by an Agilent 7890A chromatograph (GC). DME, CH4 and CH3OH were separated by a PoraPak Q capillary column and analyzed by a flame ionization detector (FID), while N2, CO and CO2 were separated by a PoraPak N column and a MoleSieve 5A column, and analyzed by a thermal conductivity detector (TCD). H2 was analyzed by TCD with N2 as carrier gas. The DME conversion (XDME), H2 yield (yH2) and the selectivity (SCi) to Ci (including CO2, CO and CH4) are defined as follows:
 | (4) |
 | (5) |
 | (6) |
3. Results and discussion
3.1 Catalysts characterization
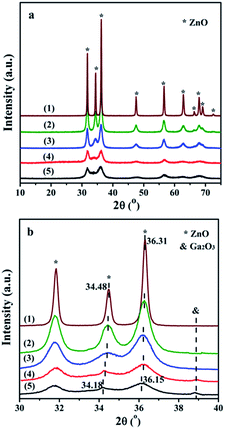 | ||
| Fig. 1 XRD patterns in the region of (a) 10° to 75° with a speed of 8° min−1 and (b) 30° to 40° with a speed of 1° min−1: (1) ZnO, (2) Zn9.5Ga0.5O, (3) Zn9Ga1O, (4) Zn8Ga2O and (5) Zn7Ga3O. | ||
Furthermore, Fig. 1(b) shows the slow scan XRD patterns. Doping of ZnO with Ga causes the shift of the XRD peaks towards small angles. The peak corresponding to (002) plane shifted from 34.48 to 34.18°, and the peak corresponding to (101) plane shifted from 36.31 to 36.15°. The shift of the diffraction peaks indicates the GDZ catalysts still keep the zincite structure and Ga is successfully incorporated into the crystal lattice causing the lattice distortion. Wei et al. reported that the interplanar spacing of the (101) plane in Ga-doped ZnO catalysts shifted from 0.2468 to 0.2473 nm.20 According to the semiconductor theory, the Ga cations in the zincite structure probably exist in the form of Ga3+·e, which can increase the conductivity and the electron-donating ability of the catalyst. A weak diffraction peak of gallium oxide (Ga2O3 [JCPDS 06-0509]) appears in the Zn8Ga2O pattern, and it becomes stronger in the Zn7Ga3O pattern. It indicates that partial of Ga exists in the form of Ga2O3 on the GDZ catalysts.
The results of the specific surface areas of the catalysts are summarized in Table 1. The surface areas are enlarged with the Ga contents increased.
| Catalyst | SSA (m2 g−1) | ACS (nm) | MAAa (mmol g−1) | Eab (kJ mol−1) | TOFc (s−1) |
|---|---|---|---|---|---|
a Methanol adsorption amounts (MAA) was calculated from the area of the peaks in the CH3OH pulse adsorption profiles.b Apparent activation energy (Ea) was estimated from Arrhenius equation based on the activity over all the catalysts (50 mg) at 1 atm total pressure (space velocity of 12![[thin space (1/6-em)]](https://www.rsc.org/images/entities/char_2009.gif) 000 mL h−1 gcat−1. 10% DME, 50% H2O and 40% N2).c Turnover frequency (TOF) was estimated based on the MAA results and the activity tests over all the catalysts (50 mg) at 430 °C and 1 atm total pressure (space velocity of 12 000 mL h−1 gcat−1. 10% DME, 50% H2O and 40% N2).c Turnover frequency (TOF) was estimated based on the MAA results and the activity tests over all the catalysts (50 mg) at 430 °C and 1 atm total pressure (space velocity of 12![[thin space (1/6-em)]](https://www.rsc.org/images/entities/char_2009.gif) 000 mL h−1 gcat−1. 10% DME, 50% H2O and 40% N2). 000 mL h−1 gcat−1. 10% DME, 50% H2O and 40% N2). |
|||||
| ZnO | 9.2 | 45.5 | 0.05 | — | — |
| Zn9.5Ga0.5O | 57.0 | 11.7 | 0.31 | 213.6 ± 4.4 | 0.013 |
| Zn9Ga1O | 68.8 | 9.0 | 0.34 | 197.4 ± 2.7 | 0.019 |
| Zn8Ga2O | 80.2 | 4.4 | 0.33 | 203.6 ± 11.0 | 0.016 |
| Zn7Ga3O | 93.2 | 3.9 | 0.35 | 210.2 ± 5.9 | 0.015 |
3.2 Activity and stability
 | ||
| Fig. 4 (a) Conversion of DME, (b) yield of H2, (c) selectivity of CO and (d) selectivity of CO2 for the DME SR reaction. | ||
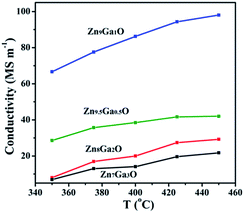
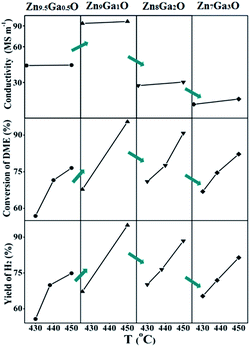
With the increase of Ga content, the conversion of DME and the yield of hydrogen increased and then decreased. The XRD results showed that Ga was doped into the crystal lattice of ZnO. As shown in Fig. 2, doping of Ga had caused the change of electrical conductivity. The relationship between electrical conductivity and catalytic performance is displayed in Fig. 5. Compared with the change of the conductivity of GDZ catalysts, the change of the conversion of DME and the yield of hydrogen displayed a similar trend. The electron theory of catalysis on semiconductor indicated in the case of an n-type reaction on an n-type semiconductor, the electrical conductivity and the activity in the same direction.14 Our results indicate that the rate-controlling step of DME SR over GDZ/γ-Al2O3 catalysts is an n-type reaction. It can be accelerated by doping donor in the lattice of n-type semiconductor of ZnO, which can enhance the donor ability. The rate-controlling step may change with the increase of donor. It indicates that a proper electrical conductivity is helpful to improve the activity and selectivity of the catalyst. In this work, the highest electrical conductivity corresponds to the highest catalytic activity. It indicates that increasing the conductivity of GDZ catalysts probably further enhance the activity of the catalyst. Moreover, as listed in Table 1, with the increase of the amount of gallium, the specific surface areas of the GDZ catalysts significantly enlarged. Thus, although the conductivity of Zn7Ga3O and Zn8Ga2O was lower than that of Zn9.5Ga0.5O, the formers still presented the higher catalytic activity than the later, since the specific surface areas of Zn8Ga2O (80.2 m2 g−1) and Zn7Ga3O (93.2 m2 g−1) are much larger than that of Zn9.5Ga0.5O (57 m2 g−1).
Understanding the formation and desorption of surface species is helpful to the improvement of catalyst. According to the results of TPD-MS-CH3OH, the initial desorption temperature of hydrogen on the GDZ catalysts is about 230 °C, which is lower than that of CO2 (about 260–280 °C). The top temperature of the H2 desorption peak is also lower than that of CO2. We found that the trend of the conversion of DME, as well as the yield of hydrogen, is similar to the trend of the CO2 desorption temperature. The lower desorption temperature of CO2 matches the higher activity and selectivity. Thus, we deduced that the formation of CO2 might be the rate-controlling step of DME SR using GDZ/γ-Al2O3 as catalysts. The signals of CO2 and H2 suggest that Zn9Ga1O has the highest activity to convert CH3OH to H2 and CO2, as shown in Fig. 4(b and c). Enhancing the ability of GDZ catalysts to convert CH3O– into CO2 will contribute to the improvement of the catalytic activity of DME SR.
3.3 Mechanism of DME SR over GDZ/γ-Al2O3 catalyst
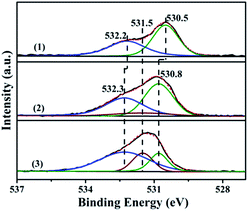 | ||
| Fig. 7 The XPS spectra in the O 1s region of the ZnO and Zn9Ga1O catalysts: (1) ZnO, (2) Zn9Ga1O and (3) Zn9Ga1O pretreated in 8% H2/N2 for 0.5 h before XPS test. | ||
In order to compare the cases of the GDZ and ZnO catalysts, the relative intensities of the Zn9Ga1O, pretreated Zn9Ga1O and ZnO catalysts are calculated and are listed in Table 2. As described in Table 2, the Zn9Ga1O and pretreated Zn9Ga1O have higher values of the medium binding energy component than ZnO, confirming that the oxygen vacancy increased after the Ga element incorporated into zinc oxide crystal lattice. After the Zn9Ga1O catalyst was pretreated by H2, the percentage of lattice oxygen decreased continuously, and the oxygen vacancy increased. The oxygen vacancy plays an important role in the adsorption of reactants and it is very important for DME SR.
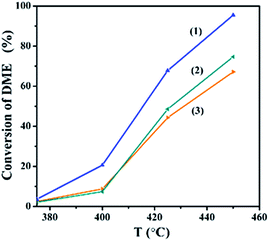
To confirm the effect of oxygen vacancies, the catalytic tests of the Zn9Ga1O/γ-Al2O3 pretreated in different atmospheres were also evaluated. As shown in Fig. 8, at 425 °C the conversion of DME over the pre-reduced Zn9Ga1O/γ-Al2O3 catalyst can reaches 67.8%, while it is only 48.5% and 44.3% over the Zn9Ga1O/γ-Al2O3 catalyst pretreated in pure N2 and the fresh one, respectively. Apparently, the pre-reduction treatment can significantly improve the catalytic activity of Zn9Ga1O/γ-Al2O3. So, it indicates that the increase of the number of oxygen vacancies can improve the catalytic activity for DME SR over the GDZ/γ-Al2O3 catalyst.
| Groups | Vibrational mode | Wavenumber (cm−1) | Ref. |
|---|---|---|---|
| H2O | δ (H2O) | 1610 | 31 |
| –OH | ν (OH) | 3664, 3709 | 28 |
| 3600–3300 | 29 | ||
| CH3O– | ν (CO) | 1032 | 21 |
| 1100–1000 | 21 and 30 | ||
| νas (CH3) | 3006 | 29 | |
| 2961, 2926 | 30 | ||
| νs (CH3) | 2868 | 29 | |
| 2821 | 30 | ||
| δs (CH3) | 1453 | 29 | |
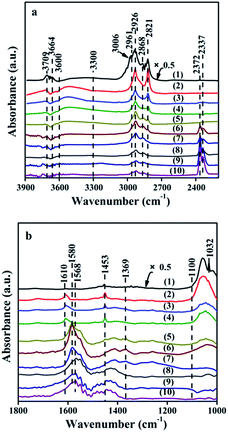
| HCOO– | δ (CH) | 2961 | 30 |
| νs (COO–) | 1369 | 32 | |
| νas (COO–) | 1580 | 32 | |
| CO2 | Physisorbed CO2 | 2372, 2337 | 31 |
| CH3OH + □ → CH3Oa + Ha | (7) |
| H2O + □ → HOa + Ha | (8) |
| HOa → Oa + Ha | (9) |
| 2Ha → H2 | (10) |
The appearance of signals of HCOO– in in situ FTIR at 200 °C proved that the CH3O– species transformed into HCOO–. We infer the equations (eqn (11) and (12)) for this process.
 | (11) |
 | (12) |
The CO2 signals appeared in TPD-MS-CH3OH test at about 270 °C. Moreover, at 300 °C, new bands corresponding to gaseous CO2 (2372, 2337 cm−1) are observed in in situ FTIR spectra. The appearance of the gaseous CO2 demonstrates that the formed intermedium HCOO– prefers to turn into CO2 (eqn (13)), which can provide a strong evidence for the high CO2 selectivity of DME SR on the GDZ/γ-Al2O3 catalysts (Fig. 4(d)).
 | (13) |
We found that CO2 was generated at the highest temperature in all steps. Meanwhile, the temperature of CO2 desorption showed in TPD-MS-CH3OH has a similar trend with the conversion of DME. Thus, we deduce that the transformation from HCOO– to CO2 is the controlling step for MSR over the GDZ catalyst. As discussed in 3.2.1, the rate-controlling step of DME SR over GDZ/γ-Al2O3 catalysts is an n-type reaction. Therefore, we deduce the transformation from HCOO– to CO2 is an n-type reaction, which can be accelerated by doping donor in the lattice of n-type semiconductor, and we have accelerated the transformation from HCOO– to CO2 by the doping of ZnO with Ga.
4. Conclusion
A series of gallium-doped zinc oxide (GDZ) mixed with γ-Al2O3 catalysts for DME SR to produce H2 was prepared. Compared with the conventional catalyst, GDZ/γ-Al2O3 catalysts exhibited higher carbon dioxide selectivity and better stability. XRD results indicated that Ga atoms incorporated into the crystal lattice of ZnO. With the increase of gallium content, the conductivity of GDZ catalysts increased and then decreased, similar with the conversion of DME trend and the yield of hydrogen trend. When the molar ratio of Ga![[thin space (1/6-em)]](https://www.rsc.org/images/entities/char_2009.gif) :
:![[thin space (1/6-em)]](https://www.rsc.org/images/entities/char_2009.gif) Zn is 1
Zn is 1![[thin space (1/6-em)]](https://www.rsc.org/images/entities/char_2009.gif) :
:![[thin space (1/6-em)]](https://www.rsc.org/images/entities/char_2009.gif) 9, the GDZ catalyst has the highest conductivity, and the corresponding Zn9Ga1O/γ-Al2O3 catalyst has the highest conversion of DME (95.4%) and yield of hydrogen (95%). The results of conductivity indicate that the rate-controlling step of DME SR over the GDZ catalysts is an n-type reaction. XPS results indicated that doping of gallium introduced a large number of oxygen vacancies into the catalyst, and the vacancies were beneficial to the reaction. According to the results of XPS, TPD-MS-CH3OH, in situ FTIR of CH3OH and the proposed mechanism with HCOO– as an intermedium, we speculated that the formation of carbon dioxide might be the rate-controlling step for DME SR over GDZ/γ-Al2O3 catalysts. We deduce the transformation from HCOO– to CO2 is an n-type reaction. The good conversion of DME, high selectivity of CO2 and high stability of GDZ/γ-Al2O3 catalysts makes it promising for DME SR both in research and industry.
9, the GDZ catalyst has the highest conductivity, and the corresponding Zn9Ga1O/γ-Al2O3 catalyst has the highest conversion of DME (95.4%) and yield of hydrogen (95%). The results of conductivity indicate that the rate-controlling step of DME SR over the GDZ catalysts is an n-type reaction. XPS results indicated that doping of gallium introduced a large number of oxygen vacancies into the catalyst, and the vacancies were beneficial to the reaction. According to the results of XPS, TPD-MS-CH3OH, in situ FTIR of CH3OH and the proposed mechanism with HCOO– as an intermedium, we speculated that the formation of carbon dioxide might be the rate-controlling step for DME SR over GDZ/γ-Al2O3 catalysts. We deduce the transformation from HCOO– to CO2 is an n-type reaction. The good conversion of DME, high selectivity of CO2 and high stability of GDZ/γ-Al2O3 catalysts makes it promising for DME SR both in research and industry.
Acknowledgements
This work is financially supported by National Natural Science foundation of China (No. 21476159, 21476160), the Natural Science Foundation of Tianjin (No. 15JCZDJC37400), the 973 program (2014CB932403), and the Program for Introducing Talents of Discipline to Universities of China (No. B06006).Notes and references
- B. Chutichai, S. Authayanun, S. Assabumrungrat and A. Arpornwichanop, Energy, 2013, 55, 98–106 CrossRef CAS.
- K. Faungnawakij, R. Kikuchi, T. Matsui, T. Fukunaga and K. Eguchi, Appl. Catal., A, 2007, 333, 114–121 CrossRef CAS.
- K. Faungnawakij, Y. Tanaka, N. Shimoda, T. Fukunaga, S. Kawashima, R. Kikuchi and K. Eguchi, Appl. Catal., A, 2006, 304, 40–48 CrossRef CAS.
- T. A. Semelsberger, K. C. Ott, R. L. Borup and H. L. Greene, Appl. Catal., B, 2006, 65, 291–300 CrossRef CAS.
- Z. Sun, M. Meng, L. Zhang, Y. Zha, X. Zhou, Z. Jiang, S. Zhang and Y. Huang, Int. J. Hydrogen Energy, 2012, 37, 18860–18869 CrossRef CAS.
- L. Zhang, M. Meng, S. Zhou, Z. Sun, J. Zhang, Y. Xie and T. Hu, J. Power Sources, 2013, 232, 286–296 CrossRef CAS.
- N. Shimoda, K. Faungnawakij, R. Kikuchi, T. Fukunaga and K. Eguchi, Appl. Catal., A, 2009, 365, 71–78 CrossRef CAS.
- X. Zhou, M. Meng, Z. Sun, Q. Li and Z. Jiang, Chem. Eng. J., 2011, 174, 400–407 CrossRef CAS.
- D. Feng, Y. Wang, D. Wang and J. Wang, Chem. Eng. J., 2009, 146, 477–485 CrossRef CAS.
- H. Lorenz, M. Friedrich, M. Armbrüster, B. Klötzer and S. Penner, J. Catal., 2013, 297, 151–154 CrossRef CAS PubMed.
- M. Yang, Y. Men, S. Li and G. Chen, Int. J. Hydrogen Energy, 2012, 37, 8360–8369 CrossRef CAS.
- L. Zhang, M. Meng, X. Wang, S. Zhou, L. Yang, T. Zhang, L. Zheng, J. Zhang and T. Hu, J. Power Sources, 2014, 268, 331–340 CrossRef CAS.
- T. Minami, MRS Bull., 2000, 25, 38–44 CrossRef CAS.
- T. Wolkenstein, Adv. Catal., 1960, 12, 189–264 Search PubMed.
- W. Göpel and U. Lampe, Phys. Rev. B: Condens. Matter Mater. Phys., 1980, 22, 6447 CrossRef.
- K. Maeda, K. Teramura and K. Domen, J. Catal., 2008, 254, 198–204 CrossRef CAS.
- X. Wang, S. Shen, S. Jin, J. Yang, M. Li, X. Wang, H. Han and C. Li, Phys. Chem. Chem. Phys., 2013, 15, 19380–19386 RSC.
- T. Mathew, Y. Yamada, A. Ueda, H. Shioyama, T. Kobayashi and C. S. Gopinath, Appl. Catal., A, 2006, 300, 58–66 CrossRef CAS.
- W. Tong, K. Cheung, A. West, K.-M. Yu and S. C. E. Tsang, Phys. Chem. Chem. Phys., 2013, 15, 7240–7248 RSC.
- H. Wei, M. Li, Z. Ye, Z. Yang and Y. Zhang, Mater. Lett., 2011, 65, 427–429 CrossRef CAS.
- S. E. Collins, L. E. Briand, L. A. Gambaro, M. A. Baltanás and A. L. Bonivardi, J. Phys. Chem. C, 2008, 112, 14988–15000 CAS.
- D. Chadwick and K. Zheng, Catal. Lett., 1993, 20, 231–242 CrossRef CAS.
- K. A. Pokrovski and A. T. Bell, J. Catal., 2006, 241, 276–286 CrossRef CAS.
- K. Faungnawakij, T. Fukunaga, R. Kikuchi and K. Eguchi, J. Catal., 2008, 256, 37–44 CrossRef CAS.
- P.-T. Hsieh, Y.-C. Chen, K.-S. Kao and C.-M. Wang, Appl. Phys. A: Mater. Sci. Process., 2008, 90, 317–321 CrossRef CAS.
- G. C. Park, S. M. Hwang, J. H. Lim and J. Joo, Nanoscale, 2014, 6, 1840–1847 RSC.
- X. Duan, C. Song, F. Yu, D. Yuan and X. Li, Appl. Surf. Sci., 2011, 257, 4291–4295 CrossRef CAS.
- A. Vimont, J. Lavalley, A. Sahibed-Dine, C. Otero Areán, M. Rodríguez Delgado and M. Daturi, J. Phys. Chem. B, 2005, 109, 9656–9664 CrossRef CAS PubMed.
- M. M. Branda, S. E. Collins, N. J. Castellani, M. A. Baltanás and A. L. Bonivardi, J. Phys. Chem. B, 2006, 110, 11847–11853 CrossRef CAS PubMed.
- P. H. Matter and U. S. Ozkan, J. Catal., 2005, 234, 463–475 CrossRef CAS.
- R. W. Stevens Jr, R. V. Siriwardane and J. Logan, Energy Fuels, 2008, 22, 3070–3079 CrossRef.
- M. Calatayud, S. Collins, M. Baltanas and A. Bonivardi, Phys. Chem. Chem. Phys., 2009, 11, 1397–1405 RSC.
Footnote |
| † Electronic supplementary information (ESI) available: TPD-MS-CH3OH with the adsorption of CH3OH at 100 °C on ZnO; Arrhenius plots for DME SR reaction over GDZ/γ-Al2O3 catalysts; XRD of the CuZnAlO/γ-Al2O3 and Zn9Ga1O/γ-Al2O3 catalysts before and after stability test; TG of the CuZnAlO/γ-Al2O3 and Zn9Ga1O/γ-Al2O3 catalysts before and after stability test; catalyst characterization of NH3-TPD and TG. See DOI: 10.1039/c6ra07940g |
| This journal is © The Royal Society of Chemistry 2016 |

