Potential continuous removal of toluene by ZnO nanorods grown on permeable alumina tube filters

Faegheh Ghanbaria, Mehdi Eskandariab, Pariya Nazaric, Saba Gharibzadehc, Saman Kohnehpoushiab and Bahram Abdollahi Nejand*ab
aNanomaterial Research Group, Academic Center for Education, Culture and Research (ACECR) on TMU, Tehran, Iran. E-mail: b.abdollahi@modares.ac.ir
bNanomaterials Group, Dept. of Materials Engineering, Tarbiat Modares University, Tehran, Iran
cDepartment of Physics, Tarbiat Modares University, Tehran, Iran

Received 25th March 2016 , Accepted 23rd May 2016

First published on 25th May 2016


Abstract

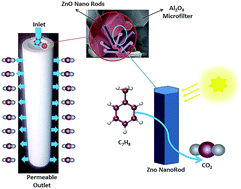
Vertical ZnO nanorods were successfully grown on the crystalline surface of an Al2O3 microfilter by the simple technique of evaporation of prepared solution at atmospheric pressure (ESAP) for photocatalytic degradation of toluene. The nanorods were grown from evaporated solution at low temperatures of 300, 400, and 500 °C. The crystalline structure and morphology of the deposited films were evaluated by X-ray diffraction (XRD) and Field Emission Scanning Electron Microscopy (FE-SEM), respectively. The aqueous photocatalytic activity of the samples was measured by degradation of Methylene Blue (MB) dye. Toluene photodegradation was studied using a tubular photoreactor under various gas concentrations, flow rates (FR), relative humidities (RH), reaction temperatures (RT), and using various light sources. The grown ZnO nanorods were highly uniform and hexagonal wurtzite crystals with mono-sized nanorods. For the nanorods grown at 300 °C, the photocatalytic investigation showed approximately 98% degradation of MB for the first 20 minutes of UV light irradiation. The toluene degradation results indicated that alterations in gas concentration and flow rate affect the toluene degradation ability by direct and indirect oxidation and reduction mechanisms and the absorption capability of the ZnO nanorods' surface. In this system, 20% relative humidity and 30 °C reaction temperature were found to be the optimum conditions for maximum toluene conversion.

1. Introduction

Volatile organic compounds (VOCs) are common air pollutants and can be found in both outdoor and indoor environments. Many VOCs are known to be toxic and considered carcinogenic. Recently, photocatalytic oxidation (PCO) has received growing interest as a promising technology for the removal of indoor and outdoor air pollutants, in particular VOCs present at low ppb concentrations.1,2 There are some conventional air cleaning technologies such as filtration and sorption,3 which only transfer indoor pollutants to another phase, but PCO has the potential to destroy a broad range of VOCs such as benzene, toluene, ethylbenzene, and p-xylene (BTEX) to carbon dioxide (CO2) and water (H2O).4,5 There are a large number of photocatalytic materials, including TiO2, with acceptable activity to degrade the VOCs. Zinc oxide (ZnO), similar to titanium dioxide, is one of strongest photocatalytic materials, which is less expensive and has an easy synthesis process. Potential photocatalyst materials such as ZnO, TiO2, and Bi4B2O9 could degrade the organic aqueous pollutants such as methylene blue same as air pollutants according to their band gap justification and engineering.6,7 The various structures of ZnO have been achieved through applying various techniques and parameters.8–12 Because of unique properties of ZnO nanorods, such as high surface area, less grain boundaries, direct path of electron transportation, engineering direction of structure, chemical and thermal stability, and excellent photocatalytic properties, there are numerous studies on synthesis and characterization of aligned and non-aligned structures.13–16

The process of vertical growth is highly attractive because of its antenna structure and ability to absorb the wide range of irradiated light beams. ZnO films have been grown using various techniques including chemical vapor deposition (CVD),17 vapor phase epitaxy,18 molecular beam epitaxy,19 DC reactive magnetron sputtering,20,21 sol–gel,22 and hydrothermal methods.23 Here, the electrodeposition,24 hydrothermal23 and CVD17 growth techniques are among the more common techniques for preparing the vertically grown nanorods.

In this study, a fast and convenient technique for growing ZnO nanorod arrays, named as evaporation of solution at atmospheric pressure (ESAP), was applied for preparing the photoactive alumina membrane. This method is similar to metal organic chemical vapor deposition (MOCVD) used for growing ZnO structures at the ambient pressure. As reported in the present study, ZnO grown by ESAP method shows uniform nanorod structures. As compared to other methods, such as vapor synthesis approach and solution phase technique, this technique has some merits including synthesis of single crystalline nanorods with a hexagonal wurtzite crystalline structure, high purity, high deposition rate, good crystallinity, density and aspect ratio controllability, and uniformity. Moreover, in this method, ZnO nanorods can be vertically grown at low temperature and atmospheric pressure with low cost and ease of handling which can be quite appropriate for ZnO nanostructured growth on the porous structure substrate without decreasing the flow rate of gas stream. However, there are few studies that investigated the zinc oxide photocatalytic activity on removal efficiency of toluene molecules. This work was conducted to investigate the photocatalytic activity of various grain size of ZnO nanorods on degrading the toluene as an example of BTEX pollutants. The effective parameters of the photoreaction were determined by investigating the toluene concentration at ppbv-level, flow rate, relative humidity, reaction temperature, and light sources.

2. Experimental procedure

2.1 Growth of aligned ZnO nanorods

ZnO nanorods were grown under atmospheric pressure condition from evaporation of prepared solution. The solution was prepared by solving the Zn(CH3COO)2·2H2O (Merck) in 50 mL deionized water (DI). Polyvinylpyrrolidone (PVP) was used as a primitive surfactant with weight ratio of 1[thin space (1/6-em)]:[thin space (1/6-em)]10 of PVP to zinc acetate dihydrate. After completely dissolving PVP and zinc acetate dehydrate in DI water, temperature of the solution was set to 70 °C and the solution was allowed to evaporate under vigorous stirring conditions. After reducing the quantity of the solution to 20 mL, it was poured into the clean alumina crucible. The cylindrical alumina micro-filter was placed vertically on the alumina crucible and other side of cylindrical micro-filter was covered by alumina tablet. This system was laid in a furnace and the furnace was set to different temperature of 300, 400, and 500 °C. The temperature of the furnace was increased at the rate of 10 °C per minute until it reaches to 300, 400, and 500 °C. Once the temperatures reached to 300, 400, and 500 °C, the annealing process was performed for 2 hours. To study the surface contact between ZnO nanorods and alumina microfilter, a half portion of prepared solution (25 mL decreased to 10 mL through the previously mentioned preparation method), and growth temperature of 300 °C was chosen to carry out evaporation process. The growth parameters were summarized in Table 1.
Table 1 Growth parameters of ZnO nanorods on the substrates
Sample Growth rate (°C min−1) Growth temperature (°C) Growth pressure (bar)
S3 10 300 1
S4 10 400 1
S5 10 500 1


2.2 Photocatalytic oxidation reactor

Fig. 1 shows a schematic representation of the experimental set-up used for the PCO of toluene in gas phase. As shown in Fig. 2a, the experiments were conducted in continuous flow mode using an annular flow-through reactor of about 314 mL, made of 316 stainless steel equipped with a high pressure mercury UV lamp (400 W, Philips) and a blue-green LED (wavelength of visible light ranged from 400 to 550 nm). As previously described, the photocatalytic medium was permeable alumina tube (Fig. 2b) coated by ZnO nanorods (Fig. 2c and d). The UVC and LED lamps were placed in axis of reactor which can irradiate on all interior region of alumina membrane, uniformly.
image file: c6ra07801j-f1.tif
Fig. 1 Schematic representation of the experimental set-up used for the PCO of toluene in gas phase.

image file: c6ra07801j-f2.tif
Fig. 2 Designed photoreactor for degrading the toluene molecules, stainless steel photoreactor (a), permeable alumina microfilter (b), schematic of ZnO nanorods growth on the interior surface of alumina microfilter (c), and gas permeation flow (d).

To inject the toluene gas, a gaseous stream of toluene was generated by toluene generator with carrier gas mixture of pure nitrogen and oxygen. The nitrogen and oxygen flow rate ratio was adjusted to 4[thin space (1/6-em)]:[thin space (1/6-em)]1. The humidity ratio was adjusted using the water bubbler system with same nitrogen and oxygen ratio. All gas streams were controlled by mass flow controller (APEX, USA). Besides the 316 stainless steel pipe was chosen to carry the gas stream. To get rid of any adsorbed pollutants, prior to any experimental process, the alumina microfilter modified by ZnO nanorods were heated up to 70 °C for 2 h.

By assembling the reactor, the chamber of photoreactor was washed by gas stream of nitrogen and oxygen gas mixture (N2/O2 ratio of 4[thin space (1/6-em)]:[thin space (1/6-em)]1). The standard operating conditions used for irradiation experiments are summarized in Table 2.

Table 2 Designed experimental condition of photoreactor
Parameters Value Parameters Value
Inlet gas temp. (K) 25 ± 2 Relative humidity (%) 10–60
Reaction temp. (°C) 10–60 ± 2 Irradiation area (cm2) 288.88
Inlet toluene conc. (ppbv) 100–400 UV irradiation intensity (mW cm−2) 1.8
Inlet toluene gas flow (mL min−1) 100–400 Visible irradiation wavelength (nm) 400–550


To investigate the photocatalytic degradation of toluene by ZnO nanorods, an experiments set was prepared. First, the degradation ability of toluene contaminant with various grain size of ZnO nanorods was investigated at constant toluene concentration, flow rate, relative humidity, reaction temperature, and UVC light irradiation. To investigate the effective parameters in photodegradation of toluene by various sizes of ZnO nanorods, toluene concentration, toluene gas flow rate, relative humidity, reaction temperature, and light source wavelength effects were studied.

2.3 Characterization of deposited layers

To study the microstructure and morphology of the deposited films, FE-SEM (S4160 Hitachi Japan) was used. The phase structures were also investigated using the XRD apparatus (Philips Expert-MPD). XRD tests were carried out at θ–2θ mode using Cu-Kα with wavelength of 1.5439 Å radiation. The optical characteristics of deposited films were analyzed using the UV-vis spectroscopy within the wavelength range of 190–1000 nm (Avantes, AvaLight-D (H)-S, Netherlands). The aqueous photocatalytic activity of prepared films was investigated by degradation of 10 ppm aqueous MB solution (20 mL). Besides, to investigate the photocatalytic activity of grown nanorods, 0.01 grams of ZnO nanorod/Al2O3 seed layer was mixed with prepared methylene blue solution. The wavelength and power of the UV-lamps used in these experiments were 365 nm and 400 W, respectively. The wavelength of visible-light ranged from 400 to 550 nm by using a blue-green LED. The LECO analysis (USA) has been used for determining the contents of nitrogen and carbon atoms. The degradation of MB by ZnO nanorods was determined by measuring the absorption intensity at its maximum absorbance wavelength of λMB = 661 nm, by using a UV-vis spectrophotometer (Avantes, AvaLight-D (H)-S, Netherlands).

2.4 Sampling and analysis of toluene photodegradation process

To determine toluene and gas phase reaction, during the UV irradiation, toluene and gas phase reaction intermediates were collected for 10–30 min at regular time intervals and at flow rate of 30 mL min−1 using multibed solid sorbent tubes. The gas analysis system was composed of a GC-MS (Focus GC and DSQ, USA) for the quantitative analyses of toluene vapor. The chromatographic column of the GC-MS was an Rtx-1 capillary GC column (26 m long, 0.53 mm i.d., 3 mm film thickness). The operating conditions of the GC-MS were set as follows: injector temperature: 200 °C, detector temperature: 200 °C, and the column temperature (followed the sample injection) 60 °C; which was then increased from 60 to 100 °C by the set program. Besides, the helium carrier gas flow rate was 1 mL min−1, helium make-up gas was 50 mL min−1, and the sample volume was 200 mL. A quantitative analysis of the gaseous products of reaction was conducted using the standard equations for a linear calibration response. The equation was generated for each standard compound using a minimum of five different concentrations with three replicates at each concentration. All correlation coefficients (R2) of the linear calibration response curves exceeded 99.5%.

3. Results and discussion

3.1 ZnO nanorod characterization

3.1.1. Surface morphology of grown nanorods. Fig. 3 illustrates the FE-SEM images of vertical growth of ZnO nanorods on crystalline alumina microfilter and pure glass substrate. As the figure shows, ZnO grown on various growth temperature possesses a hexagonal wurtzite crystalline structure, implying that the growth temperature range of 300 to 500 °C does not affect the crystal structure of ZnO nanorods. Fig. 3a–c show vertical growth of ZnO nanorods on the crystalline alumina microfilter. Fig. 3d shows pure porous alumina microfilter as a substrate. Using the crystalline substrate (such as crystalline alumina substrate), the developed ZnO nanorods indicated vertical structures (Fig. 3a–c, e and f). This can be explained by formation of widespread ZnO nucleation on the crystallites of Al2O3 particles; and, subsequently, growing of hexagonal structure of ZnO nanorods. Because of the crystalline structure of Al2O3, the nucleated and grown ZnO nanorods indicate high density and uniformity in size and length. In this study, the crystalline Al2O3 microfilter was chosen to prepare the crystalline sites for the growth of ZnO nanorods (Fig. 3a–c and e). As shown in Fig. 3e, by decreasing the evaporated solution up to half portion of previous solution, ZnO nanorods grown on the surface of porous alumina substrate are more sparse and shorter in length, in comparison with ZnO nanorods grown from whole portion of prepared solution. This can be explained by low accumulation of grown atoms and consequently low seeding sites on the surface of the substrate. It is noteworthy that the growing of ZnO nanorods in an approximately perpendicular state on the alumina substrate was achieved without any other primitive seeding process (Fig. 3e). Fig. 3f shows cross-section image of developed ZnO nanorods on the porous alumina microfilter. As the figure shows, because of porous structure of alumina microfilter, ZnO nanorods are grown in some interior parts of microfilter since the gaseous precursor permeate into porous structure of alumina microfilter during the evaporation of prepared solution.
image file: c6ra07801j-f3.tif
Fig. 3 The FE-SEM images of ZnO nanorods grown at various growth temperatures of 300, 400 and 500 °C on Al2O3 microfilter (a–c), pure microfilter (d), perpendicular ZnO nanorods on interior surface of alumina microfilter (e) and cross section image of ZnO grown nanorods on the interior surface of alumina microfilter (f).

As shown in Fig. 3a–c, various ZnO nanorod growth and annealing temperatures indicate various structures and dimensions. The ZnO nanorods were approximately uniform and 70 nm in diameter (Fig. 3a). By increasing the temperature up to 400 °C, ZnO nanorods diameter is reached to 100 nm. This can be explained by diffusion of ZnO atoms which results in radial growth of ZnO nanorods. By increasing the temperature up to 500 °C, the ZnO nanorods dimension is increased up to 180 nm. As shown in Fig. 3a–c, an increase in growth temperature, unlike the ZnO nanorods dimension, leads to the decrease in number of grown ZnO nanorods.

Growth of ZnO nanorods starts by nucleation followed by growth of ZnO nanorods from nucleated sites. Hence, the nucleation sites numbers, growth temperature, and concentration of evaporated solution could affect the microstructure of grown ZnO structure. According to the fact that in the present work the deposition condition including concentration of solution, substrate, distance between substrate and evaporation source were kept constant and only the evaporation and growth temperature were changed, the microstructure changes would come from the temperature differences. As shown in Fig. 3a, the 300 °C evaporation and growth temperature is enough high in nucleation and growth of ZnO nanorods. This means, at higher temperature of 400 and 500 °C, the same nucleation and growth could happen as confirmed by Fig. 3b and c. Besides, increasing the growth temperature would incline the evaporation rate and accordingly the growth rate. Hence, evaporation of solution at lower temperature of 300 °C provides enough time to deliver the zinc precursors to more nucleated area which result in higher number of ZnO nanorods growth possibility, while at higher temperatures, the high evaporation rate would confine the precursor delivery to all nucleated sites which cause limited growth of ZnO nanorods and decreasing the grown ZnO nanorods numbers. On the other side, as previously noted, higher temperature of 400 and 500 °C can provide higher zinc and oxygen diffusion condition to grow bigger ZnO nanorods in diameter.

3.1.2. Structural characterization of thin films. The structure of ZnO nanorods can be affected by important factors such as growth rate, annealing temperatures, impurities, dopants, and size of seed crystallites. Fig. 4 depicts the XRD patterns of ZnO nanorods grown on the crystalline dense alumina substrates. The results show the high purity of hexagonal wurtzite structure of ZnO without appearance of any other kinds of ZnO crystals. Crystallization of ZnO nanorods in a hexagonal wurtzite structure is confirmed with microstructure investigation (Fig. 3). As shown in Fig. 4, the high crystallinity of ZnO nanorods is achieved by using the Al2O3 crystalline substrate. The crystallites of Al2O3 particles provided the suitable sites for nucleation and growth of ZnO nanorod crystals. This can be explained by crystalline structure matching of α-alumina and hexagonal wurtzite crystals. The observed diffraction peaks can be indexed to those of hexagonal wurtzite ZnO (JCPDS 89-0510). The lattice parameters obtained for reference ZnO nanoparticles are a = 3.244 Å and c = 5.198 Å in close agreement with other reported values.25 As shown in Fig. 4a, by increasing temperature, the crystallinity of the structure is improved and the crystallite size is increased. As frequently reported, the crystal size can be calculated by Debye Scherrer equation. The calculated crystal size of grown ZnO nanorods are 12.65, 29.7 and 31.15 nm for growth temperatures of 300, 400, and 500 °C, respectively. As shown in Fig. 4a, the crystallographic pattern of ZnO nanorods grown at 300 °C indicates some leftward shifts in angles, as compared to the reference ZnO nanocrystals. In this work, PVP, which has enough sources of carbon and nitrogen for loading in the structure of wurtzite, was used as a surfactant. Considering the fact that the radius of carbon, nitrogen, and oxygen are 70, 65 and 60 picometers, respectively, by substitution of carbon and nitrogen instead of oxygen atoms in the wurtzite structure, there will be an expansion in the wurtzite structure, during the ZnO nanorods growth. This will lead to a strain in the crystallographic structure of wurtzite. This means that through the evaporation of the prepared solution, the carbon or nitrogen content molecules are evaporated simultaneously with zinc atoms and probably are loaded in the growing structure of ZnO crystals. The presence of the carbon and nitrogen in the structure grown in 300 °C is affirmed by LECO analysis which was 7 and 1% for carbon and nitrogen, respectively.
image file: c6ra07801j-f4.tif
Fig. 4 The XRD spectrum of ZnO nanorods on Al2O3 microfilter in various growth temperature of 300, 400 and 500 °C (a), and the magnified XRD spectrum of ZnO nanorods (b).

In the hexagonal structure of ZnO, the plane spacing is related to the lattice constants a, c, and Miller indices h, k, and l, by the following relation.26

1/d2 = 4/3((h2+ hk + k2)/a2) + (l2/c2)

For the (100) orientation, the lattice constant a is calculated as a = λ/√3[thin space (1/6-em)]sin[thin space (1/6-em)]θ, and for the (002) orientation, the lattice constant c is calculated as c = λ/sin[thin space (1/6-em)]θ.

The calculated d spacing of (100) face is expanded from 2.8093 Å of reference ZnO to 2.8173 Å of the C/N-loaded ZnO in the growth temperature of 300 °C. As shown in Table 3, lattice parameters of a and c are increased simultaneously, which can be attributed to carbon and nitrogen effects on the ZnO lattice. According to the structure reported by U. Seetawan et al.27 a and b parameters are correlated with bond length of Zn–Zn, and c is corresponded to bond length Zn–O. In this study, the increases in a and c can be explained by substitutional and interstitial placement of carbon and nitrogen.

Table 3 The crystallographic characteristics of ZnO nanorods in the various growth temperatures of 300, 400, and 500 °C
Sample Growth Temperature (°C) 2θ (°) d spacing (Å) (100) Crystal size (nm) a (Å) c (Å) ε = Δd/d
S3 300 31.76 2.817 12.6 3.26 5.219 28 × 10−4
S4 400 31.98 2.798 29.7 3.24 5.215 13 × 10−4
S5 500 31.85 2.813 31.1 3.25 5.204 12 × 10−4
(JCPDS 89-0510) 31.89 2.809 3.244 5.198


As shown in Fig. 4b, there exists an approximate shift of 2θ = 0.22° to larger angles from growth temperature of 300 °C to 400 °C. This can be explained by the drop in the level of loaded carbon or nitrogen in the structure of ZnO nanorods once the temperature rises up to 400 °C.21 By ejecting the carbon or nitrogen atoms out of the structure some obvious contraction is observed. This means that, time, temperature, and oxygen contents in the autoclave atmosphere could not provide the oxygen substitutional state to form the ZnO structures. This process leads to a kind of defect reported as an oxygen vacancy28,29 which has been reported as a major defect in the ZnO structure.30 The calculated d spacing of (100) facet is decreased to 2.7983 Å in the growth temperature of 400 °C due to the large contraction effects in the ZnO structure. The falling a and c parameters are in close agreement with ejecting carbon and nitrogen atoms out of substitutional and interstitial locations. By increasing the growth temperature up to 500 °C, another 2θ = 0.13° shift to a smaller angle is observed. This means that by rising the temperature up to 500 °C the time and temperature are adequate to remove the oxygen vacancy. This result is confirmed by previous studies which reported the stability of oxygen vacancy up to 400 °C.31,32 The calculated d spacing of (100) facet increased again to 2.8129 Å in the growth temperature of 500 °C because of the improvement in structure with ambient oxygen. The strain of structure is slightly decreased by increasing temperature from 28 × 10−4 to 12 × 10−4 (Table 3).

3.1.3. Film optical properties. Fig. 5 shows the optical absorbance spectra of ZnO nanorods grown on crystalline Al2O3 particles and pure crystalline Al2O3 particles which were peeled off from substrate and ultrasonically dispersed in the deionized water. The band gap of ZnO nanorods was determined from the cut-off wavelength as 1240/λm, where λm is the wavelength value corresponding to the typical absorption peak. As shown in Fig. 4, the cut-off wavelength of ZnO nanorods appeared in 363 nm. The cut-off wavelength corresponded to the calculated ZnO nanorods band gaps at 3.41 eV. The optical absorption edge of ZnO nanorods for ZnO structures grown at 300 °C and 500 °C was approximately identical.
image file: c6ra07801j-f5.tif
Fig. 5 Normalized UV-vis absorbance spectroscopy of ZnO nanorods grown on Al2O3 microfilters and pure Al2O3 particles.
3.1.4. Chemical photoactivity. Due to the fact that in this work the effects of relative humidity are investigated, the aqueous photocatalytic properties of ZnO nanorods should to be studied since the water molecule interfere in the oxidation and reduction reactions. Fig. 6 illustrates the aqueous photocatalytic degradation ability of the ZnO nanorods grown on the crystalline Al2O3 by ultraviolet and visible light. As shown in Fig. 6a, the ZnO nanorods indicate desirable properties in terms of the fast degradation methylene blue. In the first 10 minutes of irradiation, approximately 78% of methylene blue was degraded by ZnO nanorods prepared at 300 °C. By continuing the irradiation up to 20 min, approximately 98% of MB was degraded. This means that vertically grown ZnO nanorods display the desirable capability of rapidly degrading dyes such as methylene blue, which can be attributed to the high surface area and crystalline structure of ZnO nanorods. By increasing the growth temperature up to 400 °C and alternatively up to 500 °C, MB degradation was decreased. The photocatalytic activity can be influenced by parameters such as the crystallinity, grain size, crystal size, oxygen, and metal vacancy, as well as loading the metallic and non-metallic atoms in the structure. Although increasing the crystallinity of ZnO nanorods could improve the photoactivity properties of ZnO nanorods, the grain and crystal size, carbon or nitrogen loading effect, and oxygen vacancy play more important roles in the photocatalytic activity. In other words, the ZnO nanorods grown at 300 °C show the best photoactivity properties probably because of the carbon or nitrogen content in the ZnO structure that was affirmed by LECO result and XRD pattern in Fig. 4. By increasing the temperature up to 400 °C, the photocatalytic activity decreased due to the ejection of carbon and nitrogen atoms and the onset of oxygen vacancy. Once the temperature rises up to 500 °C, the photocatalytic activity decreased because of the growing crystalline and grain size of the ZnO nanorods, which leads to the lower surface area. As shown in Fig. 6b, degradation ability of MB by ZnO nanorods in visible light irradiation shows interesting capability in activation of grown ZnO nanorods in low energy light irradiation. This can be described by carbon and nitrogen loading with ZnO nanorods which can adjust the ZnO valence and conduction bands to absorb the larger wavelengths and produce electron–hole pairs (Fig. 6b). Simultaneous with ZnO/Al2O3 mixture, the photocatalytic properties of the pure powder of Al2O3 have also been investigated in this work. For pure crystalline Al2O3 particles, the result revealed no obvious changes in methylene blue degradation in 40 minutes of UV and visible irradiation.
image file: c6ra07801j-f6.tif
Fig. 6 Photocatalytic degradation of MB by ZnO nanorods grown on Al2O3 microfilters under UV (a) and visible light (b) irradiation.

3.2 Photocatalytic degradation of toluene

To investigate the photocatalytic degradation of toluene by ZnO nanorods, a set of experiments were conducted.
3.2.1. Effect of ZnO nanorods grain size. Nanostructured zinc oxide ZnO has a wide band gap for generating the electron–hole pairs. Photocatalytic reaction shows strong potential of degrading the VOCs, including BTEX pollutants. In the same environmental conditions of photocatalytic effects, two major parameters affect the photocatalytic properties: (i) generation of strong electron–hole pairs and prohibition of recombination; and (ii) specific surface area of ZnO nanostructure which can be exposed by light irradiation. As previously described, nitrogen and carbon loaded in the grown zinc oxide nanorods improved the photocatalytic properties of ZnO nanostructures. This improvement has been widely studied.21,33,34 Furthermore, despite the fact that specific surface area of grown ZnO nanorods is less than that of ZnO nanoparticles, once loading these materials as a single layer on the substrate surfaces, using ZnO nanorods indicates much more accessible surface area (with further mass ratio). Besides, in the heterogeneous reactions, the accessible surface area of deposited nanorod structure is apparently much more than that of spherical nanoparticles.

As mentioned before, the various conditions of ZnO nanorods growth are chosen to achieve different size of ZnO nanorods. Due the fact that the whole mass quantity of evaporated solution is the same, the total deposited mass quantity of ZnO nanorods will be the same. Hence, the number of grown ZnO nanorods on the alumina microfilter substrates rises up by decreasing the ZnO nanorods diameter. Moreover, a decrease in the ZnO nanorods dimension leads to the increase in the total surface area (Table 4).

Table 4 Calculated and measured specific surface area of ZnO nanorods
Parameter Value
300 400 500
ZnO nanorods dimension (nm) 2a1 = 70 2a2 = 100 2a3 = 180
Total mass of deposited ZnO (g) 0.722 0.722 0.722
Number of ZnO nanorods 3 × 10¹⁵ 1.5 × 10¹⁵ 0.5 × 10¹⁵
Volume of single ZnO nanorods (cm3) 2.68 × 10⁻¹⁵ 5.42 × 10⁻¹⁵ 16.84 × 10⁻¹⁵
Specific surface of single ZnO nanorods (m2) 168 × 10−6 240 × 10−6 432 × 10−7
Calculated total specific surface of ZnO nanorods (m2) 5.290 × 10¹¹ 3.603 × 10¹¹ 1.99 × 10¹¹
Measured total specific surface of ZnO nanorods (per 0.722 g) 465 382 269


Fig. 7 shows photodegradation of toluene by various grain size of ZnO nanorods under ultraviolet and visible light irradiation. Here, 200 ppbv of toluene gas stream with 200 mL min−1 flow rate and 10% relative humidity at 25 °C was chosen to study the effects of various grain size zinc oxide nanorods. As shown in Fig. 7a, by irradiation of UV light, approximately 85, 65, and 25% of toluene is degraded by first 10 minutes UV irradiation on grown ZnO nanorods at 300, 400, and 500 °C, respectively. By continuing the irradiation, just 15, 8, and 6% of toluene was degraded on grown ZnO nanorods at 300, 400, and 500 °C, respectively. Therefore, by the first cycle of gas permeation through the ZnO nanorods, the majority of toluene molecules break down and turn into other lightweight by-products. Decreasing the efficiency of degradation in the next cycles can be explained by the less interaction of toluene molecules with ˙OH and superoxide species. It must be noted that the photocatalytic reactions including oxidation and reduction of pollutants takes place by direct and indirect oxidation–reduction reactions. Some works have been conducted on improving the surface adsorption of BTEX molecules to increase degradation efficiency.35,36 Unlike the present study, they followed two mechanisms including: (a) adsorption and (b) degradation, to interfere in breaking down the pollutants. As shown in Fig. 7 and 3, permeation through the ZnO nanorods in horizontal and vertical moods prepares appropriate condition for enhancing the direct oxidation of toluene molecules. Thus, this causes a major degradation of toluene molecules at the first cycle of reaction (Fig. 7). As shown in Fig. 7a, an increase in the nanorods dimension and decrease in the specific surface area leads to a dynamic drop in toluene degradation potential. Fig. 7b shows photodegradation of toluene molecules under visible light irradiation.


image file: c6ra07801j-f7.tif
Fig. 7 Degradation of toluene molecules by various ZnO nanorods grown at 300, 400 and 500 °C and various irradiation light sources of UV (a) and visible light (b).

As described in the methylene blue photodegradation study, in addition to higher specific surface area of small diameter ZnO nanorods, the grown ZnO nanorods at low temperature of 300 °C (S3) shows high content of carbon and nitrogen which may loaded into ZnO wurtzite structure in the growing step. This carbon and nitrogen atoms loading provides low energy electron–holes generation activity which result in higher toluene molecules photodegradation. In general, according to the fact that the probable direct contacting and adsorption of toluene molecules on the surface of ZnO nanorods is more in higher concentration of toluene molecules, the direct oxidation of toluene molecules by generated electrons would conduct faster and efficiently. Hence, as shown in Fig. 7a, the photodegradation process at first 10 minutes for S3 and S4 which contains higher toluene concentration is quit considerable. Weaker toluene photodegradation by S5 in comparison to S3 and S4 in same concentrations can attribute to weaker photodegradation ability of grown ZnO nanordos at 500 °C due to carbon and nitrogen ejecting from ZnO structure and lower specific surface area of grown ZnO nanorods at 500 °C. Besides, after 10 minutes of photodegradation of toluene in circulating reactor, the concentration of toluene molecules drops and the photodegradation rate will decreases due to lower possibility of toluene adsorption and degradation at lower concentrations. As shown in Fig. 7b, degradation of toluene molecules under higher wavelength light shows capability of ZnO nanorods for being activated under low energy light irradiation. Degradation rate of toluene under visible light irradiation is apparently lower than that of VU light. Unlike the degradation of toluene molecules under UV light irradiation, 50, 40, and 30% of toluene molecules were degraded by 70, 100, and 180 nm ZnO nanorods under 120 minutes visible light irradiation, respectively. As shown in Table 4, the calculated and measured specific surface areas of ZnO nanorods are obviously different. This indicates that by decreasing the ZnO nanorods dimension, a major sidewall surface effect is diminished due to sidewall attaching of ZnO nanorods. This fact is illustrated in Fig. 3.

3.2.2. Effect of inlet flow rate. To investigate the gas flow rate on the degradation ability of ZnO nanorods, various toluene gas flow rates with constant concentration and relative humidity of 200 ppbv and 10% were chosen, respectively. Since gas flow rate in circulated systems is quite different from one-step permeation of toluene gas stream, the effects of one-step permeation was investigated to study the effect of gas flow rate on degradation of toluene molecules. As shown in Fig. 8, the increased gas flow rate up to 200 mL min−1 leads to the considerable change in degradation efficiency of toluene. However, by increasing the flow rate up to 400 mL min−1, the degradation efficiency of toluene gradually decreased. So, one can state that in the low gas flow rates of 100 and 200 mL min−1, the flow rate of inlet toluene gas does not sharply affect the degradation efficiency; however, by increasing the flow rates, the degradation efficiency of toluene molecules starts decreasing. Flow rate determines retention time of toluene molecules interact with reduction and oxidation species of reaction environment. As the direct contact oxidation and reduction reactions are more considerable than indirect reactions in the permeation systems, the toluene molecules interact with interfacial electron–hole pairs and oxidation and reduction radicals on the ZnO nanorod surface while passing through the ZnO nanorods surface. Accordingly, by passing the inlet toluene molecules through the jungle-like structure of ZnO nanorods, the probability of toluene molecule degradation enhances because of the increased contact probability between toluene molecules, interface oxidation, and reduction species. Subsequently, as shown in Fig. 8, increasing gas flow rate up to 200 mL min−1 does not limit the surface contact of toluene molecules and reactive species. As a result, degradation ability of ZnO nanorods does not decrease. On the other hand, an increase in the gas flow rate up to 400 mL min−1, the contact probability between toluene and reactive species deceases. Furthermore, presence of water molecules on the ZnO nanorods surface affects the degradation efficiency of toluene molecules by changing the absorption ability of the surface. So, by increasing the inlet gas flow rate, the probability of toluene molecule absorption by wet surface of ZnO nanorods decreases.
image file: c6ra07801j-f8.tif
Fig. 8 Degradation of toluene molecules by ZnO nanorods at various gas flow rates of 100, 200, 300, and 400 mL min−1.
3.2.3. Effect of inlet gas concentration. Decreasing the VOCs pollutant such as BTEX at high concentration is not as harder as low concentration of pollutants. Therefore, decreasing the existed BTEX pollutants at ppm level is more applicable in comparison with pollutant concentration at ppb level. This can be explained by the difficulty of pollutant molecule trapping and removing at the ppbv level. Recovering or degrading the toluene molecule at the ppbv level is among the concerns of many industries. Photocatalytic method is a promising method to degrade the BTEX pollutant such as toluene at the ppbv level. Fig. 9 shows degradation efficiency of toluene molecules by various ZnO nanorods at the inlet concentration of 100–400 ppbv in the constant flow rate and relative humidity of 200 mL min−1 and 10%, respectively. As shown in Fig. 9, at low inlet concentration of toluene, ZnO nanorods indicate strong degradation ability. However, increasing the toluene concentration up to 200 ppbv, the degradation efficiency slightly drops and again by increasing the toluene concentration up to 400 ppbv, the degradation efficiency gradually rises. As previously discussed, the majority of toluene molecule decomposes on the surface of the ZnO nanorods instead of gas environment. Thus, the activated sites and generated free radicals produced by existing humidity and oxygen molecules play the main role in toluene molecules decomposition. In this state, two mechanisms can describe the behavior of photocatalytic reactions: (a) oxidation of toluene molecules by electron–hole pairs directly on the ZnO nanorods solid–gas interface and; (b) oxidation of toluene molecules by free radical and super oxides in the solvent humidity shell on the ZnO nanorods surface. At the low toluene concentration of 100 ppbv, the free radicals show sufficient potential to degrade the absorbed toluene molecules in the water–gas interface. Nevertheless, by increasing the toluene concentration, degradation efficiency drops due to low access of toluene molecules on the wet surface of ZnO nanorods. As shown in Fig. 9, by increasing the toluene concentration up to 400 ppbv, the degradation efficiency slightly increases; which can be attributed to the increased toluene molecule absorption on the ZnO nanorods. In other words, by increasing the toluene concentration, as well as the free radicals oxidation mechanism, direct oxidation mechanism of toluene molecules governs the oxidation process.
image file: c6ra07801j-f9.tif
Fig. 9 Degradation of toluene molecules by ZnO nanorods at various gas concentration of 100, 200, 300, and 400 ppbv.
3.2.4. Effect of relative humidity. Relative humidity is among the most important factors of the photocatalytic reactions. To investigate the water molecules interfering in the photocatalytic reactions, a gas stream with various relative humidity ranging from 5 to 60% and the constant gas flow rate and concentration of 200 mL min−1 and 200 ppbv is chosen, respectively. Fig. 10 shows effects of various relative humidity on the photo-degradation of toluene molecules in the by-product species. As depicted in Fig. 10, by increasing the relative humidity from 5% up to 20%, degradation efficiency increases, but after a peak at highest efficiency of 20% relative humidity, increasing the relative humidity leads to lower efficiency. Some studies examine the effects of relative humidity in conversion and mineralization of BTEX pollutant.37 Through these researches, TiO2 was chosen as a photo catalyst for photoreactors.35–37 The existence of optimum relative humidity is different for various photoreactor conditions.37,38 Obee showed that there is an optimum level of 5% for relative humidity to reach the maximum efficiency of toluene degradation.38 However, in another study, Sleiman et al. reported no optimum for relative humidity. They believe that, the absorption competition between water and toluene molecules on the photocatalyst surface is the most important mechanism to study the relative humidity effects. They observed a slight decrease in conversion and mineralization efficiency by increasing the relative humidity. It must be noted that they used different photoreactor conditions in their study; 120 ppbv (ref. 37) versus 290 ppbv.38 Thus, other test condition such as concentration and gas flow rate can obviously affect the results. In the present study, there is a rise in the degradation efficiency of toluene molecules by increasing the relative humidity up to 20% (Fig. 10). Improving the degradation efficiency by increasing the relative humidity up to 5% was discussed by Obee et al. They reported that this increase can be explained by generating the free ˙OH radicals.38 Therefore, the increase of photodegradation efficiency can be attributed to the generation of new free radicals and superoxide species of water molecules existing on the ZnO nanorods surface. Decreasing the degradation efficiency up to 60% can be because of overloading of water molecules on the surface and competitive absorption mechanism which was confirmed by previous works.37,38 The interconnected parameter with relative humidity is the reaction temperature which can directly affect the results of relative humidity effects. So, the effects of reaction temperature were also investigated in this study.
image file: c6ra07801j-f10.tif
Fig. 10 Degradation of toluene molecules by ZnO nanorods at various relative humidity of 5 to 60%.
3.2.5. Effect of reaction temperature. A large number of researchers, who investigated the photo-degradation of VOCs, tried to keep the temperature as a constant parameter, especially in the room temperature.36,37,39 Nevertheless, in some works conducted on temperature effects, the gas temperature was mentioned as a reaction temperature,40 while we believe that the surface temperature of photocatalyst is the real reaction temperature since the majority of reactions occur on the surface of the photocatalysts instead of gas environments. This suggestion can be strengthen by increasing the surface temperature of photocatalyst by UV irradiation during the photoreaction. Therefore, to investigate the reaction temperature of photodegradation process in this study, the K-type thermocouple in contact with ZnO nanorods surface was used to adjust the reaction temperature. The ZnO nanorods surface temperature was controlled by inlet gas temperature prepared by thermoelectric heater/cooler system prior to photoreactor inlet. To investigate the temperature effects on toluene photodegradation, the surface temperature was adjusted between ranging temperature of 10 to 60 °C with constant gas flow rate, concentration, and relative humidity of 200 mL min−1, 200 ppbv, and 10%, respectively. As shown in Fig. 11, an increase in surface temperature of ZnO nanorods up to 30 °C leads to the rise of photodegradation efficiency of toluene molecules. Besides, by rising the surface temperature up to 60 °C, the photodegradation of toluene decreases. Improving the photodegradation efficiency up to 30 °C can be described by two approaches: (i) increasing the adsorption ratio of toluene molecules on the surface of ZnO nanorods; and (ii) hydroxide and superoxide species mobility which in turn can increase the probability of collision with toluene molecules. Moreover, at the temperatures above 30 °C, desorption of toluene and water molecules from the surface is dominant. Also, recombination of generated electron–hole pairs at high temperature is intensively accelerated.
image file: c6ra07801j-f11.tif
Fig. 11 Degradation of toluene molecules by ZnO nanorods at various reaction temperatures of 10 to 60 °C.

3.3 ZnO nanorods photocorrosion study

Under UV irradiation, the strong photogenerated electron could reach higher states of conduction band to oxidize the methylene blue or toluene molecules while leaving holes in the valence band which may contribute in photocorrosion of ZnO structure (Fig. 12a). In the carbon or nitrogen loaded ZnO nanorods, the lower energy photoexcitation occurs by irradiation of visible light wavelengths with enough energy which could oxidize the MB or toluene at higher wavelengths and generating hole at valence state which could play the same role in photocorrosion of ZnO nanorods. Hence, regardless of band gap tuning of ZnO nanorods by carbon and nitrogen loading, in case of no electron or hole scavenger, ZnO nanorods would corrode gradually. Accordingly, the charge scavengers like metals, semiconductors, and carbon base materials could extract the carriers to make ZnO nanostructures more stable in the photocatalyzing processes.
image file: c6ra07801j-f12.tif
Fig. 12 The photogeneration and photocorrosion mechanism of ZnO nanorods under UV and visible light irradiation in presence of toluene or MB molecules (a) and photocorrosion of ZnO nanorods in UV and visible light irradiation for 36 hours in DI water, MB in DI water and gaseous toluene in toluene removal reactor (b).

As discussed, ZnO could face a photocorrosion problem in the photocatalyzing processes. The photocorrosion is one of the important problems in photocatalyst technique.

As previously studied in some works, ZnO could decompose due to generated species in the aqueous solution.41–43 The possible mechanism was proposed by the strong reaction between generated ˙OH radicals (in presence of H2O) and MV2+ or MB˙ (in the polluted environment) with the oxygen of ZnO which causes dissolution of ZnO in the solution.44 So many attempts conducted to prevent the photocorrosion effect such as coupling the ZnO nanostructures by metals (such as Ag and stainless steel),41 semiconductors (such as TiO2 and CdS)45,46 and carbon based nanostructures (such as C60, CNT, and graphene).42,43,47,48 In this work, we studied the photocorrosion study of grown ZnO nanorods on the Al2O3 microfilter. To investigate the different photocorrosion effect we designed some experiments. (1) Irradiation of ZnO nanorods by UV and visible light in pure water. (2) Irradiation of ZnO nanorods by UV and visible light in MB polluted aqueous solution. (3) Irradiation of ZnO nanorods by UV or visible light in toluene removal reactor with 200 ppbv of toluene gas stream, 200 mL min−1 flow rate and 10% relative humidity at 25 °C. The concentration of Zn2+ was measured to compare the photocorrosion effect. In the toluene removal reactor, after the appointed time, the grown ZnO on Al2O3 microfilter was washed by same quantity of DI water used in study of ZnO photocorrosion by pure and MB polluted solution. According to the fact that alumina has a wide band gap with no electron or hole affinity in contacting with ZnO nanorods (Fig. 12b), the generated electrons and holes in the grown ZnO nanorods on the Al2O3 substrate act like the single ZnO nanorods. As shown in Fig. 12b, ZnO nanorods show photocorrosion in the UV and visible light irradiation simultaneous with degrading the MB in the aqueous solution. This means, concurrent with decomposition of methylene blue molecules into smaller groups, the photogenerated MB˙ and ˙OH could react with the oxygen of ZnO nanorods corroding the ZnO nanostructure into Zn2+ ions in the solution. To study the ZnO nanorods in degradation of toluene molecules, we conducted the same analysis using irradiation of UV and visible light in presence of toluene molecules. The photocorrosion of ZnO nanorods in presence of toluene molecules was almost same as pure water molecules showing low potential of toluene species radicals in corrosion of ZnO nanorods. It is worthy to mention that the present contents of moisture in the toluene removal reactor could play a main role in dissolving the toluene molecules and providing the ˙OH radicals which could capture the oxygen from ZnO nanorods. Hence, to protect the photocorrosion of ZnO nanorods, coupling the ZnO nanorods by proposed metals, semiconductors, or carbon base materials in the previous reports would enhance the performance of reactor including the photocatalyst activity and photocorrosion stability.

4. Conclusions

Vertical and uniform ZnO nanorods are grown by ESAP technique at various growth temperature of 300, 400, and 500 °C to investigate in degradation ability of toluene molecules. The results showed that growth of ZnO nanorods at 300 °C shows better photocatalytic activity because of the small grain and crystal sizes and probably carbon or nitrogen loaded structure of wurtzite. The grown ZnO nanorods indicate hexagonal wurtzite structure. The ZnO nanorods prepared at 300 °C display desirable band gap for rapid degradation of MB in approximately 20 minutes. To study the most important parameters on degradation ability of toluene molecules by ZnO nanorods, gas concentration, gas flow rate, relative humidity, reaction temperature, and various light sources were investigated. The results showed that alteration in gas concentration and flow rate affects the toluene degradation ability by direct and indirect oxidation and reduction mechanisms and absorption capability of ZnO nanorods surface in the various flow rates. In this system, 20% relative humidity and 30 °C reaction temperature were found as the optimum parameters in maximum toluene conversion.

Acknowledgements

The authors acknowledge financial support from ACECR at Tarbiat Modares University. The authors also acknowledge the Iran nanotechnology initiative council (INIC) for the partial support of this project.

Notes and references

  1. J. Zhao and X. Yang, Build. Environ., 2003, 38, 645–654 CrossRef.
  2. S. Wang, H. M. Ang and M. O. Tade, Environ. Int., 2007, 33, 694–705 CrossRef CAS PubMed.
  3. D. W. VanOsdell, M. K. Owen, L. B. Jaffe and L. E. Sparks, J. Air Waste Manage. Assoc., 1996, 46, 883–890 CAS.
  4. J. Peral, X. Domènech and D. F. Ollis, J. Chem. Technol. Biotechnol., 1997, 70, 117–140 CrossRef CAS.
  5. P. Pichat, J. Disdier, C. Hoang-Van, D. Mas, G. Goutailler and C. Gaysse, Catal. Today, 2000, 63, 363–369 CrossRef CAS.
  6. H. Huang, Y. He, Z. Lin, L. Kang and Y. Zhang, J. Phys. Chem. C, 2013, 117, 22986–22994 CAS.
  7. H. Huang, K. Xiao, K. Liu, S. Yu and Y. Zhang, Cryst. Growth Des., 2016, 16, 221–228 CAS.
  8. C.-H. Xue, R.-L. Wang, J. Zhang, S.-T. Jia and L.-Q. Tian, Mater. Lett., 2010, 64, 327–330 CrossRef CAS.
  9. Y. Sun, G. M. Fuge, N. A. Fox, D. J. Riley and M. N. R. Ashfold, Adv. Mater., 2005, 17, 2477–2481 CrossRef CAS.
  10. P. X. Gao and Z. L. Wang, J. Am. Chem. Soc., 2003, 125, 11299–11305 CrossRef CAS PubMed.
  11. L. Vayssieres, K. Keis, A. Hagfeldt and S.-E. Lindquist, Chem. Mater., 2001, 13, 4395–4398 CrossRef CAS.
  12. B. Liu, C. Feng, X. Zhang, L. Zhu, X. Wang, G. Zhang and D. Xu, CrystEngComm, 2016, 18, 1215–1222 RSC.
  13. D. Fu, G. Han and C. Meng, Mater. Lett., 2012, 72, 53–56 CrossRef CAS.
  14. G. Du, L. Zhang, Y. Feng, Y. Xu, Y. Sun, B. Ding and Q. Wang, Mater. Lett., 2012, 73, 86–88 CrossRef CAS.
  15. L. Wang, Y. Kang, X. Liu, S. Zhang, W. Huang and S. Wang, Sens. Actuators, B, 2012, 162, 237–243 CrossRef CAS.
  16. L. F. Da Silva, O. F. Lopes, A. C. Catto, W. Avansi, M. I. B. Bernardi, M. S. Li, C. Ribeiro and E. Longo, RSC Adv., 2016, 6, 2112–2118 RSC.
  17. N. Han, P. Hu, A. Zuo, D. Zhang, Y. Tian and Y. Chen, Sens. Actuators, B, 2010, 145, 114–119 CrossRef CAS.
  18. C. Thiandoume, J. Barjon, O. Ka, A. Lusson, P. Galtier and V. Sallet, J. Cryst. Growth, 2009, 311, 4311–4316 CrossRef CAS.
  19. Y. W. Heo, K. Ip, S. J. Pearton, D. P. Norton and J. D. Budai, Appl. Surf. Sci., 2006, 252, 7442–7448 CrossRef CAS.
  20. B. A. Nejand, S. Sanjabi and V. Ahmadi, Vacuum, 2010, 85, 400–405 CrossRef CAS.
  21. B. A. Nejand, S. Sanjabi and V. Ahmadi, Appl. Surf. Sci., 2011, 257, 10434–10442 CrossRef CAS.
  22. C. Zhang, J. Phys. Chem. Solids, 2010, 71, 364–369 CrossRef CAS.
  23. M. Eskandari, V. Ahmadi and S. Ahmadi, Phys. E, 2010, 42, 1683–1686 CrossRef CAS.
  24. M. Guo, C. Yang, M. Zhang, Y. Zhang, T. Ma, X. Wang and X. Wang, Electrochim. Acta, 2008, 53, 4633–4641 CrossRef CAS.
  25. D. Mishra, J. Mohapatra, M. Sharma, R. Chattarjee, S. Singh, S. Varma, S. Behera, S. K. Nayak and P. Entel, J. Magn. Magn. Mater., 2013, 329, 146–152 CrossRef CAS.
  26. M. Khatamian, A. Khandar, B. Divband, M. Haghighi and S. Ebrahimiasl, J. Mol. Catal. A: Chem., 2012, 365, 120–127 CrossRef CAS.
  27. U. Seetawan, S. Jugsujinda, T. Seetawan, C. Euvananont, C. Junin, C. Thanachayanont, P. Chainaronk and V. Amornkitbamrung, Solid State Sci., 2011, 13, 1599–1603 CrossRef CAS.
  28. X. Li, Y. Wang, W. Liu, G. Jiang and C. Zhu, Mater. Lett., 2012, 85, 25–28 CrossRef CAS.
  29. M. Ghosh, S. Ghosh, M. Seibt, K. Y. Rao, P. Peretzki and G. Mohan Rao, CrystEngComm, 2016, 18, 622–630 RSC.
  30. N. S. Han, H. S. Shim, J. H. Seo, S. Y. Kim, S. M. Park and J. K. Song, J. Appl. Phys., 2010, 107, 084306 CrossRef.
  31. D. F. Wang and T. J. Zhang, Solid State Commun., 2009, 149, 1947–1949 CrossRef CAS.
  32. L. Vlasenko and G. Watkins, Phys. Rev. B: Condens. Matter Mater. Phys., 2005, 71, 125210 CrossRef.
  33. Z. Li and S. Miyake, Appl. Surf. Sci., 2009, 255, 9149–9153 CrossRef CAS.
  34. J. M. Chappé, F. Vaz, L. Cunha, C. Moura, M. C. Marco de Lucas, L. Imhoff, S. Bourgeois and J. F. Pierson, Surf. Coat. Technol., 2008, 203, 804–807 CrossRef.
  35. H. P. Kuo, C. T. Wu and R. C. Hsu, Powder Technol., 2011, 210, 225–229 CrossRef CAS.
  36. L. Zou, Y. Luo, M. Hooper and E. Hu, Chem. Eng. Process., 2006, 45, 959–964 CrossRef CAS.
  37. M. Sleiman, P. Conchon, C. Ferronato and J.-M. Chovelon, Appl. Catal., B, 2009, 86, 159–165 CrossRef CAS.
  38. T. N. Obee and R. T. Brown, Environ. Sci. Technol., 1995, 29, 1223–1231 CrossRef CAS PubMed.
  39. J. Mo, Y. Zhang and Q. Xu, Appl. Catal., B, 2013, 132, 212–218 CrossRef.
  40. W. Liang, H. He and J. Li, Photo-catalytic degradation of volatile organic compounds (VOCs) over titanium dioxide thin film, INTECH Open Access Publisher, 2012 Search PubMed.
  41. C. Jiang, S. J. Moniz, M. Khraisheh and J. Tang, Chem.–Eur. J., 2014, 20, 12954–12961 CrossRef CAS PubMed.
  42. C. Han, M.-Q. Yang, B. Weng and Y.-J. Xu, Phys. Chem. Chem. Phys., 2014, 16, 16891–16903 RSC.
  43. H. Zhang, R. Zong and Y. Zhu, J. Phys. Chem. C, 2009, 113, 4605–4611 CAS.
  44. Y.-Q. Cao, J. Chen, H. Zhou, L. Zhu, X. Li, Z.-Y. Cao, D. Wu and A.-D. Li, Nanotechnology, 2014, 26, 024002 CrossRef PubMed.
  45. R. Sapkal, S. Shinde, T. Waghmode, S. Govindwar, K. Rajpure and C. Bhosale, J. Photochem. Photobiol., B, 2012, 110, 15–21 CrossRef CAS PubMed.
  46. X. Wang, G. Liu, G. Q. Lu and H.-M. Cheng, Int. J. Hydrogen Energy, 2010, 35, 8199–8205 CrossRef CAS.
  47. H. Fu, T. Xu, S. Zhu and Y. Zhu, Environ. Sci. Technol., 2008, 42, 8064–8069 CrossRef CAS PubMed.
  48. L. Zhang, H. Cheng, R. Zong and Y. Zhu, J. Phys. Chem. C, 2009, 113, 2368–2374 Search PubMed.

This journal is © The Royal Society of Chemistry 2016
Click here to see how this site uses Cookies. View our privacy policy here.