Depolarization effects of Li2FeSiO4 nanocrystals wrapped in different conductive carbon networks as cathodes for high performance lithium-ion batteries†
Kai Wang,
Wenju Ren,
Jinlong Yang*,
Rui Tan,
Yidong Liu and
Feng Pan*
School of Advanced Materials, Peking University Shenzhen Graduate School, Shenzhen 518055, China. E-mail: yangjl@pkusz.edu.cn; panfeng@pkusz.edu.cn
First published on 26th April 2016
Abstract
We report composite electrodes with Li2FeSiO4 (LFS) nanocrystals wrapped in three different types of conductive carbon such as Acetylene Black (AB), carbon nanotubes (CNT) and Ketjen Black (KB) to demonstrate depolarization effects on the electrochemical performance of Li-ions batteries. KB with a nanoporous structure and the largest surface area enabled the formation of the best electronic conductive-network with excellent capacity on the interface of LFS nanoparticles, showing reversible electrochemical activity. Compared to the electrodes of LFS wrapped in AB and CNT, the polarization of LFS particles wrapped in KB was reduced significantly due to high conductivity of the electrode, resulting in an increase of about 59.0% in the reversible capacity (269.0 mA h g−1, corresponding to 1.62 Li-storages) and obvious enhancement in the rate performance. By using the electrochemical analysis methods, we demonstrated the insight of discharge of more than one lithium ion at different voltages in the LFS@KB vs. LFS@AB and LFS@CNT electrodes, including interface capacity, Fe3+/Fe2+ and Fe4+/Fe3+ redox, respectively. The fundamental mechanism of enhanced electrochemical performance of LFS by creating a depolarization environment with optimized conductive carbon provides useful guidance to the future design of high performance LFS cathodes for LIBs.
Introduction
Rechargeable lithium batteries (LIBs) have been used widely for portable electronics, energy storage devices, hybrid electric vehicles (HEVs) and electric vehicles (EVs). Both high energy density and high power density of electrodes need to be improved continuously for applications of LIBs.1–4 Li2FeSiO4 (LFS), a full MO4 (M = Li, Si and Fe) tetrahedron structure material, has double the theoretical capacity (332 mA h g−1 for two Li-storages per molecule) of LiFePO4 (170 mA h g−1), with the practical advantages of high stability of Si–O frame structure, low cost and abundant sources, which is a very promising cathode material with high energy density and is safe for next generation advanced Li-ion batteries.5–7However, it is difficult to realize two Li-storages reversibly and stably due to the poor activity of LFS with low electronic conductivity (∼6 × 10⁻¹⁴ S cm−1) and Li-ionic diffusion coefficient (∼10−14 cm2 s−1).8–10 Only improvements of both the electronic conductivity and Li-ion transport might allow LFS cathodes to realize excellent specific capacity and rate performance. It has been widely accepted that nanomaterials are of significant importance in reducing the path lengths of lithium-ion/electron transport.11 Recently, our strategy has been further developed using high conducting network to facilitate fast current flow and reduce the interface polarization of nanostructured active materials to improve the utilization rate of active materials.12,13 Conductive nanocarbon is an appealing choice due to its low cost, high electronic conductivity, and favorable thermodynamic stability.14–16 Most conductive nanocarbon materials, including carbon nanoparticle (e.g. Acetylene Black (AB)), carbon nanotubes (CNT), graphene, and nanoporous carbon (e.g. Ketjen Black (KB)), have been widely employed to construct a conductive network surrounding the active materials to improve the electrochemical performance.12,13,17–22
Herein, we report composite electrodes with Li2FeSiO4 (LFS) nanocrystal wrapped in three different types of conductive carbon (AB, CNT and KB) networks. Compared to the electrodes of LFS wrapped in AB and CNT, the polarization of LFS particles wrapped in KB was reduced significantly to obviously enhance the reversible capacity (269.0 mA h g−1, corresponding to 1.62 Li-storages) and rate performance of LFS. Using electrochemical analysis methods, we demonstrated the insight of discharge of more than one lithium ions at different voltages in the LFS@KB vs. LFS@AB and LFS@CNT electrodes, including exceeded capacity from the interface effects on LFS nanoparticles, Fe3+/Fe2+ and Fe4+/Fe3+ redox, respectively.
Experimental
Synthesis of LFS nanocrystal
The LFS nanocrystal was synthesized by the sol–gel method. First, the aqueous solutions of LiAc·2H2O (36 mmol, SCRC, China), Fe(NO3)3·9H2O (18 mmol, SCRC, China) and ethanol solution with tetraethyl orthosilicate (TEOS) (18 mmol, Aladdin) were successively added into a round-bottom flask, and the aqueous solution of citric acid (18 mmol, SCRC, China) was then slowly dripped. After stirring continuously at 60 °C for 2 days, the solution turned into a hydrogel, which was further dried under 80 °C and ground by mechanically ball milling for 10 hours. Finally, the milled powder was pressed into pellets and calcined at 650 °C in argon flux for 10 h to obtain the LFS nanocrystal.Composite electrode fabrication
The composite electrodes were fabricated by grinding 70% of LFS nanocrystal and 20% of conductive nanocarbon (AB, CNT or KB) for 30 min; furthermore, 10% of poly-tetrafluoroethylene (PTFE) was mixed. After rolling over and over again, the mixture was pressed into an electrode slice and dried in a vacuum under 80 °C. The loading mass of the LFS active material in the electrode is ∼2.5 mg cm−2.Material characterization
The X-ray diffraction patterns (XRD) were collected with a Bruker D8-Advance diffractometer equipped with Cu-Kα radiation (λ = 1.5418 Å, resolution 0.02°). Rietveld refinements were performed using the TOPAS 4.2 package. X-ray photoelectron spectroscopy (XPS) was carried out using a Thermo Fisher ESCALAB 250X. Scanning electron microscopy (SEM) images were taken on a ZEISS SUPRA®55 field emission SEM and energy dispersive X-ray analysis (EDX) were tested by an OXFORD Aztec instrument. Transmission electron microscopy (TEM) and high resolution transmission electron microscopy (HRTEM) images were taken on a FEI Tecnai G2F30. The specific surface area was analyzed by Brunauer–Emmett–Teller (BET) nitrogen adsorption–desorption measurements using a Micromeritics ASAP 2020 HD88. The electronic conductivity was tested using the KDJ-1A four-point probe instrument of Guanzhou Kunde Technology Co. Ltd.Electrochemical measurements
The composite electrodes were tested with CR 2016-type coin cells assembled in a glove box filled with pure argon. The composite electrodes were used as a cathode, metallic lithium as the anode, Celgard 2400 polypropylene as the separator, and 1 M LiPF6 in EC and DMC (1![[thin space (1/6-em)]](https://www.rsc.org/images/entities/char_2009.gif) :
:![[thin space (1/6-em)]](https://www.rsc.org/images/entities/char_2009.gif) 1 by volume) as the electrolyte. Galvanostatic charge/discharge measurements were performed with a CT2001A multichannel battery testing system (Wuhan Land Electronic Co. Ltd, China) over the voltage range of 1.5–4.8 V. Cyclic voltammetry (CV) was carried out with a CHI 660e electrochemical workstation and electrochemical impedance spectrum (EIS) was obtained with ParStat 2273 (Princeton). All the abovementioned electrochemical tests were carried out at 30 °C.
1 by volume) as the electrolyte. Galvanostatic charge/discharge measurements were performed with a CT2001A multichannel battery testing system (Wuhan Land Electronic Co. Ltd, China) over the voltage range of 1.5–4.8 V. Cyclic voltammetry (CV) was carried out with a CHI 660e electrochemical workstation and electrochemical impedance spectrum (EIS) was obtained with ParStat 2273 (Princeton). All the abovementioned electrochemical tests were carried out at 30 °C.
Results and discussion
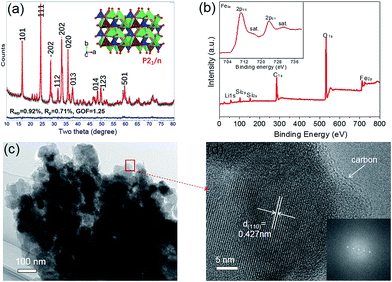
Fig. 1a shows the Rietveld XRD pattern of the synthesized LFS nanocrystals. The well-refined results (Table 1) proved that LFS with monoclinic structure of P21/n space group23,24 (a = 8.2417 Å, b = 5.0140 Å, c = 8.2248 Å, β = 98.9467°, and V = 335.754 Å3) was successfully synthesized, and impurities such as Fe3O4 or Li2SiO3 were not found in the XRD pattern of the LFS. The average crystal size of LFS determined by the Rietveld refinement was ∼48.7 nm. X-ray photo electron spectroscopy (XPS) spectrum is shown in Fig. 1b and S1.† It can be seen that all the elements in the samples could be tested in the XPS spectra, including C 1s, Li 1s, Fe 2p, Si 2s, Si 2p, and O 1s. The inset shown in Fig. 1b refers to the Fe 2p spectrum and the Fe 2p spectrum is split into two parts due to spin–orbit coupling, namely, Fe 2p3/2 and Fe 2p1/2. The binding energy (BE) peaks at 710.4 eV and 723.8 eV of Fe 2p could be assigned to Fe2+ and the BE satellite peaks at 715.0 eV is about 4.6 eV higher than that at 710.4 eV, which further demonstrates that only Fe2+ is present in the LFS nanocrystals as the energy separation between the main and the satellite peaks would be 8 eV for the Fe3+ contributions.9,25 The peak at 532.4 eV in the O 1s spectrum and the peak at 101.8 eV in the Si 2p spectrum can be assigned to the orthosilicate structure [SiO4].26 The SEM images (Fig. S2†) and TEM image (Fig. 1c) showed the morphology of the as-prepared LFS. The LFS are micron-sized agglomerates assembled with 40–50 nm prime nanoparticles, which is in accordance with the abovementioned average crystal size calculated from XRD results. The high resolution-transmission electron microscopy (HRTEM) image (Fig. 1d) displays clear lattice fringes with a d-spacing of 0.427 nm (corresponding to the (110) planes); the corresponding fast Fourier transformation (FFT) of the (110) planes is shown in the inset of Fig. 1d, which proves that the as-prepared LFS has good crystallinity. It can also be observed from Fig. 1d that LFS nanocrystals are coated uniformly by a ∼2 nm of carbon layer, which could enhance the electronic conductivity of the as-prepared LFS (as shown in Fig. 2d, the electronic conductivity of the as-prepared LFS is 5.6 × 10⁻⁸ S cm−1, which is much higher than that of the theoretical value for LFS (σT-LFS = 1.0 × 10⁻¹⁴ S cm−1)). Energy-dispersive X-ray spectroscopy (EDX) mapping was used to further investigate the distribution of key elements (O, Si, and Fe) in the LFS particles. As shown in Fig. S2b–e,† all three elements are distributed uniformly inside the as-prepared LFS particles. The abovementioned results indicated that the LFS nanocrystals with ultrathin carbon layer coating were successfully synthesized. The LFS nanocrystals were further wrapped in three different types of conductive nanocarbons (AB, CNT and KB) to form a composite as cathode electrodes for an investigation of the electrochemical performance.| Site | Np | x | y | z | Atom | Occ |
|---|---|---|---|---|---|---|
| a a = 8.2417 Å, b = 5.0140 Å, c = 8.2248 Å, β = 98.9467°, V = 335.754 Å3 and Cry-size = 48.7 nm. | ||||||
| Li1 | 4 | 0.66300 | 0.78500 | 0.66900 | Li+ | 1 |
| Li2 | 4 | 0.58500 | 0.19300 | 0.08400 | Li+ | 1 |
| Fe1 | 4 | 0.28934(62) | 0.79877(59) | 0.54376(59) | Fe2+ | 1 |
| Si1 | 4 | 0.04110(97) | 0.8040(12) | 0.7971(10) | Si4+ | 1 |
| O1 | 4 | 0.8646(23) | 0.7031(25) | 0.8167(21) | O2− | 1 |
| O2 | 4 | 0.4221(23) | 0.2168(17) | 0.8933(22) | O2− | 1 |
| O3 | 4 | 0.6914(23) | 0.7685(20) | 0.4322(22) | O2− | 1 |
| O4 | 4 | 0.9665(15) | 0.8618(14) | 0.2078(15) | O2− | 1 |
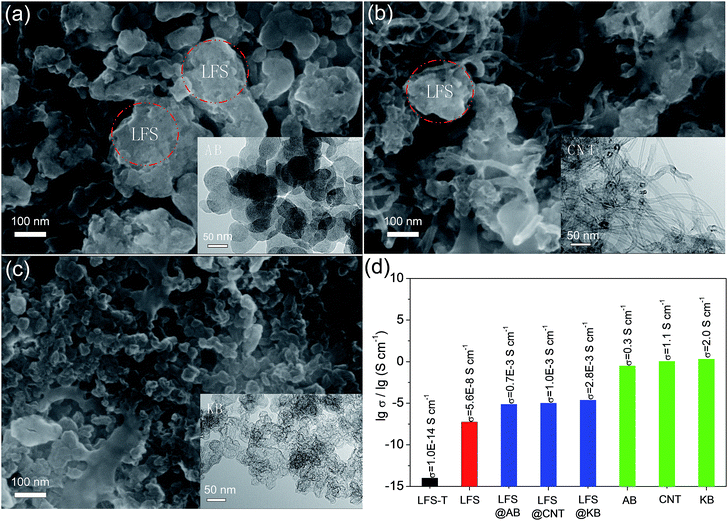 | ||
| Fig. 2 SEM images of (a) LFS@AB, (b) LFS@CNT and (c) LFS@KB electrodes (insets are the TEM images of (a) AB, (b) CNT and (c) KB); (d) relative logarithmic electric conductivities of the samples (the detailed methods and data seen in ESI†). | ||
Three representative conductive nanocarbons, such as AB, CNT and KB, were wrapped in LFS nanocrystal to fabricate composite electrodes, named as LFS@AB, LFS@CNT and LFS@KB, respectively. The SEM images of the composite electrodes for LFS@AB, LFS@CNT and LFS@KB are displayed in Fig. 2a–c and the TEM images of AB, CNT and KB are shown in the inset of Fig. 2a–c, respectively. It can be observed from the TEM images that the average diameter of the AB particle is ∼50 nm, the length and diameter of CNT are ∼5 μm and 15 nm, respectively, and KB has much a smaller particle size (∼10 nm in diameter) with much more porous structure. Nitrogen adsorption–desorption isotherms (Fig. S3†) were further taken to measure the porosity of AB, CNT and KB. The determined Brunauer–Emmett–Teller (BET) specific surface area of KB (1318.5 m2 g−1) is much larger than that of AB (54.3 m2 g−1) and CNT (190.4 m2 g−1), the main reason is because KB has much more pores of ∼7 nm than that of AB and CNT. The smaller particle size, higher BET specific surface areas and more mesoporous structure of KB would provide a continuous conductive network around the LFS nanocrystal. As shown in Fig. 2a–c, the composite electrode surface of LFS@KB is smooth and the LFS nanocrystal can be closely wrapped in KB very well, forming a contiguous conductive network in the electrode. While for LFS@AB, there exist a lot of vacancies between the LFS nanocrystal and AB, resulting the electronic transmission path is discontinuous. For LFS@CNT, the elasticity of CNT would facilitate the contact effect between LFS nanocrystals and form conductive network similar to KB. However, the CNT has a significant flaw of aggregation itself. The electrical conductivity of the conductive nanocarbons and the composite electrodes is shown in Fig. 2d. It can be seen that the electrical conductivity of LFS@KB is 4 times higher than that of LFS@AB and 2.8 times higher than that of LFS@CNT, which further confirmed the improved electrical conductivity of LFS@KB. The improved electrical conductivity with the well-wrapped LFS particles in KB should lead to significant depolarization in the electrode when electrons migrate under an electric field, and a facile electrochemical reaction kinetic is thus expected.
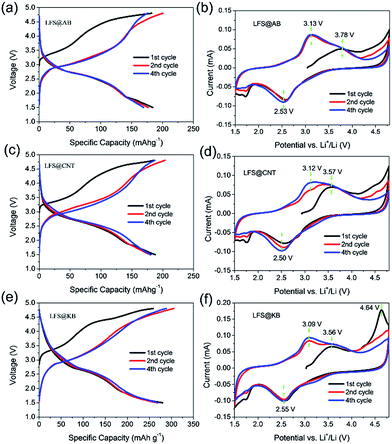
The charge–discharge profiles of LFS@AB, LFS@CNT and LFS@KB composite electrodes at low rate of 0.2C (1C = 166 mA g−1) are shown in Fig. 3a, c and e. The stable discharge capacities of LFS@AB, LFS@CNT and LFS@KB at 0.2C are 169.2, 181.1 and 269.0 mA h g−1, respectively, equaling to 1.02, 1.09 and 1.62 Li-ions per molecule to be discharged. Compared to LFS@AB, LFS@KB has an increase of 59.0% in the reversible capacity. That is to say, it is easier to achieve the charge/discharge of more than one Li+ at room temperature for the LFS@KB composites than that for LFS@AB and LFS@CNT. This is the best discharge capacity at room temperature as we know so far for pure Li2FeSiO4. Note that most of work that claimed to have more than one Li+ release of Li2FeSiO4 per molecule was achieved at an elevated temperature of 45 °C or more.9,10,27
Cyclic voltammetry (CV) curves are also used to investigate the excellent performance of LFS wrapped in KB. As shown in Fig. 3b, d and f, for LFS@KB, the anode peaks changed from 3.56 V to 3.09 V in the initial cycles, whereas for LFS@AB and LFS@CNT, the anode peaks changed from 3.78 V to 3.13 V and 3.57 V to 3.12 V, respectively. The migration of anode peaks indicated that LFS had a significant structural rearrangement in the initial cycles from a monoclinic Li2FeSiO4 (P21/n) to a thermodynamically stable orthorhombic Li2FeSiO4 (Pmn21), concomitant with the occurrence of significant Li/Fe antisite mixing.28,29 In addition, the polarized peak of LFS@KB (0.54 V) is smaller than that of LFS@AB (0.60 V) and LFS@CNT (0.62 V). Moreover, there is an anode peak at an extra 4.64 V in the first cycle for LFS@KB, which could be attributed to the Fe3+/Fe4+ redox couple.30,31 The abovementioned results indicated that the LFS nanocrystal well-wrapped in KB networks has less polarization, leading to a more facile electrochemical reaction kinetic for the deintercalation/intercalation of Li+ from/into the LFS nanocrystals, thus the charge/discharge capacity of LFS@KB is much higher than that of LFS@AB and LFS@CNT.
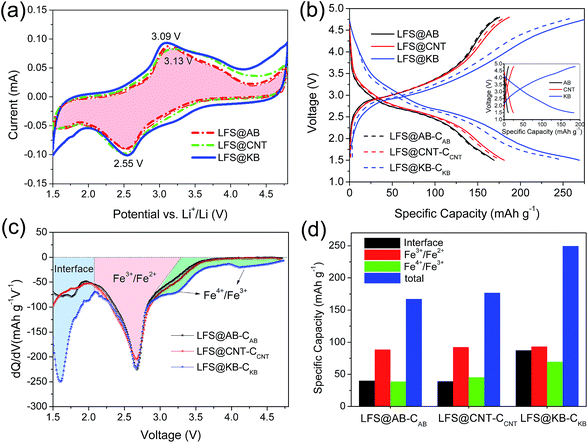
The CV integral area corresponds to the capacity of the electrode. As shown in Fig. 4a, the capacity increase of LFS@KB electrode runs through the entire voltage range from 1.5 to 4.8 V with a rapid increase at the low voltage (<2 V) by negative scanning and at high voltage (>4 V) by positive scanning. In order to investigate the Li-storage mechanism of LFS active material, the capacitance of carbons contributing to capacities should be deducted. Since the determined Brunauer–Emmett–Teller (BET) specific surface areas of KB (∼1318.5 m2 g−1) is much higher than that of AB (∼54.3 m2 g−1) and CNT (∼190.4 m2 g−1), the KB has much larger surface capacitance than that of AB and CNT in the composite electrodes. The capacitance curves of the conductive nanocarbons are shown in the inset of Fig. 4b, from which the capacitance contribution of conductive nanocarbons can be deducted by using the fitted capacitance curve to subtract the capacitance contribution at equal voltage dots (the fitted results are shown in Table S1†). The related charge–discharge curves of LFS nanocrystals with deduction of carbon capacitance are displayed as dotted curves in Fig. 4b. It can be observed that the discharge capacities of LFS@AB, LFS@CNT and LFS@KB after subtracting the capacitance are 167.2, 176.7 and 249.5 mA h g−1, respectively.
To further clarify the mechanism of the increased reversible capacity of LFS@KB, the differential capacities (dQ/dV) were calculated and plots of dQ/dV vs. voltage were prepared (Fig. 4c). The plots of dQ/dV vs. voltage provide similar information as that in cyclic voltammograms. Herein, we divided the dQ/dV vs. voltage curves of LFS@nanocarbon into three different parts, as reported earlier13 and the results are plotted as a histogram (Fig. 4d). The first part (region I) between 1.5 and 2.1 V can be attributed to exceeded capacity on the interface of LFS nanoparticles with carbon, which is similar to that reported for LFP-NP@NPCM (LiFePO4 nanoparticles embedded in a nanoporous carbon matrix) at low potential.19 The interfacial capacity in region I of LFS@KB is ∼87.3 mA h g−1, which is much higher than that of LFS@AB (∼40.0 mA h g−1) and LFS@CNT (∼39.2 mA h g−1). The high interfacial capacity in region I of LFS@KB is mainly because the high specific surface area and porous structure of KB could facilitate the contact with the LFS nanocrystals, leading to more Li-ions being stored on the interface. The second part (region II) is the plateau capacity of LFS at ∼2.8 V, corresponding to the reduction reaction of Fe3+ to Fe2+.32 The capacity in region II of LFS@AB, LFS@CNT and LFS@KB is 88.5, 92.3 and 93.0 mA h g−1, respectively, and the higher capacity of LFS@KB is mainly due to the higher electrical conductivity of LFS@KB electrodes than that of LFS@AB and LFS@CNT (Fig. 2d), which could cause the intercalation of Li-ions into the LFS nanocrystal more easily. The third part (region III) is related to the reduction reaction33,34 of Fe4+ to Fe3+ located at >3 V. The cathodic peak is clearly displayed in the depolarized LFS@KB electrode. The discharge capacity in region III of LFS@AB, LFS@CNT and LFS@KB is 38.7, 42.5 and 69.5 mA h g−1, respectively, which indicates that it is easier to achieve the reduction of Fe4+ to Fe3+ for the LFS@KB than that of LFS@AB and LFS@CNT during the lithium intercalation process. Therefore, the discharge of more than one lithium ion at different voltages in the LFS@KB vs. LFS@AB and LFS@CNT electrodes is attributed to three proportions, including exceeded interface capacity, Fe3+/Fe2+ and Fe4+/Fe3+ redox, respectively.
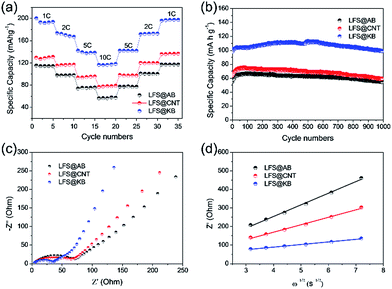
The cyclic performances of LFS@AB, LFS@CNT and LFS@KB at different rates are shown in Fig. 5a and the related charge–discharge curves are shown in Fig. S4.† At rates of 1, 2, 5 and 10C, the corresponding discharge capacities of LFS@KB are 193.9, 167.0, 138.4, and 118.3 mA h g−1, versus 131, 116.8, 95.7 and 79.1 mA h g−1 for LFS@CNT, and versus 114.3, 98.0, 75.9 and 57.4 mA h g−1 for LFS@AB, respectively. Obviously, the LFS@KB electrodes exhibit much better rate capability than LFS@CNT and LFS@AB. Fig. 5b shows the cyclic performances of LFS@AB, LFS@CNT and LFS@KB at a high rate current density of 10C (1C = 166 mA g−1) for 1000 cycles. It can be observed that LFS@KB has higher capacity (∼111.5 mA h g−1) than that of LFS@CNT (∼75.6 mA h g−1) and LFS@AB (∼65.3 mA h g−1). After cycling for 1000 cycles, the discharge capacity of LFS@KB electrode remains 88.8%, whereas LFS@AB only remains 83.0% and LFS@CNT only remains 78.7%. The abovementioned results indicated that LFS@KB has better rate performance than that of LFS@AB and LFS@CNT.
The electrochemical impedance spectra (EIS) were used to further investigate the excellent electrochemical performance mechanism of LFS@KB. The Nyquist plots of the composite electrodes are shown in Fig. 5c. The small intercept in the high frequency region corresponds to the resistance of the electrolyte (Re), the depressed semicircle in the medium frequency region corresponds to the charge transfer resistance between electrode/electrolyte interface (Rct) and the straight sloping line in the low frequency region is associated with lithium ion diffusion in the cathode.9,35 The resistance of electrolyte (Re) of all the batteries are about 3.8 Ω. The charge-transfer resistances (Rct) for LFS@AB, LFS@CNT and LFS@KB are 69.8, 66.3 and 32.6 Ω, respectively. The lower Rct of LFS@KB indicates that the LFS@KB electrode has better electronic transport than that of the LFS@AB and LFS@CNT, indicating that the polarization of LFS particles was reduced significantly due to the higher conductivity of LFS@KB electrodes. The lithium-ion diffusion coefficient of the composite electrodes can be calculated from the low frequency line according to the following equations:
| DLi = R2T2/2A2n4F4C2σ2 | (1) |
| Z′ = Re + Rct + σω−1/2 | (2) |
Conclusions
Li2FeSiO4 (LFS) nanocrystal wrapped in three different types of conductive carbon (AB, CNT and KB) network was fabricated as cathode electrodes for advanced Li-ion batteries. Compared to the electrodes with a conventional conductive carbon (AB and CNT) network, the LFS@KB electrode had an increased the reversible capacity of about 59.0% (269.0 mA h g−1, corresponding to 1.62 Li-storages) and obvious improvement in the rate performance than that of LFS@AB and LFS@CNT. The improved electrochemical performance of LFS@KB was attributed to the depolarization effect of LFS nanocrystals wrapped in the KB network, with enhanced electrochemical reaction kinetics. Electrochemical analysis methods further proved that the discharge of more than one lithium ion for LFS can be attributed to three portions, including interface capacity, Fe3+/Fe2+ and Fe4+/Fe3+ redox, respectively. The understanding mechanism of the discharge of more than one lithium ion for LFS by creating depolarization environment would provide useful guidance to the future design and applications of LFS cathodes.Acknowledgements
The research was financially supported by the Guangdong Innovation Team Project (No. 2013N080), the Shenzhen Science and Technology Research Grant (No. JCYJ20140903101633318, peacock plan KYPT20141016105435850), and the Postdoctoral Science Foundation (2015M570881).Notes and references
- D. Larcher and J. Tarascon, Nat. Chem., 2015, 7, 19–29 CrossRef CAS PubMed.
- M. Armand and J.-M. Tarascon, Nature, 2008, 451, 652–657 CrossRef CAS PubMed.
- K. Kang, Y. S. Meng, J. Bréger, C. P. Grey and G. Ceder, Science, 2006, 311, 977–980 CrossRef CAS PubMed.
- J.-M. Tarascon and M. Armand, Nature, 2001, 414, 359–367 CrossRef CAS PubMed.
- S. Ferrari, D. Capsoni, S. Casino, M. Destro, C. Gerbaldi and M. Bini, Phys. Chem. Chem. Phys., 2014, 16, 10353–10366 RSC.
- M. S. Islam, R. Dominko, C. Masquelier, C. Sirisopanaporn, A. R. Armstrong and P. G. Bruce, J. Mater. Chem., 2011, 21, 9811–9818 RSC.
- C. Masquelier and L. Croguennec, Chem. Rev., 2013, 113, 6552–6591 CrossRef CAS PubMed.
- R. Tan, J. Yang, J. Zheng, K. Wang, L. Lin, S. Ji, J. Liu and F. Pan, Nano Energy, 2015, 16, 112–121 CrossRef CAS.
- H. Gao, Z. Hu, K. Zhang, F. Cheng and J. Chen, Chem. Commun., 2013, 49, 3040–3042 RSC.
- R. Fu, Y. Li, H. Yang, Y. Zhang and X. Cheng, J. Electrochem. Soc., 2013, 160, A3048–A3053 CrossRef CAS.
- H. Guo, X. Song, Z. Zhuo, J. Hu, T. Liu, Y. Duan, J. Zheng, Z. Chen, W. Yang, K. Amine and F. Pan, Nano Lett., 2016, 16(1), 601–608 CrossRef CAS PubMed.
- Z. Wu, X. Han, J. Zheng, Y. Wei, R. Qiao, F. Shen, J. Dai, L. Hu, K. Xu and Y. Lin, Nano Lett., 2014, 14, 4700–4706 CrossRef CAS PubMed.
- J. Yang, L. Hu, J. Zheng, D. He, L. Tian, S. Mu and F. Pan, J. Mater. Chem. A, 2015, 3, 9601–9608 CAS.
- G. Yang, H. Song, H. Cui, Y. Liu and C. Wang, Nano Energy, 2013, 2, 579–585 CrossRef CAS.
- D. S. Su, S. Perathoner and G. Centi, Chem. Rev., 2013, 113, 5782–5816 CrossRef CAS PubMed.
- Y. Zhai, Y. Dou, D. Zhao, P. F. Fulvio, R. T. Mayes and S. Dai, Adv. Mater., 2011, 23, 4828–4850 CrossRef CAS PubMed.
- K. T. Lee, J. C. Lytle, N. S. Ergang, S. M. Oh and A. Stein, Adv. Funct. Mater., 2005, 15, 547–556 CrossRef CAS.
- E. Irisarri, A. Ponrouch and M. Palacin, J. Electrochem. Soc., 2015, 162, A2476–A2482 CrossRef CAS.
- X. L. Wu, L. Y. Jiang, F. F. Cao, Y. G. Guo and L. J. Wan, Adv. Mater., 2009, 21, 2710–2714 CrossRef CAS.
- X. L. Wu, Y. G. Guo, J. Su, J. W. Xiong, Y. L. Zhang and L. J. Wan, Adv. Energy Mater., 2013, 3, 1155–1160 CrossRef CAS.
- J. Yang, X. Kang, L. Hu, X. Gong and S. Mu, J. Mater. Chem. A, 2014, 2, 6870–6878 CAS.
- L. Zhang, J. Ni, W. Wang, J. Guo and L. Li, J. Mater. Chem. A, 2015, 3, 11782–11786 CAS.
- K. Wang, G. Teng, J. Yang, R. Tan, Y. Duan, J. Zheng and F. Pan, J. Mater. Chem. A, 2015, 3, 24437–24445 CAS.
- C. Sirisopanaporn, C. Masquelier, P. G. Bruce, A. R. Armstrong and R. Dominko, J. Am. Chem. Soc., 2010, 133, 1263–1265 CrossRef PubMed.
- M. Aronniemi, J. Sainio and J. Lahtinen, Surf. Sci., 2005, 578, 108–123 CrossRef CAS.
- C. Satriano, E. Conte and G. Marletta, Langmuir, 2001, 17, 2243–2250 CrossRef CAS.
- D. Rangappa, K. D. Murukanahally, T. Tomai, A. Unemoto and I. Honma, Nano Lett., 2012, 12, 1146–1151 CrossRef CAS PubMed.
- A. Nytén, S. Kamali, L. Häggström, T. Gustafsson and J. O. Thomas, J. Mater. Chem., 2006, 16, 2266–2272 RSC.
- T. Masese, Y. Orikasa, C. D. Tassel, J. Kim, T. Minato, H. Arai, T. Mori, K. Yamamoto, Y. Kobayashi and H. Kageyama, Chem. Mater., 2014, 26, 1380–1384 CrossRef CAS.
- D. Lv, W. Wen, X. Huang, J. Bai, J. Mi, S. Wu and Y. Yang, J. Mater. Chem., 2011, 21, 9506–9512 RSC.
- L.-L. Zhang, S. Duan, X.-L. Yang, G. Liang, Y.-H. Huang, X.-Z. Cao, J. Yang, M. Li, M. C. Croft and C. Lewis, J. Power Sources, 2015, 274, 194–202 CrossRef CAS.
- A. Nyten, A. Abouimrane, M. Armand, T. Gustafsson and J. O. Thomas, Electrochem. Commun., 2005, 7, 156–160 CrossRef CAS.
- X. Wu, X. Jiang, Q. Huo and Y. Zhang, Electrochim. Acta, 2012, 80, 50–55 CrossRef CAS.
- A. W. Brownrigg, G. Mountjoy, A. V. Chadwick, M. Alfredsson, W. Bras, J. Billaud, A. R. Armstrong, P. G. Bruce, R. Dominko and E. M. Kelder, J. Mater. Chem. A, 2015, 3, 7314–7322 CAS.
- L. L. Zhang, S. Duan, X. L. Yang, G. Liang, Y. H. Huang, X. Z. Cao, J. Yang, S. B. Ni and M. Li, Sci. Rep., 2014, 4, 5064 CAS.
Footnote |
| † Electronic supplementary information (ESI) available: XPS, SEM, EDX, BET, charge/discharge curves, fitted capacitance. See DOI: 10.1039/c6ra07755b |
| This journal is © The Royal Society of Chemistry 2016 |

