
A novel magnetic calcium silicate/graphene oxide composite material for selective adsorption of acridine orange from aqueous solutions†
Huan Wangab,
Youning Chenb and
Yinmao Wei*a
aKey Laboratory of Synthetic and Natural Function Molecule Chemistry of Ministry of Education, College of Chemistry & Materials Science, Northwest University, Xi'an 710069, China. E-mail: ymwei@nwu.edu.cn; Fax: +86-29-88302604; Tel: +86-29-88302604
bCollege of Chemistry and Chemical Engineering, Xianyang Normal College, Xianyang 712000, China
First published on 31st March 2016
Abstract
A novel magnetic calcium silicate graphene oxide composite adsorbent (MGSi) was synthesized using a two-phase coprecipitation method. MGSi adsorbent was characterized by transmission electron microscopy (TEM), field emission transmission electron microscopy (HRTEM), X-ray powder diffraction (XRD) and Fourier transform infrared spectrometry (FTIR). The results showed that the coated Fe3O4 nanoparticles with calcium silicate were firmly immobilized on the surface of graphene oxide, and were not easy fall off in the adsorption process compared to normal magnetic graphene oxide (MG) synthesized using the coprecipitation method. The MGSi composite exhibited selective adsorption of the alkaline dye. Acridine orange (AO) was the selected target to be absorbed by MGSi, and batch studies were conducted to evaluate the effects of regulating various parameters, such as the contact time, temperature, initial concentration and solution pH, on the adsorption performance of AO. The adsorption of AO followed pseudo-second-order kinetics, and the equilibrium adsorption was well described by the Freundlich isotherm model. The results of repeated adsorption–desorption cycles indicated that MGSi can be used repeatedly for three cycles. Therefore, the adsorbent could be effectively used to remove AO from wastewater.
1 Introduction
Annually, millions of tons of dyes are consumed by the textiles, papermaking, cosmetics and other industries, leading to a large quantity of wastewater.1 Dye wastewater is toxic and carcinogenic to living organisms,2 resulting in serious environment concerns. The technologies that are actively explored for the removal of dyes include chemical precipitation, adsorption, membrane filtration, biological treatment and photocatalytic degradation.3 Among these methods, adsorption is the most effective and widely used approach due to its relatively low cost, ease of operation, and fewer harmful secondary products.4 The effectiveness of adsorption primarily depends on the performance of the adsorbent. However, traditional adsorbents including activated carbon, silica, metal oxides and polymer resins suffer from either low adsorption capacities or low efficiency.5–10Recently, much effort has been focused on the development of new carbon materials, such as carbon nanotubes,11 graphene12 and complexes.13–16 Graphene has attracted considerable attention for adsorption due to its high specific surface area.17–21 However, graphene is difficult to directly use as an adsorbent due to its strong hydrophobicity and facile aggregation. Therefore, hydrophilic graphene oxide (GO), derivatives of GO and composite graphene materials have been explored as adsorbents. Among the composite graphene oxides, magnetic graphene oxide nanocomposite adsorbents have been extensively investigated due to the advantages of magnetic separation.22–24 The preparation methods primarily include crosslinking, chemical coprecipitation, hydrothermal reduction, solvothermal and microwave irradiation heating methods.25 Among these methods, the chemical coprecipitation method is the most commonly used method.26
In the coprecipitation method, Fe3+ and Fe2+ solutions are typically added in a dropwise fashion to the graphene oxide solution at a certain proportion, under nitrogen atmosphere with vigorous stirring, exchanging of Fe3+ and Fe2+ with H+ of the carboxyl groups on the surface of graphene oxide. Then, the solution is adjusted to alkaline, resulting in the coprecipitation of Fe3O4 particles and GO to generate a magnetic graphene oxide composite.27 By using the coprecipitation method, Wu et al.28 prepared a graphene-based magnetic nanocomposite that was used for the first time as an effective adsorbent for the preconcentration of five carbamate pesticides from wastewater. Deng et al.29 prepared a magnetic graphene oxide with ferrous ammonium sulfate and ammonium ferric sulfate as the iron source. This material was used for the simultaneous removal of Cd(II) and ionic dyes including methylene blue and orange G. Although the coprecipitation method is simple, the loaded Fe3O4 nanoparticles on the graphene oxide, which are precipitated directly on the surface of graphene oxide, are not firmly immobilized and tend to fall off, which decreases the stability and reusability of the adsorbent.29
To improve the adhesive strength between the Fe3O4 nanoparticles and the graphene oxide, we have developed a two-phase coprecipitation method to prepare a magnetic calcium silicate/graphene oxide composite (MGSi). The two-phase coprecipitation method is an improved coprecipitation method30 that involves the addition of a precipitant to the two-phase liquid system. For example, a core/shell structured nanocomposite, which consists of magnetic iron oxide nanoparticles as the core and calcium silicate as the shell, was synthesized under ultrasound irradiation using the two-phase system. In this system, the hydrophobic phase was composed of hydrophobic Fe3O4 nanoparticles and tetraethyl orthosilicate (TEOS), and the water phase consisted of Ca(NO3)2, NaOH and water.31 If an inert hydrophobic solvent (i.e., isooctane) was added to this reaction system prior to ultrasound irradiation, a hollow mesoporous nanocomposite would be obtained.31 In this study, a modified two-phase reaction system where graphene oxide was added to the aqueous phase was employed. Therefore, Fe3O4 nanoparticles were coated with calcium silicate and further cohered on the surface of the graphene oxide, leading to a tight joint between the Fe3O4 nanoparticle and graphene oxide within the interior of MGSi. The resulting composite (MGSi) was used as an adsorbent for dye water purification, and its adsorption properties were investigated.
2 Experiments
2.1 Materials
Flake graphite (99.95%) was supplied by Qingdao Chenyang Graphite Co., Ltd. (Qingdao, China). Ferric chloride hexahydrate and ferrous chloride tetrahydrate were purchased from the National Medicine Group Chemical Reagent Co., Ltd. (Shanghai, China). Acridine orange was purchased from the Aladdin Chemical Reagent Co., Ltd. (Shanghai, China), and the other reagents were of analytical grade.GO was prepared from the flake graphite powder using a modified Hummers–Offeman method.32
2.2 Preparation of composite material
MG was prepared as a control to evaluate the properties of MGSi. Briefly, FeCl3·6H2O (0.1162 g) and FeCl2·4H2O (0.4275 g) were added to distilled water (25 mL) under a N2 atmosphere. After treatment with ultrasound for 30 min, 100 mL of a graphene oxide (0.1 g) aqueous solution was added dropwise at a rate of 10 mL min−1. The following steps are similar to those employed in the preparation of the Fe3O4 nanoparticles. The ground sample is referred to as MG.
2.3 Characterization of materials
MG and 2-MGSi were characterized by transmission electron microscopy (TEM, H-600 microscope, Japan) and field emission transmission electron microscopy (HRTEM, Tecnai G2 F20 S-TWIN, American). GO, MSi and 2-MGSi were studied by Fourier transform infrared spectrometry (FTIR, Nicolet iS10, American). FT-IR samples were prepared by grinding dried GO, MSi and 2-MGSi together with potassium bromide (KBr) to make a pellet. GO, MSi and 2-MGSi were identified by X-ray diffractometer (XRD, D2 PHASER, Germany) with a Cu Kα radiation at 40 kV and 30 mA over the 2θ range of 5–80° at a scanning speed of 4° min−1 with a sampling angle interval of 0.048. The specific surface area and gas adsorption isotherm of the sample were tested on a N2 physisorption measurement (BET, ASAP 2020C, American). Zeta potential was carried out on Zetasizer Nano ZS.2.4 Adsorption experiments
 | (1) |
The kinetic curve was obtained by plotting qe as a function of the adsorption time. The effects of the pH of the solution as well as the sodium chloride and isopropyl alcohol in the solution on the adsorption capacity of MGSi were investigated using the procedure described as above.
To study the competition adsorption of MGSi for the alkaline dye, 0.01 g of 2-MGSi was added to 100 mL of orange–crystal violet, crystal violet–methylene blue, acridine orange–methylene blue and acridine orange–crystal violet–methylene blue solutions with an initial concentration was 10 mg L−1. Then, after adsorption equilibrium, the absorbance of acridine orange, crystal violet and methylene blue were measured at 485 nm, 580 nm and 666 nm, respectively, and the removal efficiency of the dye (E) was calculated using formula (2).
 | (2) |
3 Results and discussion
3.1 Synthesis process of MGSi
The proposed two-phase coprecipitation process for MGSi is shown in Fig. 1, and the TEM micrograph of each formation stage of MGSi is shown in Fig. 2. The initial reaction system was composed of a water phase and an organic phase. The water phase consisted of graphene oxide dispersed in a Ca(NO3)2 aqueous solution. The hydrophobic phase consisted of tetraethyl orthosilicate (TEOS) and Fe3O4 nanoparticles that were modified by oleic acid prior to ultrasound irradiation (Step 1, Fig. 1). As shown in Fig. 2a, the diameter of the Fe3O4 nanoparticles in the hydrophobic phase was approximately 10 nm, and the graphene oxide in the aqueous phase was a single layer structure (Fig. 2b). As shown in Step 2 (Fig. 1), small hydrophobic drops, which included Fe3O4 nanoparticles, formed and were dispersed in a water phase after ultrasound irradiation for 30 min. The Fe3O4 nanoparticles were deposited on the graphene oxide film layer. However, the calcium silicate coating was not yet formed after 30 min of ultrasound treatment (Fig. 2c). In Step 3, as NaOH was added, Ca(OH)2 was formed. However, the Ca(OH)2 precipitate was less stable than calcium silicate. Therefore, Ca(OH)2 reacted with the TEOS hydrophobic liquid that contained Fe3O4 nanoparticles to produce calcium silicate (CS). A calcium silicate layer was formed on the surface of the Fe3O4 nanoparticles under ultrasound irradiation. During the formation of the CS, the Fe3O4 nanoparticles in the small hydrophobic drops gradually aggregated in the centre and self-assembled with graphene oxide. MGSi formed after the addition of the NaOH solution, as shown in Fig. 2d and e. Fig. 2f showed a representative high-resolution TEM image of MGSi. The lattice spacing (0.294 nm) of Fe3O4 nanoparticles can be found in Fig. 2f, which could be ascribed to the plane spacing of d220.34 The another individual lattice spacing is 0.505 nm, corresponding to the crystal plane of CS. Using these three steps, the magnetic calcium silicate graphene oxide composite materials (MGSi) was obtained.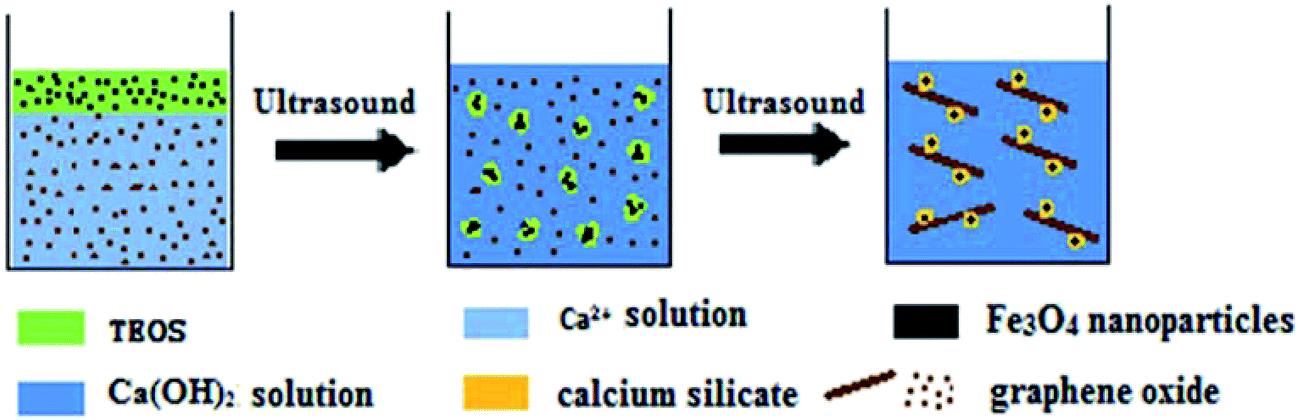 | ||
| Fig. 1 Formation process of MGSi. | ||
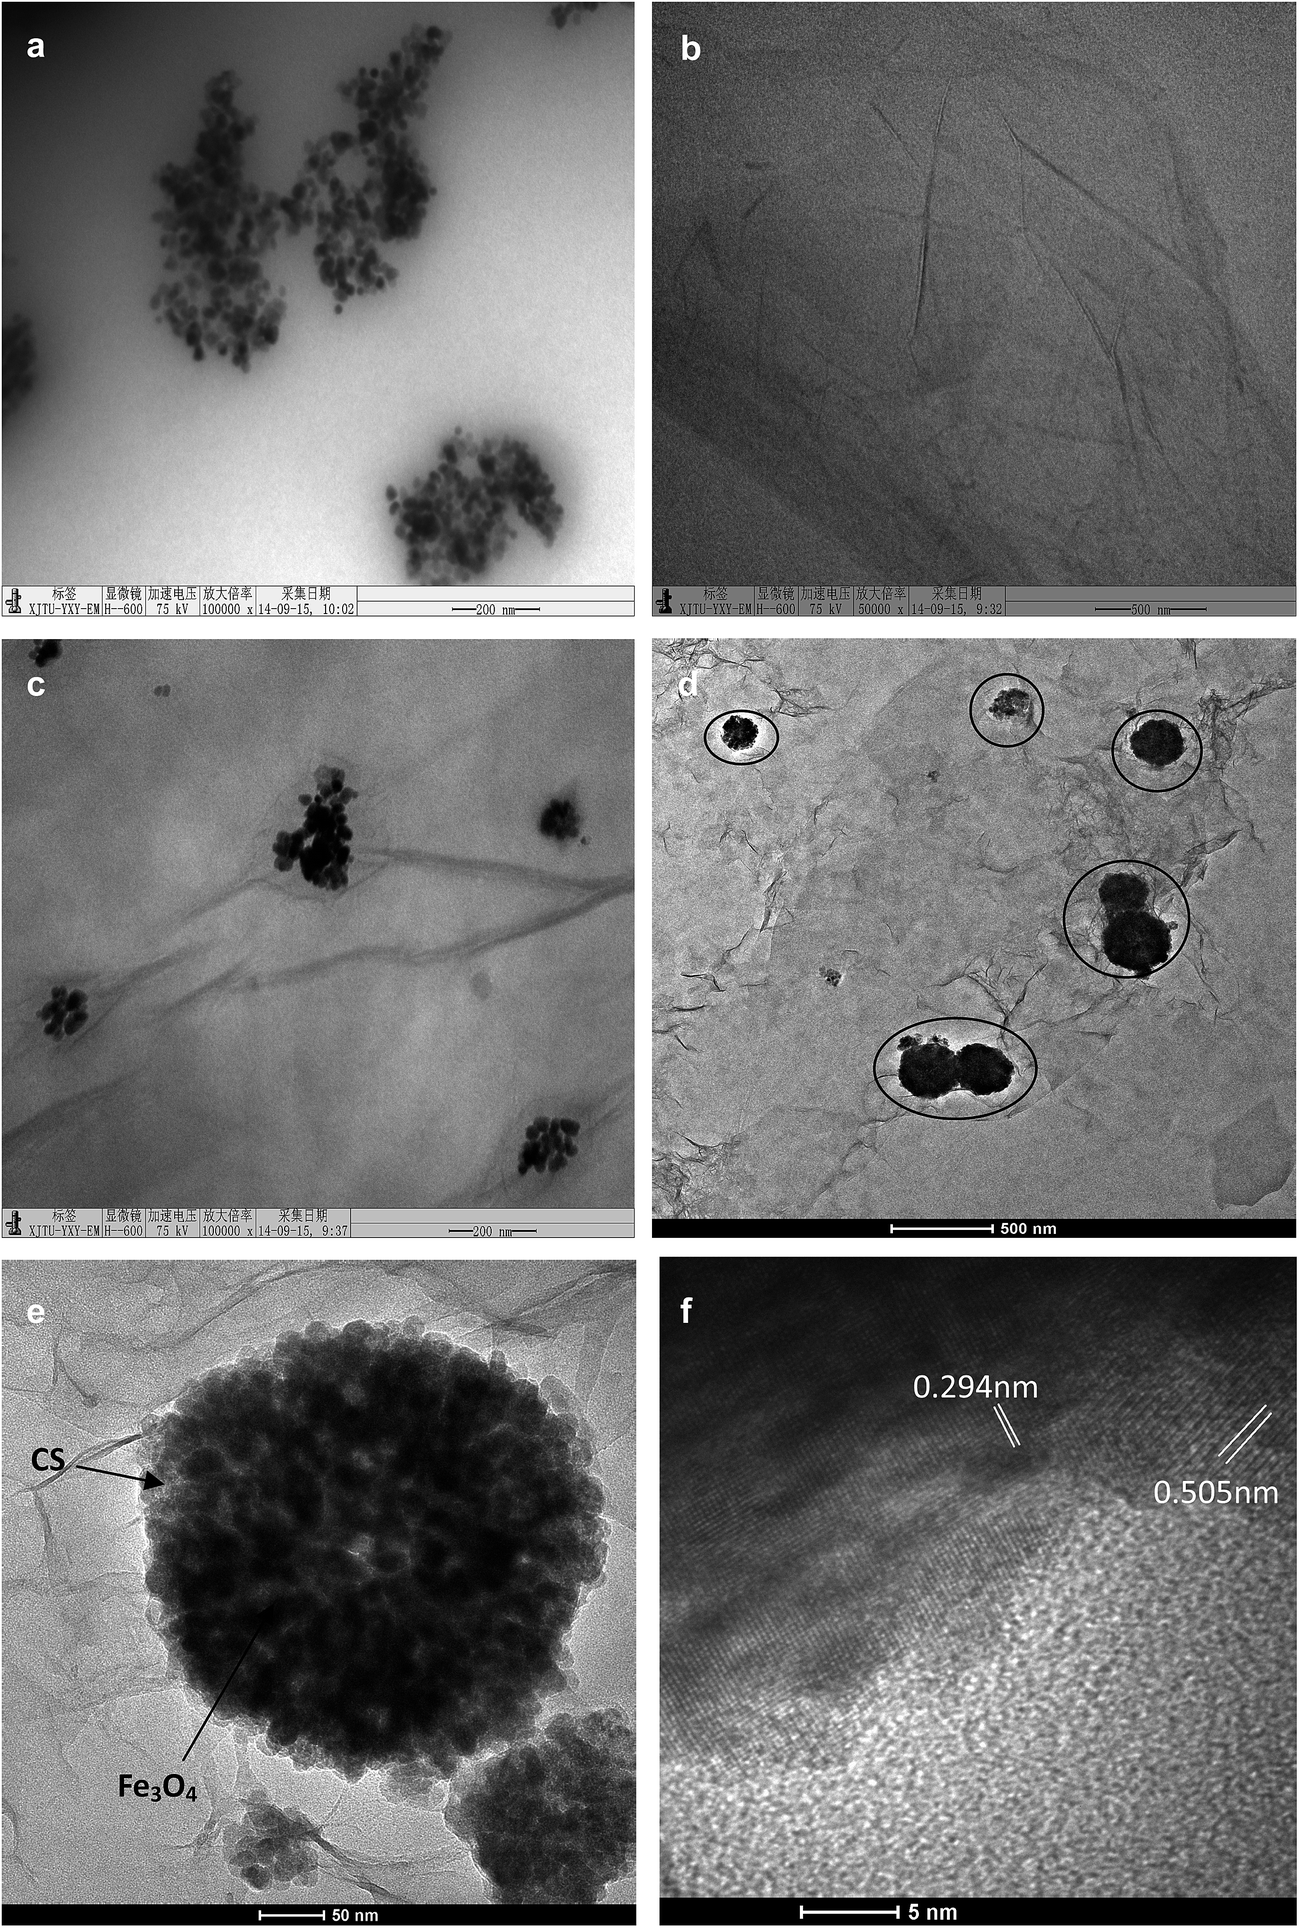 | ||
| Fig. 2 TEM and HRTEM images of MGSi. (a) Fe3O4 nanoparticles in hydrophobic phase; (b) graphene oxide in Ca(NO3)2 solution; (c) small hydrophobic drops that included Fe3O4 nanoparticles after ultrasound irradiation for 30 minutes; (d) graphene oxide composite materials formed after NaOH was added; (e and f) HRTEM of MGSi. | ||
3.2 Characterization of MGSi
Fig. 3 illustrates the XRD patterns of the as-prepared GO, MSi and 2-MGSi. The pattern of GO shows a very intense and sharp peak, appeared at 11.5°. This was along with a wide diffraction peak at 22.9°, which was attributed to the short-range order in stacked graphene sheets.35 From Fig. 3c, it can be observed that the diffraction peak at 22.9°, which indicates the existence of GO. Moreover, five primary diffraction peaks for Fe3O4, appearing at 29.2°, 35.4°, 43.1°, 57.3° and 62.7°, can be seen clearly in MSi and 2-MGSi. These peaks belonged to the (220), (311), (400), (511) and (440) planes, respectively (JCPDS card: 019-0629). It has been found that MSi and 2-MGSi have the CS phase (Ca5Si6O16(OH)2·8H2O, JCPDS 29-0331). The CS phase is formed by the reaction between TEOS and Ca(OH)2. The XRD patterns indicated that MSi and 2-MGSi posses mixed phases of Fe3O4 and CS.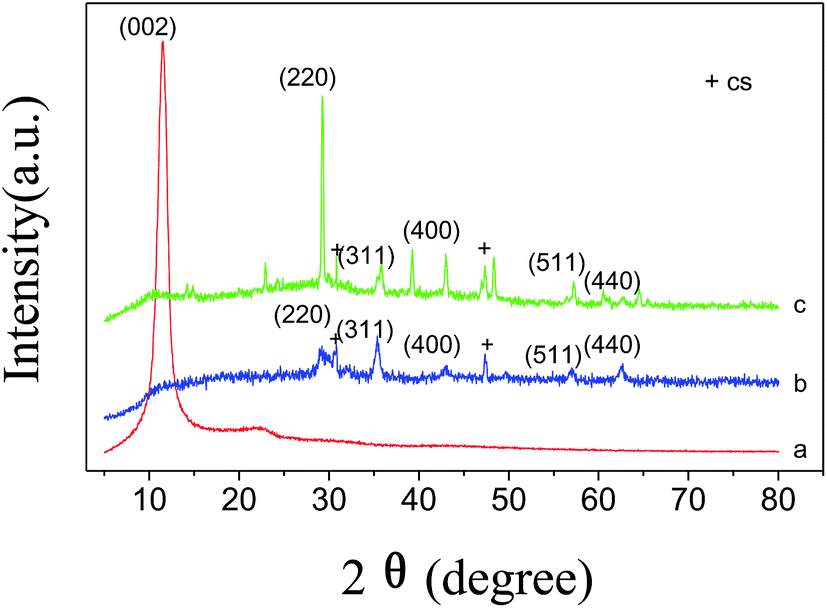 | ||
| Fig. 3 XRD patterns of the as-prepared GO (a), MSi (b) and 2-MGSi (c). | ||
In addition, the nitrogen adsorption–desorption isotherms (Fig. S1a†) and the corresponding pore size distributions (Fig. S1b†) of MSi and 2-MGSi were measured to investigate their surface properties. The BET surface area of 2-MGSi (126.9 m2 g−1) was higher than of MSi (51.2 m2 g−1) due to the existence of GO. The peaks in the pore size distribution curves of MSi and 2-MGSi are shown at 13.53 and 15.15 nm with a very wide pore size distribution, respectively, and the BJH desorption cumulative pore volumes of MSi and 2-MGSi are 0.1823 and 0.9385 cm3 g−1, respectively. These results indicate the presence of mesopores in the as-prepared MSi and 2-MGSi. Thus it shows that the pores are due to CS.
The performance of carbon materials depends greatly on their texture and surface chemistry. Fig. 4 shows the FT-IR spectrum of the as-prepared GO, MSi and 2-MGSi. The FT-IR spectrum of the GO, MSi and 2-MGSi showed the O–H stretching vibration peaks at 3423 cm−1. As shown in Fig. 4a, the peaks at 1083, 1402, 1625 cm−1 correspond to C–O–C stretching vibration, C–OH stretching vibration, C![[double bond, length as m-dash]](https://www.rsc.org/images/entities/char_e001.gif) C stretching vibration of the sp2 carbon skeletal network, respectively, while peaks located at 1730 correspond to CO stretching vibrations of the COOH groups. These peaks evidence the existence of carboxyl, epoxy and alkoxy groups in GO. Fe–O stretching vibration peak at 570 cm−1 was observed in the (b) and (c) curves in Fig. 4, which proved that Fe3O4 NPs was successfully anchored onto the MSi and 2-MGSi.36 Moreover, in b curves in Fig. 4, the peaks at 1109 cm−1 and 873 cm−1 is due to Si–O–Si antisymmetric stretching vibration and Si–O–Si symmetrical stretching vibration, respectively. The peaks at 449 cm−1 and 972 cm−1 are ascribed to bending vibration and stretching vibration of the Si–O. The FT-IR spectrum of the 2-MGSi nanocomposite (Fig. 4c) contains the characteristic peaks of the MSi such as Fe–O stretching vibration peak at 570 cm−1 and the characteristic absorption peaks of Si–O–Si symmetrical stretching vibration at 871 cm−1 and Si–O bending vibration at 490 cm−1. In addition, the characteristic peaks at 1083 cm−1, 1384 cm−1, 1620 cm−1 that correspond to C–O–C stretching vibration, C–OH stretching vibration, CC stretching vibration can be observed in Fig. 4c. The FT-IR results indicate that 2-MGSi was successfully synthesized.
C stretching vibration of the sp2 carbon skeletal network, respectively, while peaks located at 1730 correspond to CO stretching vibrations of the COOH groups. These peaks evidence the existence of carboxyl, epoxy and alkoxy groups in GO. Fe–O stretching vibration peak at 570 cm−1 was observed in the (b) and (c) curves in Fig. 4, which proved that Fe3O4 NPs was successfully anchored onto the MSi and 2-MGSi.36 Moreover, in b curves in Fig. 4, the peaks at 1109 cm−1 and 873 cm−1 is due to Si–O–Si antisymmetric stretching vibration and Si–O–Si symmetrical stretching vibration, respectively. The peaks at 449 cm−1 and 972 cm−1 are ascribed to bending vibration and stretching vibration of the Si–O. The FT-IR spectrum of the 2-MGSi nanocomposite (Fig. 4c) contains the characteristic peaks of the MSi such as Fe–O stretching vibration peak at 570 cm−1 and the characteristic absorption peaks of Si–O–Si symmetrical stretching vibration at 871 cm−1 and Si–O bending vibration at 490 cm−1. In addition, the characteristic peaks at 1083 cm−1, 1384 cm−1, 1620 cm−1 that correspond to C–O–C stretching vibration, C–OH stretching vibration, CC stretching vibration can be observed in Fig. 4c. The FT-IR results indicate that 2-MGSi was successfully synthesized.
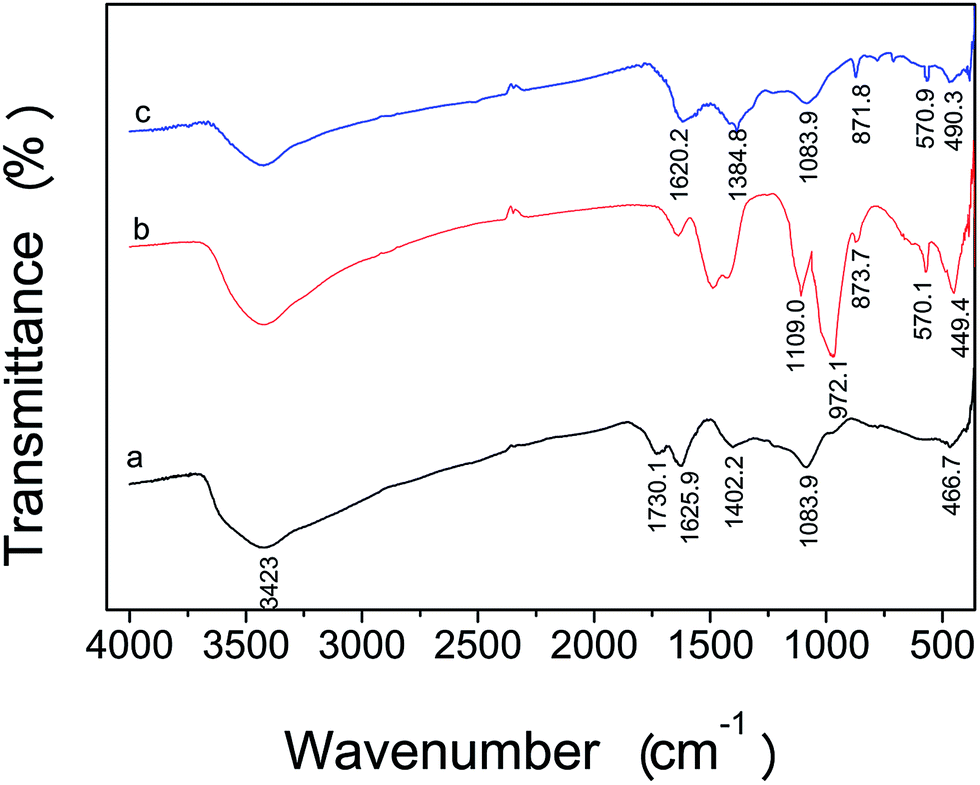 | ||
| Fig. 4 FT-IR spectra of the as-prepared GO (a), MSi (b) and 2-MGSi (c). | ||
3.3 Stability of Fe3O4 nanoparticles on the surface of GO
To study the stability of Fe3O4 nanoparticles combined with GO in MGSi, MG was chosen as the reference material. TEM micrographs of the adsorbent and solution were recorded before and after use. As shown in Fig. 5, the Fe3O4 nanoparticles were uniformly distributed on the MG layer that was synthesized via the coprecipitation method. The Fe3O4 nanoparticles were abundant on the graphene oxide layer prior to use (Fig. 5a), but became sparse after use (Fig. 5b). Therefore, a few Fe3O4 nanoparticles might fall off the graphene oxide layer and enter the solution, and as a result, some of the graphene oxide layers were no longer magnetic and could not be separated using the magnet. Indeed, the graphene oxide layer was found in the solution, and the Fe3O4 particles were not found on the graphene oxide layer after adsorption with MG was conducted (as shown in Fig. 5c and d). This result indicated that the combination of Fe3O4 nanoparticles and GO was not firm, and some Fe3O4 nanoparticles can fall off. In contrast, the Fe3O4 nanoparticles were wrapped by CS in the graphene oxide layer prior to adsorption (Fig. 5e) and after adsorption by 1-MGSi (Fig. 5f), and no graphene oxide was found in the solution after adsorption (Fig. 5g), indicating that the combination of GO and Fe3O4 nanoparticles wrapped by CS was firm and less prone to losing nanoparticles. Moreover, 0.01 g of 1-MGSi and MG were added to two 25 mL portions of a 40 mg L−1 AO solution, respectively. The adsorption capacity (88.5 mg g−1) of 1-MGSi is higher than the adsorption capacity (83.6 mg g−1) of MG at equilibrium.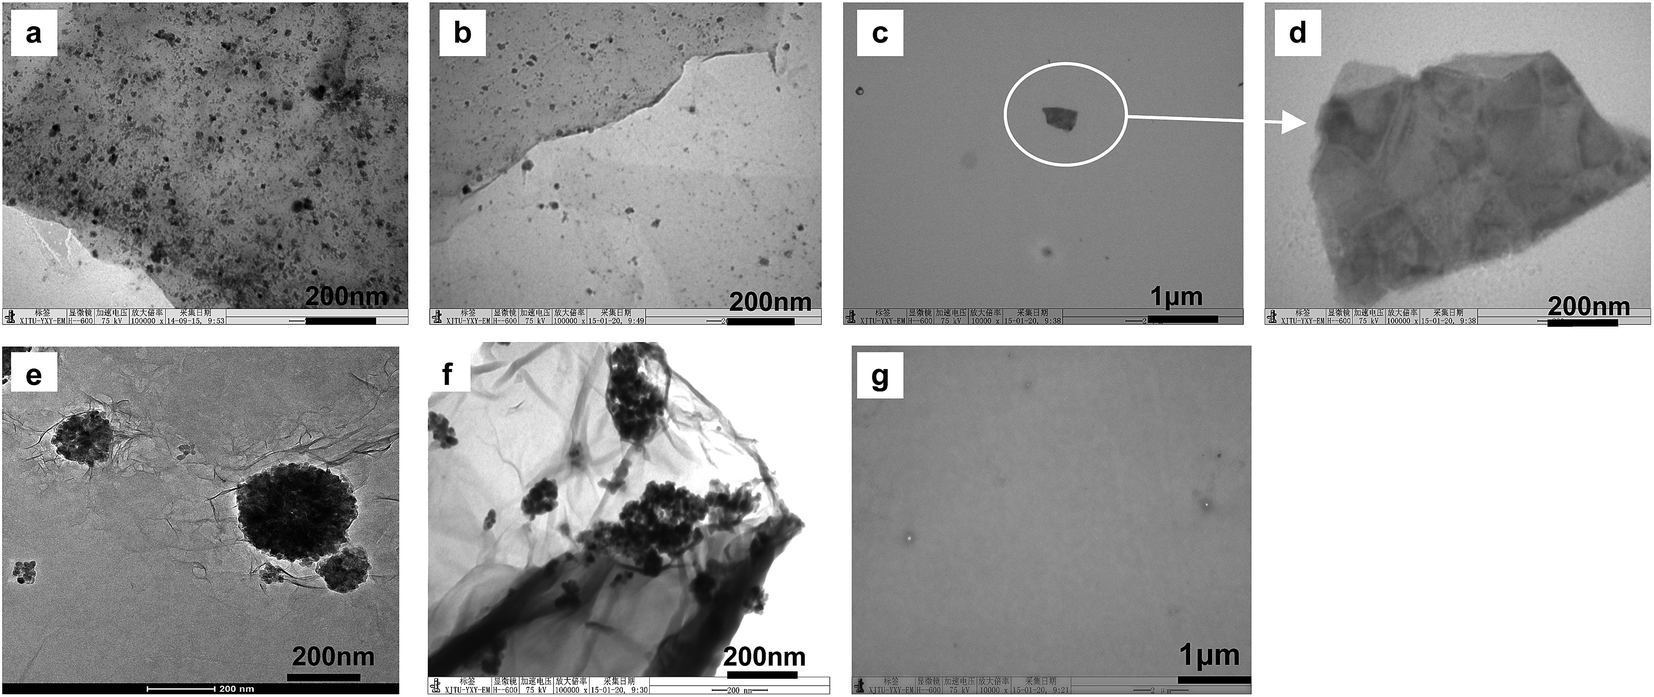 | ||
| Fig. 5 TEM micrographs of the MGSi and MG before and after adsorption. (a) MG before use; (b) MG after use; (c) the solution after treated by MG; (d) graphene oxide in the solution; (e) the 1-MGSi before use; (f) 1-MGSi after use; (g) the solution after adsorbed by 1-MGSi. | ||
3.4 Effect of the amount of GO on the adsorption capacity
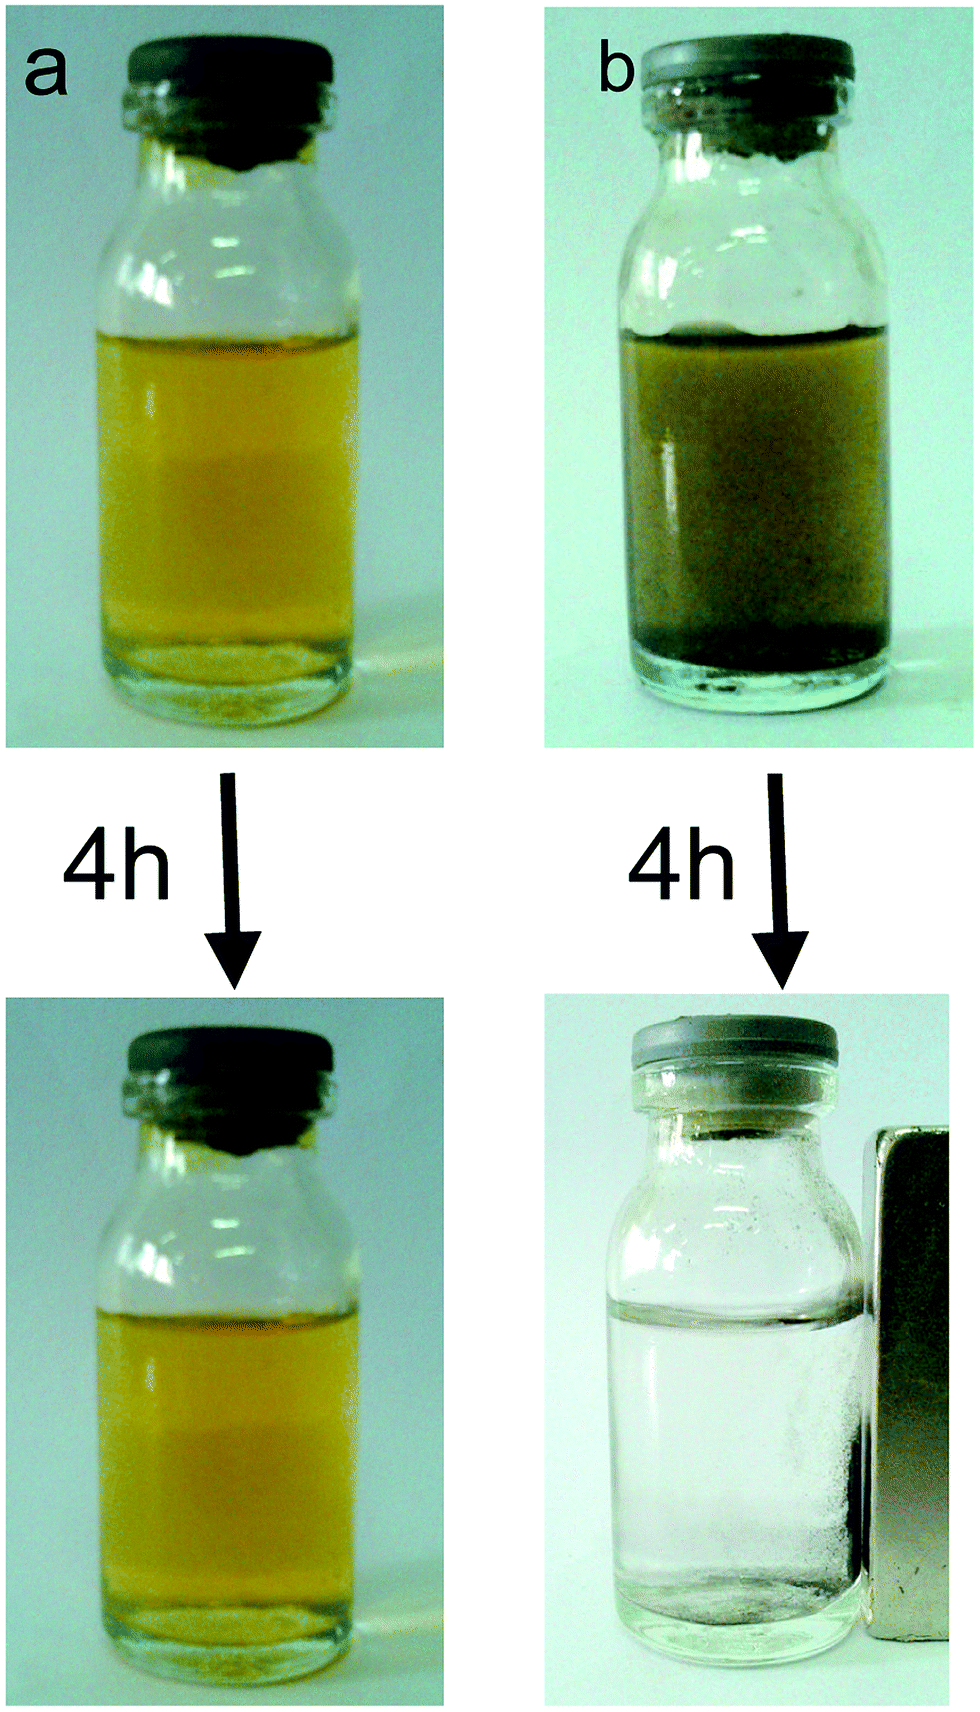
To study the effect of the amount of GO in the composite materials on the adsorption capacity, equal quantities of MSi, 1-MGSi, 2-MGSi, 3-MGSi, 4-MGSi and 5-MGSi were added to six 25 mL portions of 60 mg L−1 AO solution. After the adsorption equilibrium, the adsorption capacity at equilibrium (qe, expressed in mg g−1) was estimated according to eqn (1). Fig. 6 shows the plot of qe as a function of the amount of GO. The adsorption capacity of AO on MGSi increased as the amount of GO increased and reached a maximum at 19% GO. However, the adsorption capacity of AO on MGSi only change a little when the amount of GO is greater than 19%. This reason is that GO will not be dispersed well, it will aggregate when the amount of GO is greater. Therefore, 2-MGSi was chosen for AO adsorption experiment. Fig. 7 shows photos of the adsorption of AO before and after adsorption by 0.01 g of 2-MGSi. As shown in Fig. 7b, the AO solution was orange prior to adsorption, and became colourless after 4 h of adsorption by 2-MGSi. The adsorption of AO on 2-MGSi is magnetic responsiveness by a magnet, thus permitting facile magnetic separation.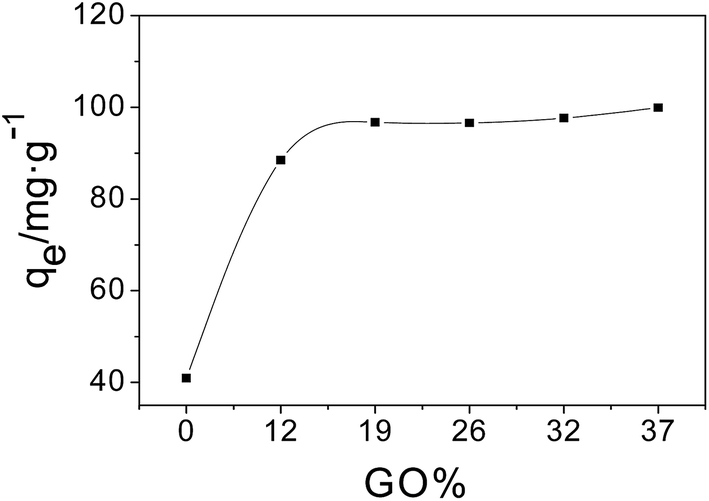 | ||
| Fig. 6 Effect of GO content on the adsorption capacity of composite material. | ||
 | ||
| Fig. 7 Photos of AO on 2-MGSi before and after adsorption. (a) AO (40 mg L−1); (b) (a) + 2-MGSi (0.01 g). | ||
Many adsorbents have been designed for dyes, few of these adsorbents have been designed for the adsorption of acridine orange. Acridine orange and methylene blue are alkaline dyes. Representative adsorbents that can adsorb acridine orange or methylene blue were chosen for comparison with 2-MGSi (Table 1). The selected adsorbents included magnetic nanomaterial, magnetically modified biological waste, iron terephthalate (MOF-235) etc. The maximum adsorption capacity of 2-MGSi for acridine orange was 193.05 mg g−1, which was higher than that of other adsorbents.
| Adsorbents | Adsorption capacities (mg g−1) | Reference | |
|---|---|---|---|
| AO | MB | ||
| Magnetic nanoparticles (γ-Fe2O3) | 59 | — | 37 |
| Pine sawdust auto-hydrolyzed | 18.78 | 88.02 | 38 |
| Fodder yeast cells magnetically modified | 62.2 | — | 39 |
| Magnetic Fe3O4@C nanoparticles | — | 44.38 | 40 |
| Magnetic nanomaterial modified with lysine | — | 141 | 41 |
| Iron terephthalate (MOF-235) | — | 187 | 42 |
| Magnetic graphene–Fe3O4@carbon (GFC) | — | 73.26 | 43 |
| Magnetic porous carbons | — | 193.4 | 44 |
| Graphene oxide–Fe3O4 | — | 167.2 | 45 |
| Magnetic reduced graphene oxide–ferrite hybrids | — | 34.7 | 46 |
| Magnetic silicate calcium graphene | 193.05 | — | This work |
3.5 Selectivity of the adsorption
The adsorbent selectivity is a very important factor for evaluating the performance of an adsorbent. The adsorbent selectivity was studied based on the adsorption capacity of 2-MGSi for four types of alkaline dyes (i.e., acridine orange, methylene blue, crystal violet and fuchsin) and two types of acidic dyes (i.e., methyl orange and orange IV) (Fig. 8). The order of adsorption capacity is as follows: acridine orange > methylene blue > crystal violet > fuchsin > methyl orange > orange IV. In general, 2-MGSi can strongly adsorb alkaline dyes, which is primarily due to the structure of the dyes and adsorbent. Alkaline dyes can dissociate into a cation in aqueous solutions, and GO can dissociate into an anion due to the large number of carboxyl groups on its surface. Therefore, 2-MGSi exhibited higher adsorption efficiency toward alkaline dyes.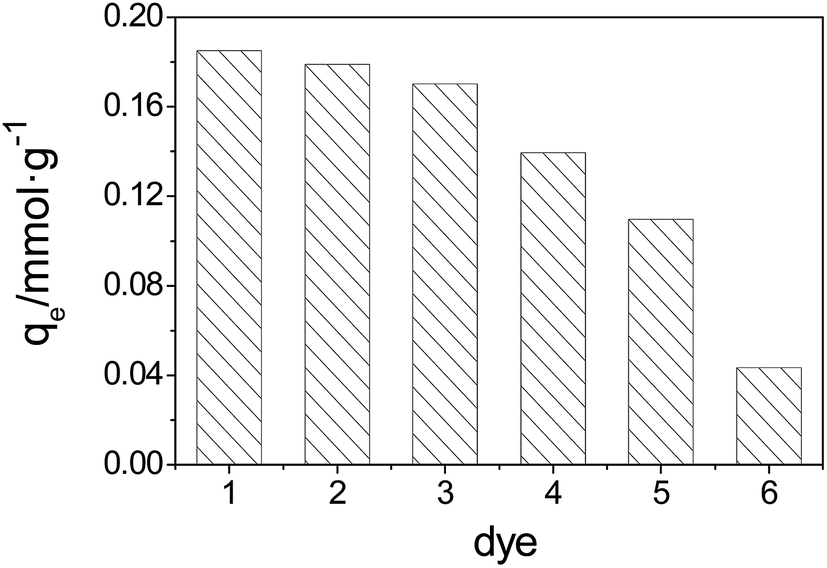 | ||
| Fig. 8 Adsorption capacity of dyes on 2-MGSi (pH = 7.0). (1) Acridine orange, (2) methylene blue, (3) crystal violet, (4) fuchsin, (5) methyl orange, (6) orange IV. | ||
The competitive adsorption between acridine orange, crystal violet and methylene blue was also investigated in binary and ternary systems. As shown in Table 2, the order of the adsorption capacity was as follows: acridine orange > methylene blue > crystal violet in both binary and ternary systems. In addition, the influence of pH on the competitive adsorption between acridine orange, crystal violet and methylene blue in ternary systems are shown in Fig. S2 (ESI†). This result is consistent with the experimental result for the system with pH from 1.98 to 9.91 (i.e., the adsorption order: acridine orange > methylene blue > crystal violet). The result demonstrates that pH has no impact on the competitive adsorption. This adsorption order can be explained by the nature of the surface groups of the adsorbent as well as the structures of the dye. The chemical structure of acridine orange, methylene blue and crystal violet are shown in Fig. S3 (ESI†).
| Dye system | Removal efficiency (%) | ||
|---|---|---|---|
| Acridine orange (AO) | Crystal violet (CV) | Methylene blue (MB) | |
| AO–CV | 81.09% | 63.56% | — |
| CV–MB | — | 51.98% | 57.24% |
| AO–MB | 66.27% | — | 33.40% |
| AO–CV–MB | 60.73% | 31.58% | 32.61% |
As shown in Fig. S3,† three types of dyes are alkaline dyes that can dissociate into cations in solution. Acridine orange is acridine dye, methylene blue is thiazide dye, and crystal violet is triphenylmethane dye. The electropositivity is primarily due to protonation of the nitrogen atom in the chemical structure. All of the substituents of the three dyes are dimethylamino. The nitrogen atom in the acridine ring and nitrogen atom on dimethylamino of acridine orange are on the same side. The nitrogen atom in the thiazide ring and the nitrogen atom on the dimethylamino of methylene blue are on opposite sides. Therefore, the electropositivity of acridine orange is stronger than that of methylene blue after the nitrogen atom combines with the proton. Therefore, acridine orange has a greater likelihood of being adsorbed. The positive charge of crystal violet is more dispersed after the nitrogen atom combines with the proton. Moreover, the crystal violet molecule has greater steric hindrance when combined with MGSi. Therefore, the adsorption capacity of methylene blue and crystal violet on MGSi is smaller than that of acridine orange in the both binary and ternary systems. Based on these results, we chose to study the adsorption property of acridine orange.
3.6 Adsorption kinetics
The adsorption kinetics of acridine orange was investigated to determine the adsorption behavior. Fig. 9 shows the adsorption kinetic curves of acridine orange at the optimal pH. The kinetics exhibited a sharp increase during the initial stage (150 min), and then the curves became gentle and ultimately became a straight line. Overall, the adsorption equilibrium was reached within 200 min.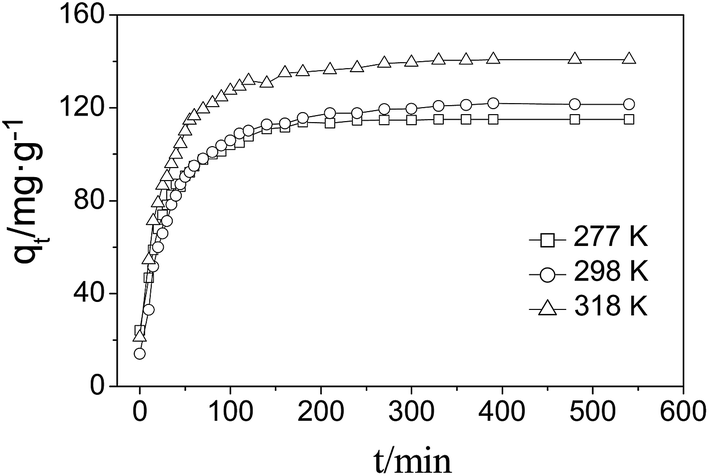 | ||
| Fig. 9 Effect of adsorption time on the adsorption capacity. | ||
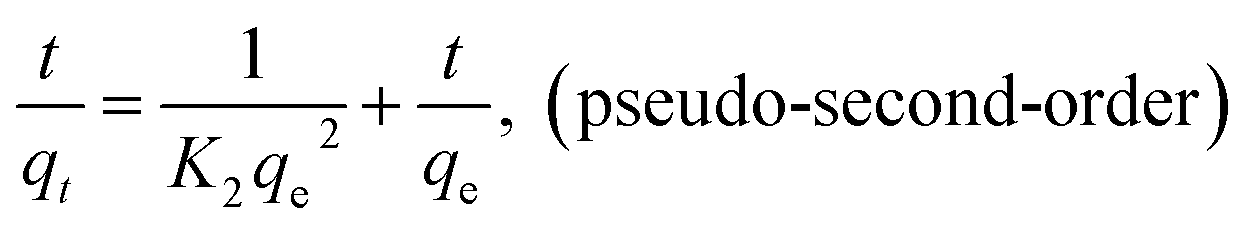
Three kinetic models including pseudo-first-order and pseudo-second-order and intraparticle diffusion kinetics were employed to interpret the experimental data as shown below:

| qt = Kit1/2 + C, (intraparticle diffusion) |
The linear fitness plots of three models are shown in Fig. S4a and b,† and the kinetic parameters of these are listed in Table 3. With respect to the coefficients, the pseudo-second-order model fits the experimental data better than the pseudo-second-order model. The calculated qe values estimated from the pseudo-second-order model exhibit good consistency with the observed values in the experiment. Therefore, the adsorption of AO on MGSi was consistent with the pseudo-second-order model, which indicates that the pseudo-second-order adsorption mechanism is dominant and the overall rate of the AO adsorption process is controlled and limited by chemisorption. In addition, the adsorption of AO on MGSi may experience surface exchange reactions until the surface vacant sites are fully occupied.47 Furthermore, the kinetic data were analysed by the intraparticle diffusion model to investigate the diffusion mechanism.48 As shown in Fig. S4c† and Table 3, the intraparticle diffusion kinetic model exhibited a poor linear relationship with a R of 0.9595, 0.9711, and 0.9750, which are lower than those of the pseudo-second-order kinetic model for the adsorption of AO on MGSi. In addition, the linear fitness plots do not pass through the origin, which indicates that this step is not the only rate-controlling step even though the adsorption involves intraparticle diffusion. Therefore, this result further confirms that the pseudo-second-order kinetics are dominant and the overall rate of adsorption process should be controlled by several mechanisms.49
| T/K | qeqex/mg g−1 | Pseudo-first-order kinetics model | Pseudo-second-order kinetics model | Intra-particle diffusion model | |||||
|---|---|---|---|---|---|---|---|---|---|
| K1 (×10 min−1) | qe/mg g−1 | R | K2 (×102 g mg−1 min−1) | qe/mg g−1 | R | Ki (g mg−1 min−1/2) | R | ||
| 277 | 115 | 0.2045 | 78.47 | 0.9872 | 0.06616 | 121.06 | 0.9979 | 9.6583 | 0.9595 |
| 298 | 121.58 | 0.1580 | 83.81 | 0.9649 | 0.04799 | 128.53 | 0.9962 | 8.3798 | 0.9711 |
| 318 | 140.5 | 0.1589 | 76.56 | 0.9780 | 0.00045 | 146.20 | 0.9979 | 10.204 | 0.9750 |
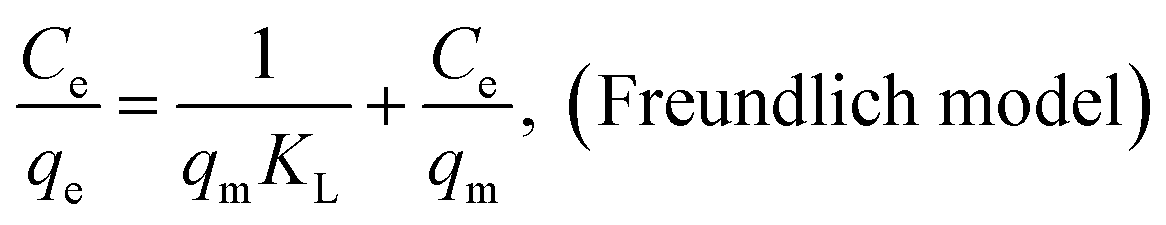
3.7 Adsorption isotherms
The adsorption isotherms of AO on MGSi at 277 K, 298 K, and 318 K are shown in Fig. 10, and were investigated using three classical theoretical isotherm models (i.e., the Langmuir, Freundlich and Temkin models):
qe = KT![[thin space (1/6-em)]](https://www.rsc.org/images/entities/char_2009.gif) lnCe + KTlnf, (Temkin model) lnCe + KTlnf, (Temkin model) |
 | ||
| Fig. 10 Adsorption isotherms at 277 K, 298 K and 318 K. | ||
Fig. S5a–c† shows the linear fitting results for the three models, and the fitted parameters are summarized in Table 4. As shown in Table 4, the Freundlich isotherm model is more appropriate than the Langmuir isotherm model for describing the adsorption behavior of AO on MGSi based on a comparison of the correlation coefficients (R) of the Freundlich and Langmuir models (correlation coefficient (R) of the Freundlich model was greater than that of the Langmuir model). The Freundlich model assumes that the surface energy of the adsorbent is heterogeneous due to the diversity of adsorption sites on the surface of the adsorbent or diverse interactions of the dye molecules with the adsorbent.50,55 Therefore, this result suggested that the adsorption of AO onto MGSi occurred on heterogeneous adsorption sites and diverse interactions existed in the adsorption process. The Freundlich constant (KF) increased as the temperature increased. The increase in temperature is beneficial for adsorption, and the n constant in the model is greater than 1. Therefore, adsorption is initiated.
| T/K | Langmuir equation | Freundlich equation | Temkin equation | ||||||
|---|---|---|---|---|---|---|---|---|---|
| qm/mg g−1 | KL/mg g−1 | R | KF/mg g−1 | n | R | KT | f | R | |
| 277 | 179.21 | 0.1596 | 0.99525 | 46.40 | 2.7799 | 0.99632 | 46.8035 | 0.001115 | 0.9740 |
| 298 | 193.05 | 0.2075 | 0.99017 | 55.07 | 2.9298 | 0.9951 | 51.0614 | 0.01102 | 0.9942 |
| 318 | 307.69 | 0.3244 | 0.99106 | 117.92 | 4.0196 | 0.99362 | 52.4861 | 0.03456 | 0.9805 |
However, the Temkin model is a suitable model for the chemical adsorption based on strong electrostatic interactions between the positive and negative charges.51 To confirm the existence of electrostatic interactions, the Temkin model was used to analyse the adsorption isotherms. The Temkin model (i.e., R were 0.9740, 0.9942 and 0.9805.) also provided a suitable fit. Therefore, these results indicate that electrostatic interactions exist in the adsorption process.
3.8 Adsorption mechanism
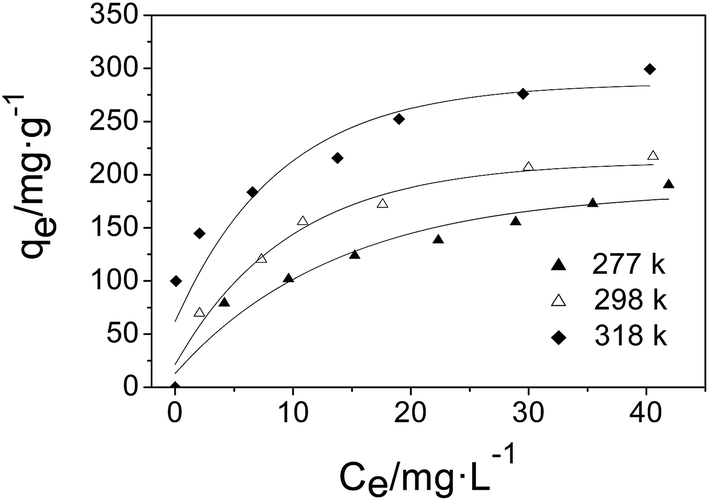
The pH is an important factor that affects the interaction between adsorbents and dyes. Fig. 11a shows the effect of the pH on the adsorption capacity of AO on MGSi with an initial concentration of 40 mg L−1 at 298 K with a pH ranging from 1.98 to 9.91.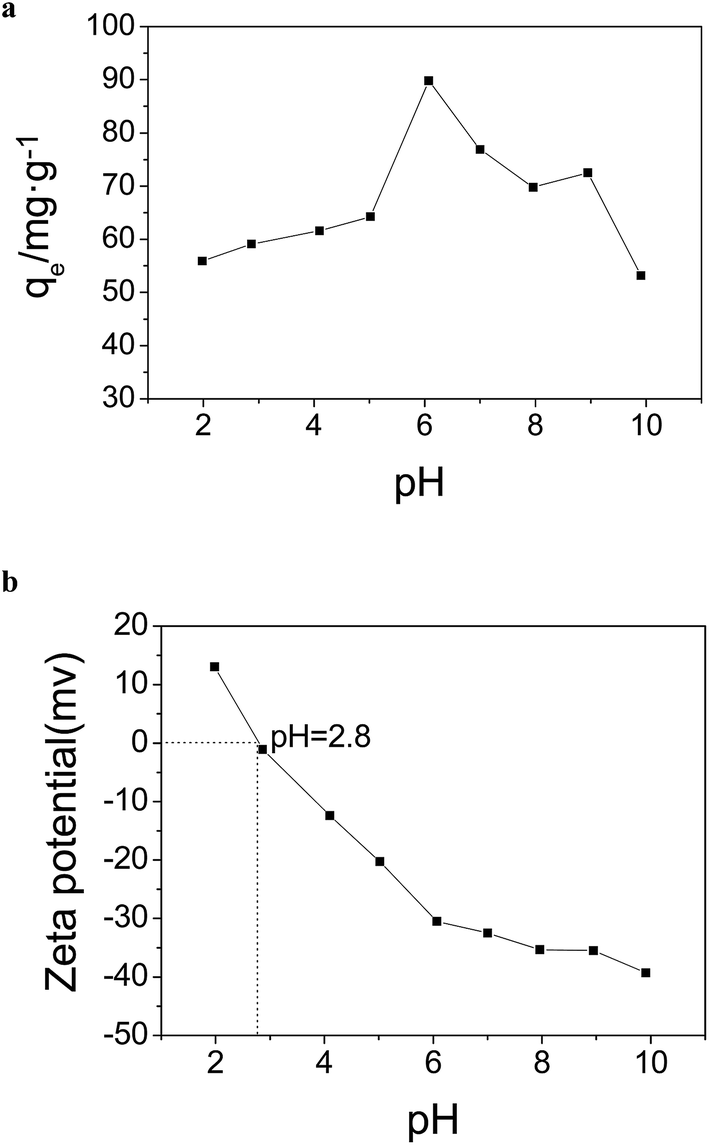 | ||
| Fig. 11 (a) Effect of pH on adsorption capacity. (b) Zeta potential of the MGSi as a function of pH. | ||
As shown in Fig. 11a, the adsorption capacity increased as the pH increased and reached a maximum at a pH of 6.00 followed by a decrease with a further increase in pH. To achieve a better understanding of the effect of pH on the adsorption capacity of AO on MGSi, the zeta potential of MGSi at varied pH was measured. It was observed that the pHPZC value of MGSi was approximately 2.8. The surface charge was positive at pH < 2.8, but was negative at pH > 2.8. Furthermore, the zeta potential of MGSi decreased with increasing pH value from 1.98 to 9.91 (shown in Fig. 11b). Therefore, the effect of pH on the adsorption capacity of AO on MGSi can be explained by the change in the surface charge of the adsorbents and ionization behavior of the dye at different pH values. In an acidic medium (pH < pKa), the nitrogen of AO contains a lone pair of electrons, and AO more easily becomes a positively charged molecule.52 However, the adsorbent surface is positive charged at pH < 2.8, so the adsorption capacity of AO on MGSi is lower. The MGSi surface is negatively charged due to the presence of carboxylic (ACOOH) groups at pH > 2.8.53 The negatively charged carboxylic groups generate an electrostatic attraction force with the positively charged acridine orange. The binding force is the strongest at a pH of 6.00. Therefore, the adsorption capacity is the greatest. In basic medium (pH > pKa), acridine orange is neutral,52 moreover, zeta potential of MGSi was negative and decreased with increasing pH value. So the AO and MGSi composites are more weakly bound. The adsorption capacity decreased as the pH increased.
To study the interaction force of AO and the MGSi composite material, the effect of the NaCl and isopropyl alcohol concentrations on the adsorption capacity of AO on MGSi were studied using an initial concentration of 60 mg L−1 at 298 K.
As shown in Fig. 12a, the adsorption capacities gradually decrease with the concentration of NaCl, which varies from 0 to 40 mM, due to a charge shielding effect.54 The shielding effect due to the increased concentration of ionic charge will weaken the electrostatic interaction between AO and the deprotonated carboxyl group on the GO surface. When the concentration of NaCl was greater than 40 mM, the adsorption capacity was maintained near 95.03 mg L−1. In addition to electrostatic interactions, these results indicated that hydrophobic forces may dominate the adsorption of AO. To detect the presence of hydrophobic forces, the effect of isopropyl alcohol on the adsorption of AO was investigated (Fig. 12b). The adsorption capacity gradually decreased as the concentration of isopropyl alcohol increased, which indicated that hydrophobic interactions also participated in the adsorption of AO on MGSi. The presence of electrostatic and hydrophobic interactions is consistent with the thermodynamics results stated above. In addition, if the chemical structure of AO is considered (see Fig. S3†), π–π interactions between the localized π electrons in the conjugated aromatic rings of MGSi and the AO molecules are also expected to exist during the adsorption of AO.55 In conclusion, the adsorption of AO on MGSi is the result of three interaction forces.
 | ||
| Fig. 12 (a) Effect of NaCl on the adsorption capacity. (b) Effect of isopropyl alcohol on adsorption capacity. | ||
3.9 Stability experiment and reusability
The adsorbent regeneration ability is vital for practical applications, and will reduce the overall cost for the adsorbent. In these experiments, ethanol (50%) was used to desorb AO from the adsorbents. To demonstrate the reusability of the adsorbent, the adsorption–desorption cycle was repeated six times using the preparation method. The results are shown in Fig. 13.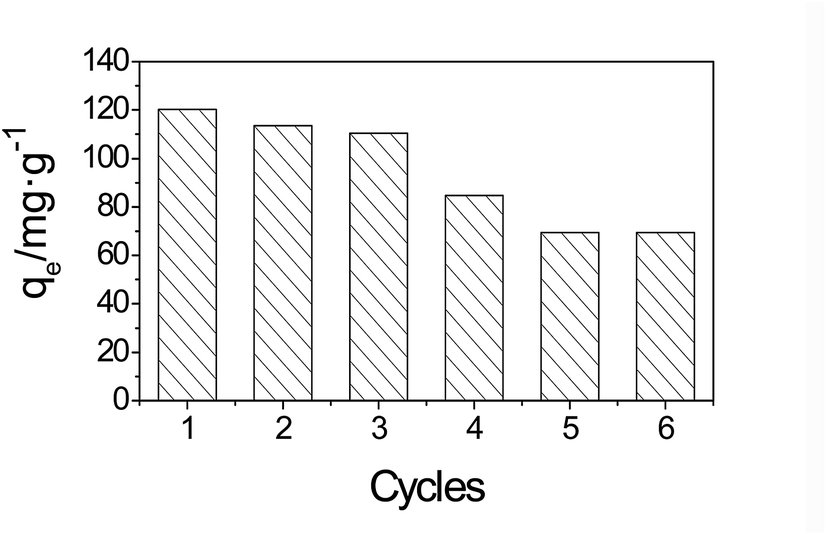 | ||
| Fig. 13 Reusability of the MGSi. | ||
As shown in Fig. 13, after three adsorption–desorption cycles, the adsorption capacities of the adsorbents did not significantly change during the repeated adsorption–desorption processes. Nevertheless, more than 70% of the AO adsorption capacity was achieved in the fourth cycle. After the fourth cycle, the adsorption capacity decreased noticeably, this can be ascribed to the loss of MGSi in the circulation process. Due to the superior adsorption capacity along with its good regeneration ability, the MGSi composite is expected to be useful for the efficient removal of AO from aqueous solutions in practical applications.
4 Conclusions
For the first time, a facile two-phase coprecipitation method was developed for the synthesis of MGSi composites. The advantage of MGSi composites is that the Fe3O4 nanoparticles in MGSi do not easy fall off during the adsorption process. In addition, MGSi exhibited a greater adsorption capacity for alkaline dyes, due to the presence of a large number of carboxyl groups on the surface of graphene oxide. Because of electrostatic, hydrophobic and π–π interactions, MGSi exhibited excellent selectivity for AO. When the percentage of GO in MGSi was 19%, the adsorption capacity of AO on MGSi reached a maximum (193.05 mg g−1). The adsorption of AO on MGSi was consistent with the pseudo-second-order and Freundlich isotherm models. Repeated testing indicated that MGSi was reusable for the adsorption of AO. Overall, MGSi appears to be a promising adsorbent for the removal of AO from wastewater.Conflict of interest
The authors declare there is no conflict of interest.Acknowledgements
This work was supported by the Nation Natural Science Foundation of China (No. 21475104).References
- S. Sirianuntapiboon and P. Srisornak, Bioresour. Technol., 2007, 98, 1057–1066 CrossRef CAS PubMed.
- I. M. Banat, P. Nigam, D. Singh and R. Marchant, Bioresour. Technol., 1996, 58, 217–227 CrossRef CAS.
- M. M. Khin, A. S. Nair, V. J. Babu, R. Murugan and S. Ramakrishna, Energy Environ. Sci., 2012, 5, 8075–8109 CAS.
- I. Ali and V. K. Gupta, Nat. Protoc., 2006, 1, 2661–2667 CrossRef CAS PubMed.
- S. W. Nam, D. J. Choi, S. K. Kim, N. Her and K. D. Zoh, J. Hazard. Mater., 2014, 270, 144–152 CrossRef CAS PubMed.
- V. Ranjithkumar, S. Sangeetha and S. Vairam, J. Hazard. Mater., 2014, 273, 127–135 CrossRef CAS PubMed.
- E. Repo, J. K. Warchol, A. Bhatnagar and M. J. Sillanpaa, J. Colloid Interface Sci., 2011, 358, 261–267 CrossRef CAS PubMed.
- C. Y. Cao, J. Qu, F. Wei, H. Liu and W. G. Song, ACS Appl. Mater. Interfaces, 2012, 4, 4283–4287 CAS.
- T. Zhai, S. L. Xie, X. H. Lu, L. Xiang, M. H. Yu, W. Li, C. L. Liang, C. H. Mo, F. Zeng, T. G. Luan and Y. X. Tong, Langmuir, 2012, 28, 11078–11085 CrossRef CAS PubMed.
- Y. Zhang, Y. F. Li, L. Q. Yang, X. J. Ma, L. Y. Wang and Z. F. Ye, J. Hazard. Mater., 2010, 178, 1046–1054 CrossRef CAS PubMed.
- H. Y. Yang, Z. J. Han, S. F. Yu, K. L. Pey, K. Ostrikov and R. Karnik, Nat. Commun., 2013, 4, 2220 Search PubMed.
- S. L. Luo, X. L. Xu, G. Y. Zhou, C. B. Liu, Y. H. Tang and Y. T. Liu, J. Hazard. Mater., 2014, 274, 145–155 CrossRef CAS PubMed.
- C. B. Wang, J. W. Zhou, J. Ni, Y. L. Cheng and H. Li, Chem. Eng. J., 2014, 253, 130–137 CrossRef CAS.
- L. Q. Zhao, B. W. Yu, F. M. Xue, J. R. Xie, X. L. Zhang, R. H. Wu, R. J. Wang, Z. Y. Hu, S. T. Yang and J. b. Luo, J. Hazard. Mater., 2015, 286, 449–456 CrossRef CAS PubMed.
- Z. J. Li, L. Wang, L. Y. Yuan, C. L. Xiao, L. Mei, L. R. Zheng, J. Zhang, J. H. Yang, Y. L. Zhao, Z. T. Zhu, Z. F. Chai and W. Q. Shi, J. Hazard. Mater., 2015, 290, 26–33 CrossRef CAS PubMed.
- L. Q. Guo, P. R. Ye, J. Wang, F. F. Fu and Z. J. Wu, J. Hazard. Mater., 2015, 298, 28–35 CrossRef CAS PubMed.
- S. Stankovich, D. A. Dikin, G. H. B. Dommett, K. M. Kohlhaas, E. J. Zimney, E. A. Stach, R. D. Piner, S. T. Nguyen and R. S. Ruoff, Nature, 2006, 442, 282–286 CrossRef CAS PubMed.
- M. D. Stoller, S. J. Park, Y. W. Zhu, J. H. An and R. S. Ruoff, Nano Lett., 2008, 8, 3498–3502 CrossRef CAS PubMed.
- C. D. Zangmeister, Chem. Mater., 2010, 22, 5625–5629 CrossRef CAS.
- S. Dubin, S. Gilje, K. Wang, V. C. Tung, K. Cha, A. S. Hall, J. Farrar, R. Varshneya, Y. Yang and R. B. Kaner, ACS Nano, 2010, 4, 3845–3852 CrossRef CAS PubMed.
- J. Gao, F. Liu, Y. L. Liu, N. Ma, Z. Q. Wang and X. Zhang, Chem. Mater., 2010, 22, 2213–2218 CrossRef CAS.
- L. Xiao, Y. L. Wang, S. L. Yu and Y. L. Tang, Prog. Chem., 2013, 25, 419–430 CAS.
- L. L. Fan, C. N. Luo, X. J. Li, F. G. Lu, H. M. Qiu and M. Sun, J. Hazard. Mater., 2012, 215–216, 272–279 CrossRef CAS PubMed.
- Y. J. Yao, Y. M. Cai, F. Lu, F. Y. Wei, X. Y. Wang and S. B. Wang, J. Hazard. Mater., 2014, 270, 61–70 CrossRef CAS PubMed.
- A. Meidanchi and O. Akhavan, Carbon, 2014, 69, 230–238 CrossRef CAS.
- L. Zhou, H. P. Deng, J. L. Wan and R. J. Zhang, Prog. Chem., 2013, 25, 145–155 CAS.
- X. Yang, J. X. Li, T. Wen, X. M. Ren, Y. S. Huang and X. K. Wang, Colloids Surf., A, 2013, 422, 118–125 CrossRef CAS.
- Q. Wu, G. Zhao, C. Feng, C. Wang and Z. Wang, J. Chromatogr. A, 2011, 1218, 7936–7942 CrossRef CAS PubMed.
- J. H. Deng, X. R. Zhang, G. M. Zeng, J. L. Gong, Q. Y. Niu and J. Liang, Chem. Eng. J., 2013, 226, 189–200 CrossRef CAS.
- H.-F. Yu, J. Magn. Magn. Mater., 2013, 341, 79–85 CrossRef CAS.
- B. Q. Lu, Y. J. Zhu, H. Y. Ao, C. Qi and F. Chen, ACS Appl. Mater. Interfaces, 2012, 4, 6969–6974 CAS.
- L. Sun, H. W. Yu and B. Fugetsu, J. Hazard. Mater., 2012, 203–204, 101–110 CrossRef CAS PubMed.
- G. Y. Zhao, S. J. Song, C. Wang, Q. H. Wu and Z. Wang, Anal. Chim. Acta, 2011, 708, 155–159 CrossRef CAS PubMed.
- T. Fan, D. Pan and H. Zhang, Ind. Eng. Chem. Res., 2011, 50, 9009–9018 CrossRef CAS.
- C. Nethravathi and M. Rajamathi, Carbon, 2008, 46, 1994–1998 CrossRef CAS.
- A. Mehdinia, N. Khodaee and A. Jabbari, Anal. Chim. Acta, 2015, 868, 1–9 CrossRef CAS PubMed.
- S. Qadri, A. Ganoe and Y. Haik, J. Hazard. Mater., 2009, 169, 318–323 CrossRef CAS PubMed.
- D. Sidiras, F. Batzias, E. Schroeder, R. Ranjan and M. Tsapatsis, Chem. Eng. J., 2011, 171, 883–896 CrossRef CAS.
- I. Safarik, L. F. T. Rego, M. Borovska, E. Mosiniewicz-Szablewska, F. Weyda and M. Safarikova, Enzyme Microb. Technol., 2007, 40, 1551–1556 CrossRef CAS.
- Z. Y. Zhang and J. L. Kong, J. Hazard. Mater., 2011, 193, 325–329 CrossRef CAS PubMed.
- Y. R. Zhang, S. L. Shen, S. Q. Wang, J. Huang, P. Su, Q. R. Wang and B. X. Zhao, Chem. Eng. J., 2014, 239, 250–256 CrossRef CAS.
- E. Haque, J. W. Jun and S. H. Jhung, J. Hazard. Mater., 2011, 185, 507–511 CrossRef CAS PubMed.
- W. Fan, W. Gao, C. Zhang, W. W. Tjiu, J. H. Pan and T. X. Liu, J. Mater. Chem., 2012, 22, 25108–25115 RSC.
- J. D. Xiao, L. G. Qiu, X. Jiang, Y. J. Zhu, S. Ye and X. Jiang, Carbon, 2013, 59, 372–382 CrossRef CAS.
- G. Xie, P. Xi, H. Liu, F. Chen, L. Huang, Y. Shi, F. Hou, Z. Zeng, C. Shao and J. Wang, J. Mater. Chem., 2012, 22, 1033–1039 RSC.
- S. Bai, X. Shen, X. Zhong, Y. Liu, G. Zhu, X. Xu and K. Chen, Carbon, 2012, 50, 2337–2346 CrossRef CAS.
- X. B. Wu, K. N. Hui, K. S. Hui and S. K. Lee, Chem. Eng. J., 2012, 180, 91–98 CrossRef CAS.
- K. P. Liu, H. M. Li, Y. M. Wang, X. J. Gou and Y. X. Duan, Colloids Surf., A, 2015, 477, 35–41 CrossRef CAS.
- G. K. Ramesha, A. Vijaya Kumara, H. B. Muralidhara and S. Sampath, J. Colloid Interface Sci., 2011, 361, 270–277 CrossRef CAS PubMed.
- K. Y. Shin, J. Y. Hong and J. Jang, J. Hazard. Mater., 2011, 190, 36–44 CrossRef CAS PubMed.
- L. Wang, J. Zhang, R. Zhao, Y. Li, C. Li and C. Zhang, Bioresour. Technol., 2010, 101, 5808–5814 CrossRef CAS PubMed.
- H. P. Gong, S. P. Liu, P. F. Yin, S. G. Yan, X. Q. Fan and Y. Q. He, Acta Chim. Sin., 2011, 69, 2843–2850 CAS.
- Y. S. Al-Degs, M. I. El-Barghouthi, A. H. El-Sheikh and G. M. Walker, Dyes Pigm., 2008, 77, 16–23 CrossRef CAS.
- P. Tan, J. Sun, Y. Y. Hu, Z. Fang, Q. Bi, Y. C. Chen and J. H. Cheng, J. Hazard. Mater., 2015, 297, 251–260 CrossRef CAS PubMed.
- H. Kim, S. O. Kang, S. Park and H. S. Park, J. Ind. Eng. Chem., 2015, 21, 1191–1196 CrossRef CAS.
Footnote |
| † Electronic supplementary information (ESI) available. See DOI: 10.1039/c6ra07625d |
| This journal is © The Royal Society of Chemistry 2016 |