Activation of peroxymonosulfate by iron-based catalysts for orange G degradation: role of hydroxylamine

Jing Zhang*, Mengyan Chen and Liang Zhu
Key Laboratory of Integrated Regulation and Resource Development on Shallow Lakes of Ministry of Education, College of Environment, Hohai University, Nanjing 210098, China. E-mail: zhang_jing@hhu.edu.cn; Tel: +86-15050556980

Received 19th March 2016 , Accepted 2nd May 2016

First published on 4th May 2016


Abstract

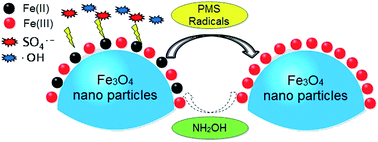
Magnetite nanoparticles (Fe3O4) have received considerable and increasing attention and been applied as activators for peroxymonosulfate (PMS) to generate reactive radicals for degrading organic contaminants. However, the slow transformation of Fe(III)/Fe(II) limits its repetitive and widespread application. Hence, hydroxylamine (NH2OH), a common reducing agent, was introduced to a Fe3O4/PMS system to accelerate the conversion of Fe(III)/Fe(II). With the addition of NH2OH, orange G (OG) degradation was largely increased at pH 2.0–7.0, and the generation of reactive radicals (sulfate- and hydroxyl-radicals) was significantly promoted. NH2OH was gradually degraded to N2, N2O, NO2, and NO3, while the eco-friendly gas, N2, was considered as its major end product. It was surprising to find that the catalytic ability of Fe3O4 soared gradually in the ten consecutive runs. The effectiveness of NH2OH for Fe3O4, Fe2O3 and iron sludge on activating PMS indicated its wide suitability for all the iron-based oxides/hydroxides. Continuous treatment of OG using 1.5 wt% Fe/Al2O3 catalyst (iron sludge immobilized on Al2O3) packed into a flow column reactor was performed, and no loss in activity over 30 d of operation was observed. Thus the present study provides a promising way to activate PMS for the rapid degradation of refractory organics and dispose the solid iron-based wastes.

1. Introduction

In recent years, sulfate radicals (SO4˙) based advanced oxidation processes (AOPs) have drawn considerable attention for degrading or mineralizing refractory organic contaminants in water and wastewater treatment.1–3 SO4˙ has been known as a strong oxidant for its high standard redox potential (2.5–3.1 V),4 which is comparable to that of hydroxyl radicals (˙OH, 1.9–2.7 V).5 Moreover, SO4˙ is more efficient than ˙OH to degrade some refractory organic contaminants thanks to its higher selectivity.4 As one of the most important way to generate SO4˙, activating peroxymonosulfate (PMS) by various catalysts, i.e. UV,3,6,7 heat,8 transition metals,1,9,10 and heterogeneous catalysts,11,12 has been widely studied.3,9,13,14 Although UV and heat are efficient ways to activate PMS,3 the intrinsic drawback of high energy input limits their widespread application. Among the common transition metal ions, Co(II) has been reported as the best activator for PMS to generate SO4˙.1 Although heterogeneous cobalt catalysts have been used to reduce the dissolved cobalt ions, the adverse effects of leached cobalt should be considered prior to practical application.15,16 Owing to the environmentally friendly nature, and the advantages of cost effectiveness and easy desegregation, iron-based catalysts have been chosen as activators for PMS to generate SO4˙.12,17,18

Several researchers have applied homogeneous Fe2+ ions to activate PMS.19,20 However, Fe2+/PMS system has to be operated within an acidic pH range due to the hydrolysis and precipitation of iron ions, and the removal of the iron ions from the solution after the reaction incurs additional operational costs.21,22 Heterogeneous catalysts, especially solid oxide-based ones, can overcome those disadvantages. It is well known that Fe(II) instead of Fe(III) is the major activator for PMS.10 Thus, among the various iron oxides/hydroxides, magnetite nanoparticles (Fe3O4) has received considerable and increasing attention due to the presence of Fe(II). However, Fe3O4/PMS process has some intrinsic drawbacks, including the low degradation efficiency for refractory organic contaminants, and the slow transformation of Fe(III) to Fe(II) on the surface of Fe3O4.12 Liu et al.23 synthesized Fe3O4–MnO2 bimetallic nanocomposites to increase the catalytic activity. Yang et al.24 loaded Fe3O4/Mn3O4 onto the reduced graphene oxide to trigger their synergistic effects. The slow cycling of Fe(III)/Fe(II) also led to the inferior performances of other ferric oxides/hydroxides in activating PMS. However, few efforts have been made to accelerate the cycle of Fe(III)/Fe(II). Zou et al. and Chen et al. reported that the introduction of NH2OH into Fe2+/PMS and Fe2+/H2O2 processes accelerated Fe(III)/Fe(II) cycling and enhanced generation of relative radicals and degradation of organic contaminants.10,25 To the best of our knowledge, the effect of NH2OH on iron-based solid catalyst/PMS system was still uncovered.

Synthetic dyes are extensively used for coloring textiles, leather, paper, food, drinks, pharmaceuticals, cosmetics and inks.26 Azo dyes account for over 70% of commercial dyestuff, thereby being the most important class of synthetic dyes. In particular, textile industries release large volumes of wastewaters into lakes and rivers. These pollutants cause not only aesthetic water color problems, but also environmental damages by impeding the light penetration and health risks on living beings owing to the toxicity, carcinogenicity, potential mutagenicity and resistance to biodegradation of them and their by-products.27,28 Powerful oxidation processes are then needed for the removal of azo dyes and their by-products from wastewaters in order to avoid the adverse impacts. Therefore, orange G (OG), one typical azo dye, was selected as the target compound.

In this paper, NH2OH was introduced into iron-based solid catalyst/PMS process to increase the degradation of OG by accelerating the redox cycle of Fe(III)/Fe(II). Firstly, this study focuses on (i) exploring the role of NH2OH, (ii) evaluating the effects of NH2OH and PMS concentration, initial pH and temperature on the performance of NH2OH/Fe3O4/PMS process, (iii) identification of the primary reactive oxygen species (ROS) and (iv) determining the end degradation products of NH2OH. Secondly, in order to provide a guidance for the pilot application of this process, a continuous column reactor packed with iron sludge loaded on activated alumina particles was set up, and its performance in the presence of NH2OH was examined over 30 d of continuous operation.

2. Experimental

2.1 Materials

Details for materials were shown in Text S1.

2.2 Characterization of Fe3O4

The XRD studies were carried out using Bruker D8 Advance diffractometer with monochromatized Cu Kα irradiation. The morphology of Fe3O4 nanoparticles was determined with transmission electron microscopy (TEM) using JEM-2011 microscope. X-ray photoelectron spectroscopy (XPS) and BET surface areas measurements were performed on a PHI 5000C ESCA System with Al Kα source and on an ASAP analyzer (Micromeritics, USA) with N2 gas adsorption method, respectively.

2.3 Batch experiment

All experiments were performed in 500 mL borosilicate glass jars with a constant stirring rate at 25 ± 0.5 °C. Each 500 mL reaction solution with desired concentrations of OG, catalyst, and NH2OH was prepared with ultrapure water and adjusted to the desired initial pH with perchloric acid and sodium hydroxide. The desired PMS dosage was then added to start the reaction. Samples were withdrawn at predetermined time intervals and quenched with excess pure methanol before analysis. Alcohols quenching experiments with tert-butyl alcohol (TBA) and methanol were performed by adding desired alcohols into the reaction solution before the addition of PMS. All experiments were repeated at least two times, and the average values along with one standard deviation were provided in figures. Electron paramagnetic resonance (EPR) experiments were performed with DMPO as a spin-trapping agent, whose detailed parameters and procedures are shown in Text S2. The experiments about the stability of Fe3O4 were presented in Text S3.

2.4 Continuous flow column system

A continuous-flow packed-bed column reactor experiment was conducted for >30 days using the setup shown in Fig. S1. The reactor was a 2.0 cm ID × 85 cm long glass column packed with 271 g of 1.5 wt% Fe/Al2O3 catalyst (details for the synthetic method of catalyst was shown in Text S4). The internal column volume was 267 mL, and 107 mL of this was interstitial pore space. Influent was passed through the column using a peristaltic pump (retention time of ca. 60 min), and the solution temperature was maintained at 25.0 ± 1.0 °C. The pH of OG influent was controlled at 3.0 with perchloric acid, while the pH of PMS and NH2OH was not controlled. Influent and effluent samples were collected to monitor the extent of OG oxidation and the products of NH2OH.

2.5 Analytical methods

The OG was quantified with an UV-vis spectrometer at 478 nm (Jingke, UV760CRT). The concentration of PMS was determination based on the modification of iodometric titration method at 350 nm.29 NH2OH and its degradation products, i.e. N2, N2O, NO2 and NO3 were quantified by gas- or ion-chromatography respectively, as shown in Text S5. OG mineralization (TOC removal) was examined with a TOC II analyzer (Elementar).

3. Results and discussion

3.1 Characterization of Fe3O4

TEM images of virgin Fe3O4, spent Fe3O4 after Fe3O4/PMS process and regenerated Fe3O4, which was used in Fe3O4/PMS process, by NH2OH are shown in Fig. 1. As seen, the Fe3O4 catalysts were mostly quasi-spherical and with an average diameter of 15 nm. XRD patterns of virgin Fe3O4 and its spent and regenerated counterparts are shown in Fig. S2. The diffraction patterns before and after use matched well with the standard XRD pattern of magnetite (JCPDS no. 19-0629) with the characteristic peaks at 2θ = 30.2°, 35.5°, 43.2°, 53.7°, 57.2° and 62.8°.12 The broad XRD peaks indicated the small crystallite dimension of Fe3O4. The average particle size of samples was calculated as 12.5 nm from the most intense peak at 35.5° according to the Scherrer's equation, which was very similar to the TEM result. The specific surface areas of virgin, spent and regenerated Fe3O4 calculated based on BET method were 37.8, 38.1 and 37.9 m2 g−1, indicating negligible change in the specific surface area. Fe3O4 was also characterized by XPS to confirm the oxidation state of Fe (Fig. 1). The spectrum can be successfully fit to two main peaks and two satellite peaks in the 2p3/2 region (711 eV), with a repeated pattern, anticipated to be at half the intensity for the 2p1/2 component (725 eV) but with no restrictions placed upon binding energies, intensities or peak widths. The binding energies at 710.7 and 712.4 eV indicated the presence of Fe(II) 2p3/2 and Fe(III) 2p3/2, and 715.5 and 718.8 eV of Fe(II) 2p1/2 and Fe(III) 2p1/2. These values are comparable to others found in the literature.30,31
image file: c6ra07231c-f1.tif
Fig. 1 TEM and XPS for virgin Fe3O4 (a and d), spent Fe3O4 in Fe3O4/PMS process (b and e), regenerated Fe3O4 by NH2OH (c and f).

3.2 Role of NH2OH

The removal of OG by PMS alone was negligible and that by Fe3O4 was less than 8% in 30 min (data not shown). As can be seen in Fig. 2, little OG was degraded in NH2OH/PMS process, and less than 11% of OG was degraded in 30 min by Fe3O4/PMS process. Such low degradation efficiency in Fe3O4/PMS process could be interpreted with the limited Fe(II) sites on Fe3O4 and the slow transformation from Fe(III) to Fe(II).1 Surprisingly, with the addition of NH2OH, more than 99% of OG was degraded in 30 min and half mineralization was achieved in 3 hours (Fig. S3, no mineralization was observed without NH2OH) in Fe3O4/PMS process. Based on the aforementioned data and literature summary, it could be inferred that the addition of NH2OH into Fe3O4/PMS process might greatly accelerate the cycle of Fe(III)/Fe(II) on the surface of Fe3O4 and the generation of reactive radicals.10 The consumption of NH2OH in NH2OH/Fe3O4/PMS process also confirmed its participation in the reaction (eqn. (1)–(5)), as shown in Fig. S4.
 
HSO5 + Fe2+ → SO4˙ + Fe3+ + OH (ref. 32) (1)
 
HSO5 + Fe2+ → SO42− + Fe3+ + ˙OH (2)
 
NH3OH+ + Fe3+ → Fe2+ + nitrogenous products (3)
 
HSO5 + ˙OH → SO5˙ + H2O (ref. 5) (4)
 
HSO5 + SO4˙ → SO5˙ + HSO4 (ref. 4) (5)

image file: c6ra07231c-f2.tif
Fig. 2 Degradation of OG in NH2OH/Fe3O4/PMS process. Conditions: [NH2OH]0 = 0.5 mM (no addition for Fe3O4/PMS process), [Fe3O4]0 = 0.5 g L−1 for NH2OH/Fe3O4/PMS and Fe3O4/PMS process, [PMS]0 = 1.0 mM, [OG]0 = 0.1 mM, pH = 3.0, 25 °C.

In order to confirm the transformation between Fe(II) and Fe(III) on Fe3O4 in NH2OH/Fe3O4/PMS process, the surface Fe(II)/Fe(III) molar ratio was calculated based on XPS analysis in Fig. 1. Apparently, Fe(II)/Fe(III) molar ratio (1.00) of virgin Fe3O4 was much higher than that (0.22) used after Fe3O4/PMS process, affirming the transformation of Fe(II) to Fe(III). Ardo et al.33 also observed a progressive transformation of Fe3O4 to γ-Fe2O3 by XRD and Fe K-edge X-ray absorption spectroscopy analysis with increasing exposure time to air. While after reduced by NH2OH, Fe(II)/Fe(III) molar ratio re-climbed to 2.62. Thus it can be safely concluded that NH2OH does participate in the transformation of Fe(III) to Fe(II). Owing to the successive recovery of Fe(II) by NH2OH and the excess of PMS, reactive radicals would be continuously generated via eqn (1) and (2), consequently enhancing the degradation of OG in NH2OH/Fe3O4/PMS process.

The suitability of NH2OH for Fe2O3 and iron sludge (obtained from classical Fenton process and the preparation procedures are shown in Text S6), also confirmed the rapid transformation of Fe(III) to Fe(II) (Figs. S5 and S6). OG removal in Fe2O3/PMS and iron sludge/PMS processes were 0 and 34% in 30 min, while the dosing of NH2OH largely increased OG degradation to 72% in 30 min and 100% in 5 min. Based on the remarkable performance of iron sludge in the presence of NH2OH, a continuous column reactor was established with iron sludge supported on activated alumina (Al2O3) as catalyst and its performance was detailed in Section 3.6. Thus this study might find a new way to dispose iron-based wastes from chemical industry or water/wastewater plants.

3.3 Catalytic performance of NH2OH/Fe3O4/PMS process

The kinetics of OG degradation in NH2OH/Fe3O4/PMS process was determined as functions of NH2OH concentration, PMS dosage, pH and temperature, respectively. As shown in Fig. 3, increased degradation of OG was observed with increasing NH2OH concentration from 0.1 to 1.0 mM. It should be noted that NH2OH here mainly existed in the form of NH3OH+ at pH 3.0 (Fig. S7) with pKa1 = 5.96.34 The degradation of OG was actually regulated by NH3OH+ with the addition of hydroxylamine into Fe3O4/PMS process. Although increased NH3OH+ concentration could accelerate the conversion of Fe(III)/Fe(II), the reasonable amount of generated ROS might be quenched by excess NH3OH+ (k = 1.5 × 10⁷ M−1 s−1 for SO4˙ (ref. 4) and k < 5.0 × 10⁸ M−1 s−1 for ˙OH (ref. 5)). Hence, a proper dosage of NH2OH should be selected in order to enhance the degradation of target compounds with higher efficiency and lower cost.
image file: c6ra07231c-f3.tif
Fig. 3 (a) Effect of NH2OH concentration on OG degradation in NH2OH/Fe3O4/PMS process; (b) the linear relationship between the first order reaction rate k (s−1) and the dosage of NH2OH in NH2OH/Fe3O4/PMS process. Conditions: [NH2OH]0 = 0.1–1.0 mM, [Fe3O4]0 = 0.5 g L−1, [PMS]0 = 1.0 mM, [OG]0 = 0.1 mM, pH = 3.0, 25 °C.

The effect of variable PMS concentration on the degradation of OG was studied in NH2OH/Fe3O4/PMS process, as shown in Fig. S8. The increased dosage of PMS from 0.5 to 2.0 mM had no effect on the kinetics of OG degradation, which indicated that the availability of PMS was not the limiting factor controlling the yield of radicals. This confirmed that NH2OH/Fe3O4/PMS process is a typical surface catalytic reaction, the reaction rate of which was controlled by the availability to the active sites on the heterogeneous catalyst. As PMS dosage was reduced to 0.1 mM, the degradation of OG stopped since 10 min due to the completely consuming of PMS (Fig. S9).

As shown in Fig. 4, OG degradation by Fe3O4/PMS or NH2OH/Fe3O4/PMS process exhibited strong pH dependent. Without NH2OH, the apparent first-order rate constant (k, s−1) was decreased linearly from 2.38 × 10⁻⁴ s−1 to 0 s−1 as pH increased from 2.0 to 4.0, above which no degradation was observed. But the addition of NH2OH greatly improved OG removal in the pH range of 2.0–7.0. As depicted in Fig. 4, with initial pH increasing from 2.0 to 3.0, OG removal was promoted in NH2OH/Fe3O4/PMS process due to the formation of Fe(OH)2, which has been reported to be more reactive than Fe(II) ions due to the presence of –OH groups, on the surface of Fe3O4.35 As pH increased from 3.0 to 7.0, the degradation of OG was sharply dropped from 2.22 × 10⁻³ s−1 to 3.55 × 10⁻⁴ s−1. This can be attributed to the species distribution of hydroxylamine at different pH. As pH increased from 3.0 to 7.0, the fraction of NH2OH gradually becomes the dominant existing form of hydroxylamine (Fig. S7). Hence, a considerable amount of generated radicals would be consumed by NH2OH at near neutral pH for the high reaction rate constants (9.5 × 10⁹ M−1 s−1 for ˙OH (ref. 5) and 8.5 × 10⁸ M−1 s−1 for SO4˙ (ref. 4)).


image file: c6ra07231c-f4.tif
Fig. 4 (a) Relationship between the first order reaction rates k (s−1) and pH; (b) effect of initial pH on OG removal. Conditions: [NH2OH]0 = 0.5 mM (no addition in Fe3O4/PMS process), [Fe3O4]0 = 0.5 g L−1, [PMS]0 = 1.0 mM, [OG]0 = 0.1 mM, reaction time = 30 min, pH = 2.0–7.0, 25 °C. Fe2+ dosages are 0.09 mg L−1, 0.04 mg L−1 and 0.01 mg L−1 at pH 2.0, 3.0 and 3.5, and 0 mg L−1 at pH 4.0–7.0.

The degradation of OG occurs on the catalyst surface (i.e., heterogeneous reaction) and/or in the bulk solution (i.e., homogeneous reaction). Which is the main process, heterogeneous NH2OH/Fe3O4/PMS or homogeneous NH2OH/Fe2+/PMS? To clarify the mechanism, the concentration of dissolved Fe ions leached from Fe3O4 at different pH was measured and the results are presented in Fig. 4. It is shown that under acidic condition, Fe dissolved slowly from Fe3O4, reaching a value of 0.09 mg L−1, 0.04 mg L−1 and 0.01 mg L−1 after 30 min at pH 2.0, 3.0 and 3.5 respectively. Thus, Fe3O4 was slightly unstable under strong acidic condition. While at weak acidic or near neutral condition (pH 4.0–7.0), dissolved Fe was always below detection limit. To evaluate the catalytic contribution from dissolved Fe, homogeneous experiments were conducted with introduction of Fe2+ into NH2OH/PMS solution. As can be observed in Fig. 4, OG degradation was much faster in heterogeneous reaction. Thus it can be safely concluded that the main catalytic effect is caused by solid Fe3O4, not dissolved Fe ions, whether at acidic or neutral pH.

The influence of temperature on degradation kinetics of OG in NH2OH/Fe3O4/PMS process is clarified in Fig. S10. With temperature increasing from 15 to 35 °C, OG removal was significantly accelerated and first order reaction rate constant k (s−1) climbed from 8.75 × 10⁻⁴ to 3.86 × 10⁻³ s−1. According to Arrhenius equation (eqn (6)), the activation energy (Ea) was determined by plotting ln[thin space (1/6-em)]k against 1/T:

 
image file: c6ra07231c-t1.tif(6)

The obtained Ea value for NH2OH/Fe3O4/PMS was 54.8 kJ mol−1, which was higher than that observed in acetaminophen degradation by Fe3O4/PMS process (36.8 kJ mol−1),12 indicating that NH2OH/Fe3O4/PMS process was more sensitive to the temperature fluctuation.

The effect of NH2OH on the stability of Fe3O4 was investigated by reusing it in ten successive experiments under the same reaction conditions and the results are shown in Fig. 5. Without NH2OH, the degradation of OG was negligible since the 2nd run. However, OG was totally decomposed during the ten successive runs due to the presence of NH2OH, indicating the regeneration of Fe(II) sites by NH2OH. It was interesting to find that the first order reaction rate climbed from 2.22 × 10⁻³ s−1 to 2.90 × 10⁻³ s−1 gradually with the increased runs. This may be caused by the newly formed iron hydroxide/oxide species, which were more amorphous, and had larger specific surface. This inference was confirmed by the excellent performance of iron sludge in Section 3.2. We tried to determine the exact species of the newly formed iron hydroxide/oxide by XRD analysis, but failed due to its low content or amorphousness.


image file: c6ra07231c-f5.tif
Fig. 5 OG removals in Fe3O4/PMS and NH2OH/Fe3O4/PMS processes and the variation of first order rate constants in NH2OH/Fe3O4/PMS process in ten consecutive runs. Conditions: [NH2OH]0 = 0.5 mM, [Fe3O4]0 = 0.5 g L−1, [PMS]0 = 1.0 mM, [OG]0 = 0.1 mM, pH = 3.0, 25 °C, reaction time = 30 min.

3.4 Identification of primary reactive oxidants

It has been well known that SO4˙, ˙OH, and SO5˙ can be generated for the catalyst-mediated activation of PMS3 (eqn (1), (2), (4) and (5)). Methanol is an effective quencher for both SO4˙ and ˙OH thanks to its higher reactivity with SO4˙ (2.5 × 10⁷ M−1 s−1 (ref. 4)) and ˙OH (9.7 × 10⁸ M−1 s−1 (ref. 5)), while TBA is effective for ˙OH (6.0 × 10⁸ M−1 s−1 (ref. 4)) but retardant to SO4˙ (8.0 × 10⁵ M−1 s−1 (ref. 5)). Meanwhile, compared with SO4˙ and ˙OH, SO5˙ is relatively inert to TBA and methanol (≤103 M−1 s−1 (ref. 36)). Thus quenching experiments performed with methanol can differentiate between the contribution of SO5˙ and SO4˙/˙OH, while that with TBA differentiates between the contribution of SO4˙ and ˙OH. Fig. 6(a) shows that the methanol (100 mM) almost completely inhibited OG degradation, indicating the contribution of SO5˙ was negligible. Meanwhile, the removal of OG dropped from 99% to 36.9% in the presence of 100 mM TBA. Therefore, it can be safely concluded that both SO4˙ and ˙OH are the primary reactive oxidants in NH2OH/Fe3O4/PMS process, which was in agreement with the observation in Fe3O4/PMS process.12
image file: c6ra07231c-f6.tif
Fig. 6 (a) Inhibition effect of methanol and TBA on OG degradation in NH2OH/Fe3O4/PMS process. Conditions: [Fe3O4]0 = 0.5 g L−1, [PMS]0 = 1.0 mM, [NH2OH]0 = 0.5 mM, [OG]0 = 0.1 mM, pH = 3.0, 25 °C; (b) EPR spectra obtained from PMS, Fe3O4/PMS and NH2OH/Fe3O4/PMS system with DMPO (image file: c6ra07231c-u1.tif represents ˙OH adduct and image file: c6ra07231c-u2.tif represents SO4˙ adduct). Conditions: [Fe3O4]0 = 1.0 g L−1, [PMS]0 = 2.0 mM, [NH2OH]0 = 1.0 mM, [DMPO]0 ≈ 0.1 M, pH = 3.0, 25 °C.

EPR experiments were performed in order to confirm the co-presence of ˙OH and SO4˙ in NH2OH/Fe3O4/PMS process. As seen in Fig. 6(b), when pure water was examined with DMPO, no peak was identified, indicating no spin was captured. When Fe3O4 was dosed with PMS together, the characteristic peaks of DMPO–HO and DMPO–SO4 adducts appeared in the meantime. The intensity of DMPO adducts signals in NH2OH/Fe3O4/PMS process was much stronger than that in Fe3O4/PMS process, indicating NH2OH promoted the generation of reactive radicals. Moreover, it was worth noting that the intensity of DMPO–OH was stronger than its counterpart DMPO–SO4 with or without NH2OH. This could be interpreted with the fast conversion of DMPO–SO4 to DMPO–OH via nucleophilic substitution.37,38

3.5 Degradation products of NH2OH

Since NH2OH is toxic and totally soluble, it is necessary to examine its degradation products in NH2OH/Fe3O4/PMS process in case of the newly formed hypertoxic byproducts. As depicted in Fig. S4, NH2OH was gradually consumed by either Fe(III), SO4˙ or ˙OH in NH2OH/Fe3O4/PMS process. Due to the extremely low concentration of relevant radicals (10−15–10−18 M−1) in aquatic solution39 when compared with Fe(III) (about 6.5 × 10⁻³ M−1) in this study, it can be safely deduced that NH2OH was mainly exhausted by Fe(III).10 Dinitrogen (N2), nitrous oxide (N2O), nitrite (NO2) and nitrate (NO3) have been proved to be the dominating end products of NH2OH when reacting with Fe(III) and SO4˙/˙OH.40–42 Thus the concentrations of N2, N2O, NO2, and NO3 were determined during the reaction, and it was found the sum of N–NH2OH, N–N2O, N–NO2, N–NO3 and N–N2 after 30 min was approximately equal to the initial concentration of N–NH2OH, as shown in Fig. S11. This confirmed that all the products of NH2OH were quantified in this study, among which the eco-friendly N2 was the dominating one.41 However, it should be noted that nearly 20% of NH2OH still existed after OG was completely decomposed, as shown in Fig. S11. Hence, a reasonable excess of PMS might be necessary to decompose the residual NH2OH, although PMS dosage has no effect on the performance of organics decomposition. Considering the toxicity of NH2OH, NO2, and NO3 to human beings and aquatic microorganism, NH2OH/Fe3O4/PMS process is more applicable in wastewater treatment than drinking water treatment.

3.6 Catalytic treatment of OG in a column reactor

In order to evaluate the performance of the catalytic treatment system in a continuous flow configuration, experiments were conducted using the continuous flow-through column reactor packed with 1.5 wt% Fe/Al2O3 catalyst (Fig. S1). Stable and reproducible performance of catalytic OG treatment was demonstrated and NH2OH products in the column effluent were shown in Fig. 7. From 71 to 100% OG removal was observed for continuous operation over more than 30 days for the favorable solution with NH2OH, PMS and OG flow rate of 0.1–0.3, 0.1 and 1.5–3.0 mL min−1, respectively. NO2 and N2O are known intermediates of NH2OH oxidation, while N2 gas and NO3 are stable end products.10,25 The effluent NH2OH concentration was ca. 3% and N2 concentration ca. 37% of influent NH2OH concentration with NH2OH, PMS and OG flow rate of 0.1, 0.1 and 1.5 mL min−1. Hence, more than one-third of influent NH2OH was converted to N2, which was considered a desired product for its environment-friendly property and ubiquitous presence in the atmosphere. When NH2OH and OG flow rates were doubled (days 12–14), less OG oxidation occurred because the retention time was halved. Meanwhile, less NO3 and N2O, and more N2 formation was observed. It was worth noting that the effluent NH2OH concentration increased from ca. 3% to ca. 9.5% with its influent flow rate doubled. From day 15 to 17, the removal of OG decreased sharply to 71% due to less injection of NH2OH into the column reactor. With increasing NH2OH flow rate by three folds (days 25–28), OG was completely removed by relative radicals. N2 and effluent NH2OH concentrations climbed to ca. 52% and 33% of influent NH2OH concentration respectively, while the formation of NO3, NO2 and N2O decreased sharply. This result was consistent with the previous findings, in which with an excess of NH2OH to Fe(III), the main end product of NH2OH was N2.41 The degradation kinetics of OG in column reactor was compared with that of batch experiments with 1.5 wt% Fe/Al2O3 as catalyst. Assuming pseudo-1st-order reaction kinetics, catalyst activity of column reactor was estimated as 0.025 mM OG/(min−1 gFe), which is only 57% of the activity (0.044 mM OG/(min−1 gFe)) observed for the same catalyst composition in the batch reactor experiments (Fig. S12). The lower catalyst activity measured in the column system was likely due to reactants (i.e. PMS, NH2OH and OG) transfer limitations to catalyst sites. Although the findings suggested that performance of sequencing batch reactor with suspended catalysts may be much better than column system, the continuous column reactor was favored for its advantages such as small occupation of land, and convenient of manage and running etc. Further optimization of reactor engineering will be needed to develop the most efficient continuous-flow reactor system and to enhance the production of eco-friendly N2. Nevertheless, the result here addresses the primary objective of demonstrating stable operation of a continuous catalytic treatment system, i.e., no apparent loss of activity occurring over an extended period of operation (i.e., >30 days). In addition, negligible loss of Fe from catalyst support materials was detected after one month of continuous operation.
image file: c6ra07231c-f7.tif
Fig. 7 Continuous treatment of OG in a packed bed column reactor system. Conditions: 1.5 wt% Fe/Al2O3, [PMS]0 = 10 mM, PMS flow rate = 0.1 mL min−1, [NH2OH]0 = 5 mM, NH2OH flow rate = 0.1–0.3 mL min−1, [OG]0 = 0.1 mM, OG flow rate = 1.5–3.0 mL min−1, pH = 3.0, 25 °C.

4. Conclusion

The applicability of catalytic treatment technologies for azo dye treatment was evaluated by NH2OH enhanced Fe3O4/PMS process. The addition of NH2OH into Fe3O4/PMS process greatly accelerated the cycle of Fe(III)/Fe(II) on the surface of Fe3O4 and the generation of reactive radicals, i.e. SO4˙ and ˙OH. The end degradation products of NH2OH were N2, N2O, NO2 and NO3 in NH2OH/Fe3O4/PMS process, while the eco-friendly N2 was the major product. The suitability of NH2OH for other iron oxides/hydroxides to activate PMS was confirmed, and the amorphous iron sludge displayed the best catalytic performance. Thus, continuous treatment of OG using 1.5 wt% Fe/Al2O3 catalyst (iron sludge immobilized on activated alumina particles) packed into a flow column reactor was performed, whose performance was stable and no loss in activity over 30 d of operation was observed. However, lower apparent catalyst activity observed in the column reactor than sequencing batch reactor setup suggests mass transfer limitations that will require further reactor optimization.

Acknowledgements

This work was supported by the National Natural Science Foundation (51508152), Natural Science Foundation of Jiangsu Province (BK20150812), the China Postdoctoral Science Foundation (2015M571660), the Fundamental Research Funds for the Central Universities (2014B12614) and the Priority Academic Program Development of Jiangsu Higher Education Institutions.

References

  1. G. P. Anipsitakis and D. D. Dionysiou, Environ. Sci. Technol., 2004, 38, 3705–3712 CrossRef CAS PubMed.
  2. K. H. Chan and W. Chu, Water Res., 2009, 43, 2513–2521 CrossRef CAS PubMed.
  3. Y. H. Guan, J. Ma, X. C. Li, J. Y. Fang and L. W. Chen, Environ. Sci. Technol., 2011, 45, 9308–9314 CrossRef CAS PubMed.
  4. P. Neta, R. E. Huie and A. B. Ross, J. Phys. Chem. Ref. Data, 1988, 17, 1027–1284 CrossRef CAS.
  5. G. V. Buxton, C. L. Greenstock, W. P. Helman and A. B. Ross, J. Phys. Chem. Ref. Data, 1988, 17, 513–886 CrossRef CAS.
  6. M. Mahdi-Ahmed and S. Chiron, J. Hazard. Mater., 2014, 265, 41–46 CrossRef CAS PubMed.
  7. J. A. Khan, X. X. He, H. M. Khan, N. S. Shah and D. D. Dionysiou, Chem. Eng. J., 2013, 218, 376–383 CrossRef CAS.
  8. D. Y. Deng, L. B. Peng, M. Y. Guan and Y. Kang, J. Hazard. Mater., 2014, 264, 521–528 CrossRef CAS PubMed.
  9. Y. R. Wang and W. Chu, Water Res., 2011, 45, 3883–3889 CrossRef CAS PubMed.
  10. J. Zou, J. Ma, L. W. Chen, X. C. Li, Y. H. Guan, P. C. Xie and C. Pan, Environ. Sci. Technol., 2013, 47, 11685–11691 CrossRef CAS PubMed.
  11. M. Stoyanova, I. Slavova, S. Christoskova and V. Ivanova, Appl. Catal., A, 2014, 476, 121–132 CrossRef CAS.
  12. C. Q. Tan, N. Y. Gao, Y. Deng, J. Deng, S. Q. Zhou, J. Li and X. Y. Xin, J. Hazard. Mater., 2014, 276, 452–460 CrossRef CAS PubMed.
  13. G. P. Anipsitakis and D. D. Dionysiou, Appl. Catal., B, 2004, 54, 155–163 CrossRef CAS.
  14. T. Zhang, H. B. Zhu and J. P. Croue, Environ. Sci. Technol., 2013, 47, 2784–2791 CrossRef CAS PubMed.
  15. G. P. Anipsitakis, E. Stathatos and D. D. Dionysiou, J. Phys. Chem. B, 2005, 109, 13052–13055 CrossRef CAS PubMed.
  16. X. Y. Chen, J. W. Chen, X. L. Qiao, D. G. Wang and X. Y. Cai, Appl. Catal., B, 2008, 80, 116–121 CrossRef CAS.
  17. X. M. Xiong, B. Sun, J. Zhang, N. Y. Gao, J. M. Shen, J. L. Li and X. H. Guan, Water Res., 2014, 62, 53–62 CrossRef CAS PubMed.
  18. Y. B. Ding, L. H. Zhu, N. Wang and H. Q. Tang, Appl. Catal., B, 2013, 129, 153–162 CrossRef CAS.
  19. H. Zhang, Z. Wang, C. C. Liu, Y. Z. Guo, N. Shan, C. X. Meng and L. Y. Sun, Chem. Eng. J., 2014, 250, 76–82 CrossRef CAS.
  20. A. Rastogi, S. R. Al-Abed and D. D. Dionysiou, Water Res., 2009, 43, 684–694 CrossRef CAS PubMed.
  21. H. Q. Sun, G. L. Zhou, S. Z. Liu, H. M. Ang, M. O. Tade and S. B. Wang, ACS Appl. Mater. Interfaces, 2012, 4, 6235–6241 CAS.
  22. Q. Yang, H. Choi, S. R. Al-Abed and D. D. Dionysiou, Appl. Catal., B, 2009, 88, 462–469 CrossRef CAS.
  23. J. Liu, Z. W. Zhao, P. H. Shao and F. Y. Cui, Chem. Eng. J., 2015, 262, 854–861 CrossRef CAS.
  24. B. Yang, Z. Tian, B. Wang, Z. B. Sun, L. Zhang, Y. P. Guo, H. Z. Li and S. Q. Yan, RSC Adv., 2015, 5, 20674–20683 RSC.
  25. L. W. Chen, J. Ma, X. C. Li, J. Zhang, J. Y. Fang, Y. H. Guan and P. C. Xie, Environ. Sci. Technol., 2011, 45, 3925–3930 CrossRef CAS PubMed.
  26. A. El-Ghenymy, F. Centellas, J. A. Garrido, R. M. Rodriguez, I. Sires, P. L. Cabot and E. Brillas, Electrochim. Acta, 2014, 130, 568–576 CrossRef CAS.
  27. K. P. Sharma, S. Sharma, S. Sharma, P. K. Singh, S. Kumar, R. Grover and P. K. Sharma, Chemosphere, 2007, 69, 48–54 CrossRef CAS PubMed.
  28. A. B. dos Santos, F. J. Cervantes and J. B. van Lier, Bioresour. Technol., 2007, 98, 2369–2385 CrossRef CAS PubMed.
  29. S. Wacławek, K. Grübel and M. Cerník, Spectrochim. Acta, Part A, 2015, 149, 928–933 CrossRef PubMed.
  30. J. J. Du and C. Y. Jing, J. Colloid Interface Sci., 2011, 358, 54–61 CrossRef CAS PubMed.
  31. W. Wang and B. H. Gu, Appl. Spectrosc., 2005, 59, 1509–1515 CrossRef CAS PubMed.
  32. C. Brandt and R. Vaneldik, Chem. Rev., 1995, 95, 119–190 CrossRef CAS.
  33. S. G. Ardo, S. Nelieu, G. Ona-Nguema, G. Delarue, J. Brest, E. Pironin and G. Morin, Environ. Sci. Technol., 2015, 49, 4506–4514 CrossRef CAS PubMed.
  34. R. Robinson and V. Bower, J. Phys. Chem., 1961, 65, 1279–1280 CrossRef CAS.
  35. J. J. Pignatello, E. Oliveros and A. MacKay, Crit. Rev. Environ. Sci. Technol., 2006, 36, 1–84 CrossRef CAS.
  36. E. Hayon, A. Treinin and J. Wilf, J. Am. Chem. Soc., 1972, 94, 47–57 CrossRef CAS.
  37. G. S. Timmins, K. J. Liu, E. J. H. Bechara, Y. Kotake and H. M. Swartz, Free Radical Biol. Med., 1999, 27, 329–333 CrossRef CAS PubMed.
  38. J. Zhang, M. Y. Chen and L. Zhu, RSC Adv., 2016, 6, 758–768 RSC.
  39. J. M. Burns, W. J. Cooper, J. L. Ferry, W. D. King, B. P. DiMento, K. McNeill, C. J. Miller, W. L. Miller, B. M. Peake, S. A. Rusak, A. L. Rose and D. T. Waite, Aquat. Sci., 2012, 74, 683–734 CrossRef CAS.
  40. M. D. Johnson and B. J. Hornstein, Inorg. Chem., 2003, 42, 6923–6928 CrossRef CAS PubMed.
  41. G. Bengtsson, S. Fronaeus and L. Bengtsson-Kloo, J. Chem. Soc., Dalton Trans., 2002, 2548–2552 RSC.
  42. J. Lind and G. Merenyi, J. Phys. Chem. A, 2006, 110, 192–197 CrossRef CAS PubMed.

Footnote

Electronic supplementary information (ESI) available. See DOI: 10.1039/c6ra07231c

This journal is © The Royal Society of Chemistry 2016
Click here to see how this site uses Cookies. View our privacy policy here.