Simple and facile preparation of silver–polydopamine (Ag–PDA) core–shell nanoparticles for selective electrochemical detection of cysteine†
Raju Thotaab and
V. Ganesh*ab
aElectrodics and Electrocatalysis (EEC) Division, CSIR – Central Electrochemical Research Institute (CSIR – CECRI), Karaikudi – 630003, Tamilnadu, India. E-mail: vganesh@cecri.res.in; ganelectro@gmail.com; Fax: +91-4565-227779; Tel: +91-4565-241242
bAcademy of Scientific and Innovative Research (AcSIR), New Delhi – 110025, India
First published on 12th May 2016
Abstract
Selective and sensitive non-enzymatic electrochemical detection of cysteine (CySH) is achieved in the present work using a polydopamine capped silver nanoparticles (Ag–PDA) modified indium tin oxide (ITO) electrode. Efficient redox properties, synergistic effects and the specific steric hindrance associated with the Ag–PDA core–shell nanoparticles provide higher selectivity and larger sensitivity for CySH detection over other competitive bio-thiols namely, homo-cysteine and glutathione. A simple one-step method is used for the preparation of Ag–PDA core–shell nanoparticles. The structure, morphology and composition of Ag–PDA nanoparticles are characterized by using field emission scanning electron microscopy (FESEM), transmission electron microscopy (TEM), X-ray diffraction (XRD), X-ray photoelectron spectroscopy (XPS), UV-visible (UV-vis) and Fourier transform infra red (FTIR) spectroscopic techniques. Electrochemical characteristics are investigated by using cyclic voltammetry (CV) and linear sweep voltammetry (LSV). These studies clearly reveal the formation of Ag–PDA nanocomposite on the ITO electrodes and their corresponding redox properties. Non-enzymatic electrochemical detection of CySH is carried out using Ag–PDA modified ITO electrodes in 0.1 M PBS (pH = 5.0) aqueous solution. Under the optimized conditions, this particular electrochemical biosensor exhibits a perfect linear calibration plot in the concentration range between 0.05 μM and 300 μM. Further, a sensitivity value of 0.023 μA μM−1 and a lower detection limit of 0.02 μM are determined for CySH detection. Moreover this Ag–PDA modified ITO electrode is applied further for the determination of CySH in human blood serum samples and the results are promising and satisfactory, suggesting the possible analytical application of this biosensor for the determination of CySH in biological samples.
1. Introduction
L-Cysteine (CySH) is one of the most important biological thiols possessing a very low molecular mass. It plays a key role in cellular metabolism and antioxidation protection.1,2 Altered levels of CySH in physiological fluids of human beings such as plasma, urine and saliva results in a number of clinical situations like slower growth, hair de-pigmentation, edema, lethargy, liver damage, muscle and fat loss, skin lesions, body weakness, etc.1–3 Monitoring the level of CySH concentration in such physiological fluids can serve as a valuable biomarker for several clinical diseases and associated applications. The normal and allowed levels of CySH in human body fluids varies between 5 μM and 30 μM and any deviation from this concentration range leads to severe problems as mentioned above.2 A number of methods have been developed for CySH detection including high performance liquid chromatography (HPLC), gas chromatography paired with mass spectrometry, fluorimetry and electrochemistry.1,4–11 Among these methods electrochemical detection has attracted a lot of attention due to its low cost, high sensitivity, fast response time and smaller dimensions of electrochemical sensors (microelectrodes) and also they are more suitable to be applied to in vivo and on site analyses.12–14 However many reports show that selective detection of CySH using solid electrodes such as platinum (Pt), gold (Au) and graphite is still very challenging due to their poor electrochemical catalytic behaviour towards CySH detection. To some extent these problems have been overcome by the use of redox mediators and chemically modified electrodes with suitable functional materials. Recently, many different chemically modified electrodes comprising of carbon based materials like graphene nanoribbon,14 noble metals along with carbon hybrids, multi-walled carbon nanotubes–gold nanorods,15 multi-walled carbon nanotubes–Au nanoparticles,16 graphene oxide–Au nanoclusters3 and metal–organic frameworks17 have been reported for the detection of CySH. Among the redox mediators catechol group possess a unique redox activity owing to the presence of hydroquinone/quinone redox system that can mediate electron transfer reactions across electrode–electrolyte interfaces at a much faster kinetics. Some of the literature reports state that quinone moiety containing redox active polymers modified electrode has also been used for sensing of CySH.18,19Dopamine (DA) is an important catecholamine neurotransmitter consisting of catechol groups. It can be oxidized and spontaneously self-polymerized under alkaline conditions (pH > 7.0) to form polydopamine (PDA) which consists of intrinsic redox moiety namely quinone within its structure.20,21 In addition DA also has the ability to reduce metal ions to metal nanoparticles (for example, Au3+ to Au0 and Ag+ to Ag0) and simultaneously PDA can stabilize these nanoparticles by preventing their aggregation.22–24 Particularly the metal-binding ability of catechol and nitrogen containing groups present within PDA enable high yields of metal–carbon hybrid materials, which is likely to enhance their applications in the fields of electrochemistry and photochemistry. Very recently Ag nanoparticles loaded with PDA spheres are reported for antibacterial applications.25 Moreover hybrid hollow microspheres of Ag stabilized by PDA are demonstrated to be a potential electrochemical biosensor for the detection of hydrogen peroxide (H2O2).26 Similarly one-step synthesis of monodispersed PDA coated silver core–shell nanostructure for enhanced photocatalytic application is also reported.27
Inspired by these points and the necessity of selective CySH detection, in this work for the first time to the best of our knowledge, polydopamine capped silver nanoparticles modified ITO electrode (Ag–PDA/ITO) is demonstrated for the selective detection of CySH using an electrochemical method. Particularly intrinsic redox property associated with PDA and synergistic effect arises from Ag–PDA nanoparticles are explored for the selective and sensitive non-enzymatic electrochemical detection of CySH. A simple in situ method without using any additional reducing and/or stabilizing reagents is employed for the preparation of Ag–PDA core–shell nanoparticles. Structural and morphological characterizations of such nanoparticles are analyzed by using FESEM, TEM, XRD, XPS, UV-vis and FTIR techniques. Electrochemical studies, primarily cyclic voltammetry (CV) and linear sweep voltammetry (LSV) are used for investigating the electrochemical characteristics of Ag–PDA nanoparticles modified ITO electrodes (Ag–PDA/ITO). These studies clearly reveal interesting electrochemical characteristics associated with that of CySH oxidation on Ag–PDA/ITO electrodes. Further the fabrication of non-enzymatic electrochemical biosensor is carried out by exploring their corresponding (electro)catalytic activity and several characteristics of such a sensor are determined. These parameters are much superior when compared to PDA/ITO and Ag nanoparticles modified ITO (Ag/ITO) electrodes in terms of increasing current density associated with the sensing of target analyte, CySH along with a higher sensitivity and lower detection limit values. This may be due to the enhanced electron transfer arising out of the synergistic effect of metallic Ag nanoparticles, specific steric hindrance and the catechol redox mediator present within PDA shell. Furthermore stability and reproducibility of these sensor electrodes are also analyzed along with the possible applications in real sample analysis by employing human blood serum samples.
2. Experimental section
2.1. Chemicals
Silver nitrate (AgNO3), dopamine (DA), ammonium hydroxide (30%), L-cysteine (CySH), L-homocysteine (HCy), L-glutathione (GSH), L-ascorbic acid (AA), uric acid (UA) and D(+)-glucose were obtained from Sigma Aldrich, Bangalore, India and used as received without any further purification. Millipore water having a resistivity of 18.2 MΩ cm was obtained from the quartz distillation unit and used for the preparation of all aqueous solutions employed in this work. ITO electrodes were purchased from Delta Technologies Limited, Stillwater, MN, USA. This plate (25 mm × 75 mm × 0.7 mm) is a single side polished, SiO2 passivated float glass coated with ITO film of ∼200–500 nm thickness and with a sheet resistance of Rs = 4–8 Ω.2.2. Synthesis of PDA stabilized Ag nanoparticles
About 100 mL of 10 mM AgNO3 aqueous solution was prepared and 375 μL of ammonium hydroxide solution was added drop-wise with continuous stirring until the initially formed precipitate was dissolved. pH of this particular solution was determined to be 8.8. To this clear solution about 380 mg of dopamine was added and stirring was continued for further ∼12 hours. The resultant solution was then centrifuged and washed several times with water. Finally the filtrate obtained was dried at room temperature. For comparison PDA without silver doping (absence of silver nitrate addition) was also prepared using the same procedure under similar reaction conditions. Then the resultant solution was centrifuged and the filtrate obtained was washed with water and finally dried at room temperature. Similarly Ag nanoparticles in the absence of PDA were also prepared by following a recently reported procedure in which a simple chemical reduction of silver salt is carried out for obtaining Ag nanoparticles.28 Structure, morphology and composition of the resultant filtrates were analyzed by using microscopic (FESEM, TEM) and spectroscopic (FTIR, UV-vis, XPS and XRD) techniques.2.3. Fabrication of Ag–PDA nanoparticles modified ITO electrode
Before modification, ITO electrode was cleaned thoroughly by sonication in ethanol, acetone and water for about 5 minutes each. Then pre-cleaned ITO electrodes were soaked in a mixture of 1![[thin space (1/6-em)]](https://www.rsc.org/images/entities/char_2009.gif) :
:![[thin space (1/6-em)]](https://www.rsc.org/images/entities/char_2009.gif) 3
3![[thin space (1/6-em)]](https://www.rsc.org/images/entities/char_2009.gif) :
:![[thin space (1/6-em)]](https://www.rsc.org/images/entities/char_2009.gif) 5 ratio of H2O2
5 ratio of H2O2![[thin space (1/6-em)]](https://www.rsc.org/images/entities/char_2009.gif) :
:![[thin space (1/6-em)]](https://www.rsc.org/images/entities/char_2009.gif) NH4OH
NH4OH![[thin space (1/6-em)]](https://www.rsc.org/images/entities/char_2009.gif) :
:![[thin space (1/6-em)]](https://www.rsc.org/images/entities/char_2009.gif) H2O for about 1 hour to activate the surface of ITO electrodes. Afterwards they were washed several times with distilled water and dried. Then the surface activated ITO electrodes were modified with Ag–PDA nanoparticles by simply drop casting 20 μL/0.25 cm2 of the nanoparticles solution obtained by re-suspension of the precipitate in distilled water (3 mg mL−1). Further the modified ITO electrodes were dried at room temperature for about 2–3 hours. For comparison PDA modified ITO electrodes in absence of Ag (PDA/ITO) and Ag nanoparticles modified ITO electrodes in the absence of PDA (Ag/ITO) were also prepared by using a similar procedure and used for further analyses and studies.
H2O for about 1 hour to activate the surface of ITO electrodes. Afterwards they were washed several times with distilled water and dried. Then the surface activated ITO electrodes were modified with Ag–PDA nanoparticles by simply drop casting 20 μL/0.25 cm2 of the nanoparticles solution obtained by re-suspension of the precipitate in distilled water (3 mg mL−1). Further the modified ITO electrodes were dried at room temperature for about 2–3 hours. For comparison PDA modified ITO electrodes in absence of Ag (PDA/ITO) and Ag nanoparticles modified ITO electrodes in the absence of PDA (Ag/ITO) were also prepared by using a similar procedure and used for further analyses and studies.
2.4. Instrumentation
UV-vis spectra were recorded using Perkin Elmer Lambda 650 UV-vis spectrometer obtained from US. FTIR spectra were recorded using Bruker Optik GmbH spectrometer. FESEM studies were performed using Hitachi model S3000-H. Transmission electron microscopic (TEM) images were recorded by using TECNAI G2 20 FEI model operated at 200 kW. XRD analysis was carried out using Cu Kα radiation with a wavelength of 1.540 Å within 10–90 degrees 2θ range with the help of XPERT-PRO multipurpose X-ray diffractometer procured from The Netherlands. X-ray photoelectron spectroscopy (XPS) was recorded using Thermo Scientific equipment, Multilab-2000 model obtained from UK. All these spectra were recorded using an X-ray source consisting of Al Kα radiation within a scan range of 0–1200 eV binding energy. The collected high resolution XPS spectra were analyzed using XPS peak fitting software. Electrochemical studies were performed using Bio-Logic instrument, Model: SP 240 procured from France and the data obtained were analyzed using EC-Lab software provided by them. All the other necessary parameters are mentioned in the respective diagrams.3. Results and discussion
3.1. UV-visible and FTIR spectroscopic studies
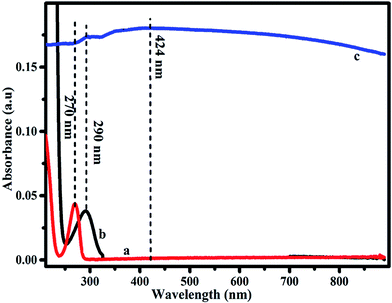
UV-visible spectroscopic studies are performed to understand and analyse the formation of Ag–PDA nanoparticles. The reduction of Ag+ ions during the self-polymerization process is initially confirmed by UV-vis spectroscopy and the corresponding spectra are shown in Fig. 1. For comparison similar spectra obtained for Ag+ (a) ions and DA (b) are also provided. Appearance of the absorption peaks at 270 nm and 290 nm corresponds to Ag+ and DA respectively. Both these peaks almost disappeared after the self-polymerization of DA to PDA (c) and during this process Ag+ ions are reduced to Ag0. A typical broad absorption peak observed at 424 nm clearly indicates the formation of Ag nanoparticles due to the reduction of Ag+ ions.27–29 Further FTIR spectroscopic studies also confirm the formation of Ag–PDA nanoparticles due to the reaction of DA and Ag+ ions during the polymerization process (ESI; Fig. S1†). FTIR spectra of PDA and Ag–PDA nanoparticles exhibit the formation of a typical peak at 3350 cm−1 due to the stretching vibrations of –OH and –NH2 groups.22,25 Moreover the peaks at 1720 cm−1 and 1280 cm−1 are attributed to stretching vibrations of –C![[double bond, length as m-dash]](https://www.rsc.org/images/entities/char_e001.gif) O and C–O groups. Similarly the peaks at 1604 cm−1, 1512 cm−1 and 1367 cm−1 are ascribed to the stretching vibrations of –C
O and C–O groups. Similarly the peaks at 1604 cm−1, 1512 cm−1 and 1367 cm−1 are ascribed to the stretching vibrations of –C![[double bond, length as m-dash]](https://www.rsc.org/images/entities/char_e001.gif) C–, –C
C–, –C![[double bond, length as m-dash]](https://www.rsc.org/images/entities/char_e001.gif) N and C–N–C functional groups associated with indoline (or) indole structure present within PDA.25,30 The peak intensities of Ag–PDA nanoparticles are slightly different from that of PDA which might be due to the effect of Ag nanoparticles core. All these results clearly reveal the successful preparation of Ag nanoparticles doped PDA composite using self-polymerization of DA with the aid of Ag+ ions.
N and C–N–C functional groups associated with indoline (or) indole structure present within PDA.25,30 The peak intensities of Ag–PDA nanoparticles are slightly different from that of PDA which might be due to the effect of Ag nanoparticles core. All these results clearly reveal the successful preparation of Ag nanoparticles doped PDA composite using self-polymerization of DA with the aid of Ag+ ions.
3.2. Structural, morphological and phase characterization of Ag–PDA nanocomposite
Structural and morphological characterizations of Ag–PDA core–shell nanoparticles are analyzed by using FESEM, TEM, XRD and XPS studies. Fig. 2 shows the typical FESEM images of PDA/ITO (A) and Ag–PDA/ITO (B) modified electrodes. It can be seen from the images that PDA displays an aggregation of small oligomers (Fig. 2A). On the other hand Ag–PDA/ITO (Fig. 2B) electrode shows the formation of uniform and homogeneous spherical particles possessing the nanometer dimensions. Further the zoomed image of Ag–PDA/ITO (Fig. 2C) exhibits a bright silver core surrounded by a dark sheath of PDA forming a shell and average thickness of this shell is determined to be 2.8 ± 0.2 nm and the diameter of Ag core is estimated to be 300 ± 15 nm.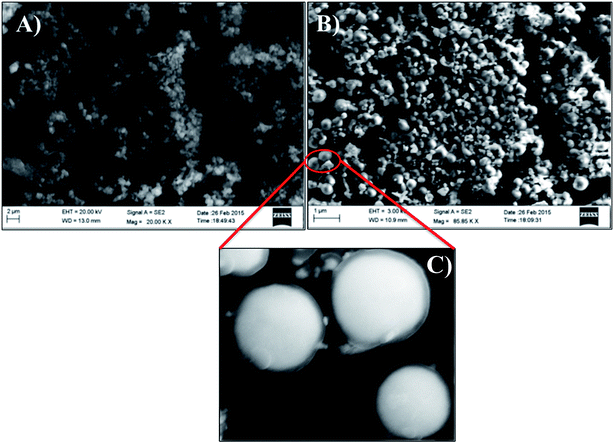 | ||
| Fig. 2 FESEM images of (A) PDA/ITO and (B) Ag–PDA/ITO modified electrodes. (C) Displays the zoomed image of (B). | ||
In order to obtain more detailed structural informations about these Ag–PDA nanoparticles, TEM and HRTEM analysis is also carried out. Fig. 3 shows TEM (A and B) and HRTEM (C) images of Ag–PDA nanoparticles. It can be clearly seen from these images that these nanoparticles show the formation of core–shell structures in which Ag forms a core and PDA forms a capping shell. Moreover HRTEM image shown in Fig. 3C supports these observations and reveal the formation of crystalline Ag core capped by amorphous PDA shell. For comparison TEM images of PDA in absence of silver are also analyzed (ESI; Fig. S2†). These images show the formation of agglomerated particles. It is interesting to note that these samples are prepared by simply drop-casting them onto copper coated carbon grids and these core–shell nanoparticles are uniformly distributed and representative images are recorded at other places of the grid too (ESI; Fig. S3†). Furthermore, particle size distribution analysis is also carried out from these images and the results show that the average particle size of the core is in the range of 293 ± 20 nm and for the shell it is calculated to be 3.1 ± 0.3 nm (ESI; Fig. S3†). These particle size values agree very well with our FESEM observations. Nevertheless these studies clearly show the formation of Ag–PDA core–shell nanoparticles in which Ag forms the core and PDA comprises of the shell.
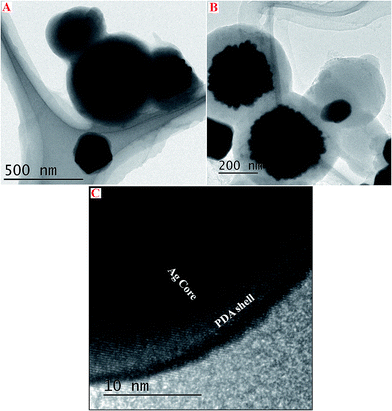 | ||
| Fig. 3 TEM images of Ag–PDA core–shell nanoparticles (A) and (B) at different scales and HRTEM image (C) of Ag–PDA nanoparticles clearly showing the formation of Ag core and PDA shell. | ||
Similarly XRD pattern of PDA (a) and Ag–PDA (b) nanoparticles modified ITO electrodes are recorded and the corresponding diffraction pattern are shown in Fig. 4. It can be noticed that both the samples display a broad peak in the range of 20°–30° ascribed to the amorphous characteristics of the PDA shell (inset).25,27 Further the formation of peaks at 38.36°, 44.52°, 64.73°, 77.65° and 81.70° in the case of Ag–PDA (b) nanoparticles are attributed to (111), (200), (220), (311) and (222) crystalline planes of face centred cubic (fcc) crystal structure of silver (JCPDS no. 83-0718).25,27 Absence of any other peaks suggests that the prepared materials are in pure form and crystalline in nature.
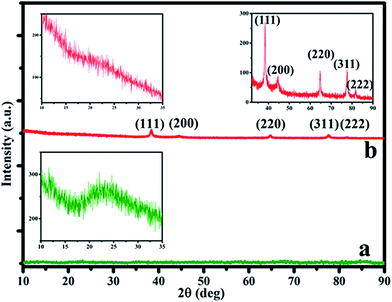 | ||
| Fig. 4 XRD pattern of PDA in absence of Ag (a) and Ag–PDA nanoparticles (b). Insets show the enlarged views of XRD pattern corresponding to PDA shell and Ag core in the composite. | ||
Further chemical compositions of PDA and Ag–PDA nanoparticles are analyzed using XPS and the corresponding spectra are shown in Fig. 5. Representative full scan XPS survey spectra of PDA (a) and Ag–PDA nanoparticles (b) are displayed in Fig. 5A. It can be seen that both the samples showed peaks in the region corresponding to C (1s), N (1s) and O (1s) and in the case of Ag–PDA in addition to these peaks, there are two more new peaks appeared at the binding energies of 368 eV and 374 eV (Fig. 5B) corresponding to Ag 3d5/2 and Ag 3d3/2 of Ag0 respectively.25,31 These observations confirm that Ag nanoparticles in Ag–PDA exist in the zero valent state. Similarly O 1s spectra of PDA and Ag–PDA nanoparticles exhibit the presence of two types of oxygen atom, one from the C–O functionality of catechol groups and the other –C![[double bond, length as m-dash]](https://www.rsc.org/images/entities/char_e001.gif) O moiety from the quinone groups (ESI; Fig. S4†). It is also observed that there is a slight shift in the binding energy value of O 1s to higher binding energy in the case of Ag–PDA when compared to PDA due to the structural interaction of oxygen containing groups of PDA shell with core Ag nanoparticles.27 These studies and observations clearly reveal the formation of spherical core–shell nanoparticles of Ag–PDA in which the core comprises of crystalline fcc form of Ag and PDA acts as a shell.
O moiety from the quinone groups (ESI; Fig. S4†). It is also observed that there is a slight shift in the binding energy value of O 1s to higher binding energy in the case of Ag–PDA when compared to PDA due to the structural interaction of oxygen containing groups of PDA shell with core Ag nanoparticles.27 These studies and observations clearly reveal the formation of spherical core–shell nanoparticles of Ag–PDA in which the core comprises of crystalline fcc form of Ag and PDA acts as a shell.
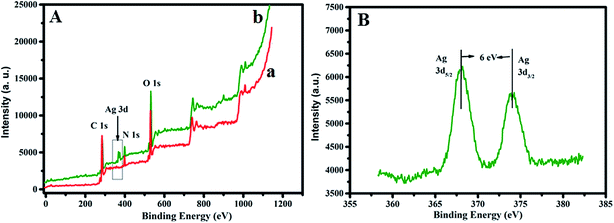 | ||
| Fig. 5 X-ray photoelectron spectra (XPS) of (A) full survey scan of (a) PDA and (b) Ag–PDA. (B) Ag 3d region of Ag–PDA nanoparticles. | ||
3.3. Electrochemical investigation of Ag–PDA nanocomposite modified electrode
Electrochemical studies are carried out using a three-electrode system where Ag–PDA/ITO is used as a working electrode, Pt as a counter and saturated Ag/AgCl as a reference electrodes respectively, in an aqueous 0.1 M PBS (pH = 5.0) buffer solution being employed as an electrolyte. Electrochemical characteristics of Ag–PDA/ITO electrode are investigated by using CV and for comparison a similar study using bare ITO electrode before modification is also carried out. Fig. 6 shows the cyclic voltammograms of bare ITO and Ag–PDA/ITO electrodes in 0.1 M PBS (pH = 5.0) buffer solution scanned within the potential ranging between −0.5 V and 1.0 V at a fixed sweep rate of 50 mV s−1. It can be noticed from figure that bare ITO (Fig. 6a) does not display any peaks indicating the electrochemical inactivity of the electrode surface within the potential range of study. On contrary after modification with Ag–PDA nanoparticles it displays (Fig. 6b) a prominent redox peak where oxidation peak corresponding to silver oxidation (Ag0 to Ag+) is observed at 0.125 V and the reduction peak associated with the reduction of silver (Ag+ to Ag0) appears at −0.199 V.25,27 These results indicate that Ag present in the composite exhibits a redox property with a very large peak separation between the forward and reverse peak. This also confirms the modification of ITO electrode with Ag–PDA nanoparticles.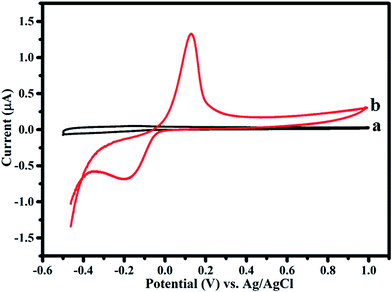 | ||
| Fig. 6 Cyclic voltammograms of (a) bare ITO and (b) Ag–PDA/ITO electrodes in an aqueous 0.1 M PBS (pH = 5.0) buffer solution at a scan rate of 50 mV s−1. | ||
3.4. Electrocatalytic oxidation of CySH at Ag–PDA/ITO electrode
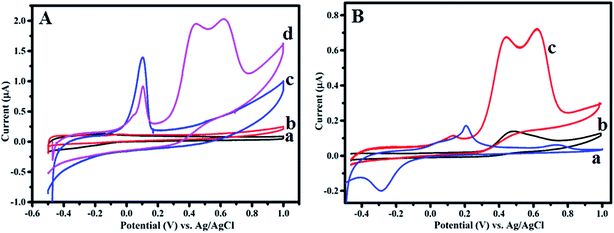
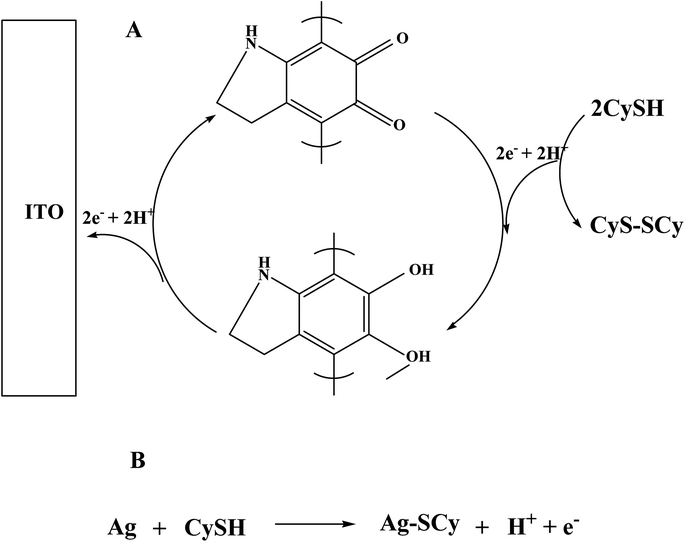
Further Ag–PDA/ITO electrode is explored for the possible application as an electrochemical biosensor for non-enzymatic detection of CySH. Fig. 7A displays CVs recorded for (a) bare ITO, (c) Ag–PDA/ITO electrodes in absence of CySH and (b) bare ITO, (d) Ag–PDA/ITO electrodes in presence of 50 μM CySH in 0.1 M PBS (pH = 5.0) buffer solution at a fixed scan rate of 50 mV s−1. It can be noticed that there is no oxidation peak in the range of −0.5 V to 1.0 V at bare ITO (Fig. 7A(a) and (b)) electrode both in absence and in presence of CySH. This may be due to the electrochemical inactivity of bare ITO towards CySH oxidation or may be due to the requirement of higher overpotential for direct oxidation of CySH on ITO electrode. On the other hand ITO surface modified with Ag–PDA nanoparticles, after the addition of 50 μM CySH (Fig. 7A(d)) shows two prominent oxidation peaks at 0.43 V and 0.624 V corresponding to the oxidation of CySH. The appearance of two oxidation peaks suggests that Ag–PDA modified ITO surface provides two different catalytic sites for CySH oxidation. One could be due to the core silver nanoparticles and another is owing to the redox moiety (hydroquinone/quinone) present within the shell made of PDA. It is interesting to note that the respective oxidation current values associated with these two oxidation peaks increased with the increasing concentration of CySH (ESI; Fig. S5†). These results clearly indicate that Ag–PDA/ITO electrode possess higher electrocatalytic activity towards CySH oxidation.For comparison similar CV studies are also carried out using Ag nanoparticles in absence of PDA (Ag/ITO) and PDA without Ag nanoparticles core (PDA/ITO) modified ITO electrodes and the corresponding CVs are shown in Fig. 7B. Here ‘a’, ‘b’ and ‘c’ designate the CVs of Ag/ITO, PDA/ITO and Ag–PDA/ITO electrodes respectively in 0.1 M PBS (pH = 5.0) solution consisting of 25 μM CySH. In case of Ag/ITO electrode (Fig. 7B(a)) two oxidation peaks are observed. The peak at 0.18 V corresponds to Ag oxidation as mentioned before and the peak at 0.73 V is attributed to the oxidation of CySH on Ag nanoparticles modified electrode. This particular peak is similar to the oxidation peak formed at 0.624 V for Ag–PDA/ITO electrode (Fig. 7B(c)) corresponding to CySH oxidation. Similarly the formation of peak at 0.48 V for PDA/ITO electrode (Fig. 7B(b)) is attributed to the catalytic oxidation of CySH, which is similar to the one observed at 0.43 V for Ag–PDA/ITO electrode (Fig. 7B(c)). Form this we concluded that the first oxidation peak at 0.43 V is due to quinone/hydroquinone mediated catalytic oxidation of CySH present within the PDA shell (method A in Scheme 1) and the second oxidation peak at 0.624 V may be attributed to the catalytic oxidation of CySH on the core silver nanoparticles by forming a silver metal complex with CySH (method B in Scheme 1). Thus we concluded that Ag–PDA/ITO electrode offers two different catalytic active sites for CySH oxidation and Scheme 1 depicts the possibility of CySH oxidation on those electrocatalytic active sites. Based on these results, a possible mechanism as shown in Scheme 1 is proposed for the oxidation of CySH on Ag–PDA/ITO electrodes. Furthermore, interestingly Ag–PDA/ITO electrode displays 0.05 V negative shift in the oxidation potential and 5 times higher oxidation current when compared to PDA/ITO electrode and 0.106 V negative shift along with more than 12 times higher oxidation current on comparison to Ag/ITO for CySH oxidation. This may be attributed to the synergistic effect of Ag–PDA nanoparticles.25,27,32,33
3.5. Optimization of electrochemical sensor parameters
Optimization of several parameters including the amount of Ag–PDA nanoparticles and pH of the sensing medium are critical for the electrochemical detection of CySH (ESI; Fig. S6†). Optimization of the amount of nanocomposite and pH used for the sensing of CySH is carried out by measuring the corresponding oxidation current values for a fixed concentration of 25 μM CySH using a scan rate of 50 mV s−1. The amount of Ag–PDA nanoparticles is varied between 0.5 mg mL−1 and 4 mg mL−1 and similarly pH of the electrolytic medium is changed from 4 to 9. It is observed that 3 mg mL−1 of Ag–PDA nanoparticles exhibit a higher oxidation current and further increase in amount of the composite results in a kind of saturation in the current values. Similarly pH 5 is identified to display a higher oxidation current for CySH detection. This may be due to the formation of zwitter ionic form (H2A) of CySH from pH 4 to 7 and the distribution fraction ranges from 99% within the pH range of 4 to 6, given the fact that the acid dissociation constant of CySH is 8.36.17 These results clearly show that the optimized condition for electrochemical detection of CySH is 3 mg mL−1 of Ag–PDA nanoparticles and the pH of electrolyte must be 5.3.6. Analytical applications
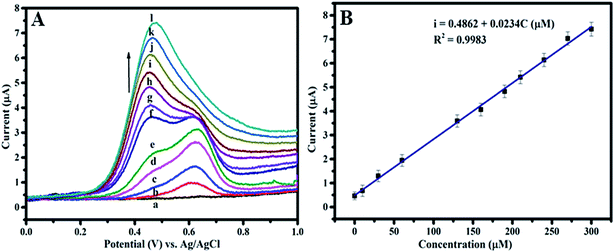
To explore the possible application of Ag–PDA/ITO electrode for electrochemical detection of CySH, linear sweep voltammetry (LSV) experiments are performed using the same electrolyte solution as mentioned above. Fig. 8A displays linear sweep voltammograms obtained upon increasing CySH concentration ranging from 0 μM to 300 μM. It can be seen that both the oxidation peak current values corresponding to CySH oxidation increase with increasing addition of CySH; but the oxidation current values of second peak observed at 0.624 V attain saturation at higher concentrations. The corresponding calibration curve is plotted using the first oxidation peak current values vs. concentration of CySH added and shown in Fig. 8B. From this plot, a linear concentration ranging from 0.05 μM to 300 μM is observed. Further a sensitivity value of 0.023 μA μM−1 and detection limit of 0.02 μM are determined for the proposed CySH sensor. These values determined for Ag–PDA/ITO electrode is compared with several other previously reported CySH sensor electrodes and the comparison is shown in Table 1. It can be noticed from Table 1 that the electrochemical sensor electrode proposed in this work exhibits much better sensor characteristics than the other electrodes reported earlier.2,3,11,14–16,19 Moreover reproducibility of this non-enzymatic electrochemical sensor electrode is analyzed by following two different methods viz., (i) 10 different sensors are prepared under the same manner and employed for measuring the LSV response for 50 μM CySH in 0.1 M PBS (pH = 5.0) buffer electrolyte solution at a scan rate of 50 mV s−1 and (ii) a single sensor of Ag–PDA/ITO electrode is analyzed 10 consecutive times for CySH detection. A relative standard deviation (RSD) value is calculated and it is determined to be less than 5% in the first case and it is about 3% in the latter case suggesting the results are highly reproducible. In addition the long term stability of modified electrode (Ag–PDA/ITO) is also investigated by measuring LSV response for 50 μM CySH in 0.1 M PBS (pH = 5.0) aqueous buffer solution at a scan rate of 50 mV s−1 over a period of more than 60 days. Results obtained indicate no significant change in the oxidation current values. The sensor electrodes are stored at room temperature when not in use. These observations convincingly proved that Ag–PDA/ITO electrode is highly reproducible and possess a long-term stability as an electrochemical biosensor for CySH detection.| Type of electrode | Method | Linear concentration range (μM) | Detection limit (μM) | Sensitivity (μA μM−1) | Ref. |
|---|---|---|---|---|---|
| a Au NCs – gold nanoclusters; MWCNTs – multiwall carbon nanotubes; NPy CME – Nafion lead ruthenate pyrochlore chemically modified electrode; PAQ – poly(aminoquinone), CTC – cyclotricatechylene, CCLP – calcium cross-linked pectin; Au NPs – gold nanoparticles. CA – chronoamperometry; DPV – differential pulse voltammetry; SWV – square wave voltammetry. | |||||
| Graphene oxide/Au NCs | CV | 0.5–2.0 | 0.02 | 6.410 | 3 |
| MWCNTs/gold nanorods (GNR) | CA | 5.0–200 | 0.008 | 0.120 | 15 |
| GNR–Nafion/GCE | DPV | 0.02–300 | 0.008 | 0.038 | 14 |
| NPy CME | SWV | Up to 560 | 1.91 | 0.0323 | 11 |
| PAQ–MWCNTs–Nafion/GCE | CA | — | 0.075 | 0.124 | 19 |
| CTC/GCE | CV | Up to 40 | 0.6 | 0.023 | 2 |
| MWCNTs/CCLP–Au NPs/GCE | Amperometry | 0.1–1000 | 0.019 | 0.46 | 16 |
| Ag–PDA/ITO | LSV | 0.05–300 | 0.02 | 0.023 | In this work |
3.7. Selectivity studies
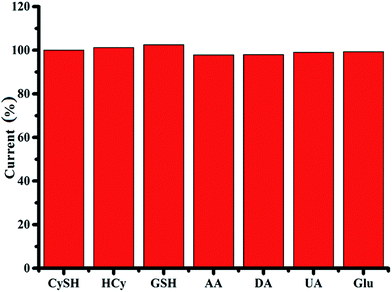
Selectivity studies are carried out by analyzing the CVs of Ag–PDA/ITO in 0.1 M PBS (pH = 5.0) buffer solution in absence and in the presence of 50 μM CySH along with 0.5 mM HCy and 0.5 mM GSH respectively (ESI; Fig. S7†). In presence of HCy and GSH only a very weak oxidation peak is observed at higher oxidation potential values namely 0.85 V and 0.93 V corresponding to the oxidation of HCy and GSH respectively by the formation Ag–thiol complex. This oxidation peak is obviously different from that of CySH, where two oxidation peaks are observed at 0.43 V and 0.624 V. These results indicate that Ag–PDA modified ITO electrode has a very good selectivity for CySH detection and shows the possibility of differentiating CySH from HCy and GSH which is a challenging task in the clinics at present. The size of CySH (molecular weight of ∼121 Da) is much smaller than HCy and GSH. In addition, due to the specific structure of CySH, it has a kind of selective access to Ag nanoparticles through PDA shell. To further verify the selectivity of Ag–PDA/ITO electrode for determination of CySH, different interferences namely HCy, GSH, ascorbic acid (AA), uric acid (UA), dopamine (DA) and glucose (Glu) are added in the electrolyte solution along with CySH and the corresponding LSV studies are carried out. The oxidation current for CySH detection is measured for the addition of each of these analytes and the respective current values are shown in Fig. 9. The results are carefully analysed and the interference current is found to be less than 3% (Fig. 9) suggesting a good selectivity for the proposed sensor for CySH detection.3.8. Real sample analysis
In an attempt to explore this electrochemical sensor for further practical and analytical applications, Ag–PDA/ITO electrode is analyzed for CySH sensing using human blood serum samples. These samples are obtained from the clinic of our institute through proper permission and approval constituted at the institute level. All these experiments are performed in compliance with the relevant laws and guidelines framed by the institute and the prior approval has been obtained from the committees. Moreover informed consent is also obtained for these experiments where human blood serum samples are used for the real sample analysis. The serum samples are stored under refrigeration when not in use. The recovery test is carried out by spiking these serum samples with different concentrations of CySH in 0.1 M PBS (pH = 5.0) buffer solution. The results obtained for addition of various concentrations of CySH along with the relative standard deviation values are shown in Table 2. The recovery values are estimated to be 98% to 101% indicating the proposed method is highly accurate and could possibly be extended for real sample analysis. The relative standard deviation value is determined to be 2.73% to 5.7% indicating the acceptable reproducibility for the proposed electrochemical biosensor.| Added | Sample | ||
|---|---|---|---|
| 1 | 2 | ||
| 0 μM | Found/μM | 0.19 | 0.23 |
| Recovery% | — | — | |
| RSD% | 2.73 | 5.10 | |
| 5 μM | Found/μM | 4.91 | 5.09 |
| Recovery% | 98.2 | 102 | |
| RSD% | 3.58 | 4.71 | |
| 10 μM | Found/μM | 9.73 | 9.86 |
| Recovery% | 97.3 | 98.6 | |
| RSD% | 4.68 | 4.97 | |
| 15 μM | Found/μM | 15.2 | 14.9 |
| Recovery% | 101 | 99.3 | |
| RSD% | 5.70 | 3.90 | |
4. Conclusions
In summary PDA capped Ag nanoparticles are prepared by a simple in situ preparation method. Ag–PDA nanoparticles modified ITO electrode (Ag–PDA/ITO) is explored for the selective and sensitive non-enzymatic electrochemical detection of CySH. It has been shown that higher sensitivity and selectivity towards CySH detection arises mainly from the synergetic effect of Ag–PDA nanoparticles and the specific steric hindrance arises from the PDA shell of Ag–PDA core–shell nanostructures. Interestingly the proposed non-enzymatic electrochemical biosensor distinguishes CySH from homocysteine and glutathione. Moreover this particular electrochemical biosensor also exhibits a lower detection limit along with a good reproducibility and long term stability. Finally this sensor has also been successfully employed for the detection of CySH in real sample analysis using human blood serum samples.Acknowledgements
Authors are thankful to Central Instrumentation Facility (CIF) of CSIR – CECRI, Karaikudi for providing various necessary characterization facilities. RT acknowledges CSIR, India for granting Senior Research Fellowship (SRF) for his PhD program.References
- S. R. Nambiar, K. P. Prathish, G. Karthik and T. P. Rao, Biosens. Bioelectron., 2011, 26, 3920–3926 CrossRef CAS PubMed.
- P. T. Lee, J. E. Thomson, A. Karina, C. Salter, C. Johnston, S. G. Davies and R. G. Compton, Analyst, 2015, 140, 236–242 RSC.
- S. Ge, M. Yan, J. Lu, M. Zhang, F. Yu, J. Yu, X. Song and S. Yu, Biosens. Bioelectron., 2012, 31, 49–54 CrossRef CAS PubMed.
- F. D. Carvalho, F. Remião, P. Valet, J. A. Timbrell, M. L. Bastos and M. A. Ferreira, Biomed. Chromatogr., 1994, 8, 134–136 CrossRef CAS PubMed.
- D. E. C. Cole, D. C. Lehotay and J. Evrovski, Clin. Chem., 1998, 44, 188–190 CAS.
- W. Leesutthiphonchai, W. Dungchai, W. Siangproh, N. Ngamrojnavanich and O. Chailapakul, Talanta, 2011, 85, 870–876 CrossRef CAS PubMed.
- C. G. Honegger, H. Langemann, W. Krenger and A. Kempf, J. Chromatogr. B: Biomed. Sci. Appl., 1989, 487, 463–468 CrossRef CAS.
- X. Yuan, Y. Tay, X. Dou, Z. Luo, D. T. Leong and J. Xie, Anal. Chem., 2013, 85, 1913–1919 CrossRef CAS PubMed.
- S. P. Stabler, P. D. Marcell, E. R. Podell, R. H. Allen, D. G. Savage and J. Lindenbaum, J. Clin. Invest., 1988, 81, 466–474 CrossRef CAS PubMed.
- R. Chand, S. Kumar Jha, K. Islam, D. Han, I.-S. Shin and Y.-S. Kim, Biosens. Bioelectron., 2013, 40, 362–367 CrossRef CAS PubMed.
- J.-M. Zen, A. S. Kumar and J.-C. Chen, Anal. Chem., 2001, 73, 1169–1175 CrossRef CAS.
- O. Nekrassova, N. S. Lawrence and R. G. Compton, Electroanalysis, 2004, 16, 1285–1291 CrossRef CAS.
- O. Nekrassova, N. S. Lawrence and R. G. Compton, Talanta, 2003, 60, 1085–1095 CrossRef CAS PubMed.
- S. Wu, X. Lan, F. Huang, Z. Luo, H. Ju, C. Meng and C. Duan, Biosens. Bioelectron., 2012, 32, 293–296 CrossRef CAS PubMed.
- F. d. A. d. S. Silva, M. G. A. da Silva, P. R. Lima, M. R. Meneghetti, L. T. Kubota and M. O. F. Goulart, Biosens. Bioelectron., 2013, 50, 202–209 CrossRef CAS PubMed.
- R. Devasenathipathy, C. Karuppiah, S.-M. Chen, V. Mani, V. Vasantha and S. Ramaraj, Microchim. Acta, 2015, 182, 727–735 CrossRef CAS.
- H. Hosseini, H. Ahmar, A. Dehghani, A. Bagheri, A. Tadjarodi and A. R. Fakhari, Biosens. Bioelectron., 2013, 42, 426–429 CrossRef CAS PubMed.
- G. Hignett, S. Threlfell, A. J. Wain, N. S. Lawrence, S. J. Wilkins, J. Davis, R. G. Compton and M. F. Cardosi, Analyst, 2001, 126, 353–357 RSC.
- X. Tu, Q. Xie, Z. Huang, X. e. Jia and M. Ye, Microchim. Acta, 2008, 162, 219–225 CrossRef CAS.
- K. Dumri and D. Hung Anh, Enzyme Res., 2014, 389739 Search PubMed.
- S. Hong, Y. S. Na, S. Choi, I. T. Song, W. Y. Kim and H. Lee, Adv. Funct. Mater., 2012, 22, 4711–4717 CrossRef CAS.
- Y. Ma, H. Niu, X. Zhang and Y. Cai, Analyst, 2011, 136, 4192–4196 RSC.
- Y.-r. Ma, H.-y. Niu, X.-l. Zhang and Y.-q. Cai, Chem. Commun., 2011, 47, 12643–12645 RSC.
- K. Yoosaf, B. I. Ipe, C. H. Suresh and K. G. Thomas, J. Phys. Chem. C, 2007, 111, 12839–12847 CAS.
- H. Luo, C. Gu, W. Zheng, F. Dai, X. Wang and Z. Zheng, RSC Adv., 2015, 5, 13470–13477 RSC.
- A.-J. Wang, Q.-C. Liao, J.-J. Feng, Z.-Z. Yan and J.-R. Chen, Electrochim. Acta, 2012, 61, 31–35 CrossRef CAS.
- J.-J. Feng, P.-P. Zhang, A.-J. Wang, Q.-C. Liao, J.-L. Xi and J.-R. Chen, New J. Chem., 2012, 36, 148–154 RSC.
- K. Szczepanowicz, J. Stefanska, R. P. Socha and P. Warszynski, Physicochem. Probl. Miner. Process., 2010, 45, 85–98 CAS.
- Y. Wang, D. Li, P. Li, W. Wang, W. Ren, S. Dong and E. Wang, J. Phys. Chem. C, 2007, 111, 16833–16839 CAS.
- R. A. Zangmeister, T. A. Morris and M. J. Tarlov, Langmuir, 2013, 29, 8619–8628 CrossRef CAS PubMed.
- H. Kong and J. Jang, Chem. Commun., 2006, 3010–3012 RSC.
- H. Wang, L. Wei, Z. Wang and S. Chen, RSC Adv., 2016, 6, 14097–14104 RSC.
- G. H. Choi, D. K. Rhee, A. R. Park, M. J. Oh, S. Hong, J. J. Richardson, J. Guo, F. Caruso and P. J. Yoo, ACS Appl. Mater. Interfaces, 2016, 8, 3250–3257 CAS.
Footnote |
| † Electronic supplementary information (ESI) available: Additional experimental information and characterization results (Fig. S1 to S7) are provided. See DOI: 10.1039/c6ra06994k |
| This journal is © The Royal Society of Chemistry 2016 |

