DOI:
10.1039/C6RA06992D
(Paper)
RSC Adv., 2016,
6, 51146-51152
Facile one-step synthesis of highly graphitized hierarchical porous carbon nanosheets with large surface area and high capacity for lithium storage†
Received
16th March 2016
, Accepted 15th May 2016
First published on 17th May 2016
Abstract
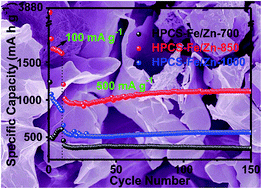
Hierarchical porous carbon nanosheets (HPCSs) were prepared from acrylic resin using FeCl3·6H2O as catalyst and ZnCl2 as activator. The as-obtained materials possess a nanosheet structure and a combination of high graphitization degree and large surface area (2109 m2 g−1). When incorporated into the anode of a Lithium Ion Battery (LIBs), the HPCSs achieve a maximum specific capacity of 1642 mA h g−1 at 100 mA g−1 and 1100 mA h g−1 at 500 mA g−1 after 150 cycles, exhibiting enormous potential in developing advanced high performance LIBs. This work offers a facile strategy for the preparation of hierarchical porous carbon materials with high performance in LIBs from resin.
Introduction
Faced with the increasingly serious energy and environment crisis, we have to develop clean energy such as solar and wind energy to reduce the emission of greenhouse gases.1,2 With respect to the utilization of clean energy, however, there still exist several challenges to meet, such as efficient energy storage and conversion.3–8 One of the endeavors to meet these challenges is popularizing rechargeable LIBs, which has been considered as the most promising energy storage system for a wide variety of applications.9–17 Nevertheless, the energy density and/or power density of current LIBs cannot meet the severe demands of many devices, such as electric vehicles (EVs).18–20 Therefore, many efforts have been devoted to the research and development of LIBs to realize a high specific capacity.21,22 Graphite used as an anode material for LIBs can easily find its application in current electronic devices, such as wristwatches, laptops and electric vehicles. However, restricted by the low theoretical charge capacity of 372 mA h g−1, the graphite-based LIBs cannot meet the requirements of heavy energy-consumption devices. Therefore, it is necessary to substitute more suitable materials for graphite, aiming at realizing a higher specific capacity for LIBs.23–25 Compared with bulk graphite, carbon nanosheets have received increasing attention due to their open structure, high active surface area and fast lithium-ion diffusion in electrode materials.18,26–30 For example, through chemical reduction of exfoliated graphite oxide sheet materials, E. Yoo et al. prepared graphene nanosheets (GNS), realizing a high capacity of 540 mA h g−1.31 When incorporating CNT and C60 into the GNS, the specific capacity was increased up to 730 mA h g−1 and 784 mA h g−1, respectively. However, the preparation of GNS involves simultaneously using concentrated sulfuric acid and potassium permanganate, which are very dangerous and time-consuming. Besides, with the copper nanoparticles occupying position, R. Song et al. obtained hierarchical porous carbon nanosheets (HPCS), which possessed a reversible capacities of 748 mA h g−1 at 20 mA g−1.32 Recently, using the Schiff-base reaction in a molten salt medium, B. He et al. manipulated high nitrogen-content carbon nanosheets, exhibiting a capacity of 605 mA h g−1 at 100 mA g−1.33 However, these materials from molten salt method also suffer from an obvious drawback of low capacity for many applications. More recently, taking advantages of renewable and environmental cornstalks, S. Wang et al. prepared carbon nanofibers/nanosheets hybrid via simple hydrothermal treatment and carbonization.34 Although this process is low-cost, green and eco-friendly, the low capacity still dissatisfies us more or less. In general, there still exist several tough problems for high performance and practical LIBs, such as the low specific capacity, complex preparation process, and/or high dangerousness.
In addition to simplifying and securing the preparation process of anode materials, enough attention should also be paid to the high conductivity and large surface area, which play significant roles in the improvement of high-performance LIBs.12,26,35,36 An efficient way to obtain high conductivity is elevating the degree of graphitization.37,38 However, high temperature thermal treatments above 2000 °C, which are usually required to increase conductivity, result in reduced surface areas limiting their applications in LIBs.39 There still exist challenges for realizing the coexistence of high graphitization degree and high specific surface area (Table S1†).
Herein, we propose a one-step activation and catalytic carbonization method for the construction of hierarchical porous carbon nanosheets in a facile, economical, and scalable way, which realizes the combination of high graphitization degree and large surface area. The practically undegradable precursor resin has been converted into the porous carbon with high surface area and high graphitization degree, simultaneously realizing the economic and ecological value.40,41 When served as anode materials for LIBs, the as-prepared materials can achieve a high specific capacity of 1642 mA h g−1, which suggests that this approach is promising for the efficient preparation of carbon materials for high performance LIBs.
Experimental
Materials
All chemicals used in this study were commercial reagents, directly used without further purification. Acrylic resin (LK31, obtained from Shandong Lukang Record Pharmaceutical Co. Ltd.) was ground (15 min) with agate mortar for subsequent use.
Preparation of HPCS–Fe/Zn-T
The preparation process of hierarchical porous carbon nanosheets is schematically shown in Fig. 1. Typically, 8.1 g Ferric chloride hexahydrate (FeCl3·6H2O) was dissolved in 10 mL 2 M hydrochloric acid, then 0.65 g LK31 resin powders and 3.0 g ZnCl2 were added into the solution of FeCl3. Then, the water in the solution was removed at 100 °C to give a yellow mixture. The mixture was put into a corundum crucible and then loaded into an electric furnace which was outgassed with a continuous nitrogen flow. After swashing with nitrogen for 10 min, the system was first ramped at 5 °C min−1 to the 450 °C and kept at this temperature for 1 hour. Finally, the system was increased to the ultimate annealing temperature (700 °C, 850 °C, 1000 °C) with a heating rate of 5 °C min−1 and kept at this temperature for 2 hours. The system was ultimately cooled to room temperature naturally. After this annealing process, we got a black solid substance, which consists mostly of carbonaceous materials and iron species. The prepared black material was immersed into 12 M concentrated hydrochloric acid for 48 hours, then washed with deionized water thoroughly and dried overnight at 60 °C in a vacuum oven. The as-obtained material was named as HPCS–Fe/Zn-T, where T represents the annealing temperature. The carbon yield of HPCS–Fe/Zn-700, HPCS–Fe/Zn-850 and HPCS–Fe/Zn-1000 are ca. 21.54, 19.85 and 14.15 wt%, respectively.
 |
| Fig. 1 Schematic representation of the fabrication process of HPCSs for lithium ion storage. | |
Characterization
Powder X-ray diffraction (XRD) data were collected on the Rigaku D/Max 2400 type X-ray spectrometer (Cu Kα, λ = 1.5406 Å). Raman measurements were performed on RENISHAW inVia Raman microscope. Scanning electron microscopy (SEM) and transmission electron microscopy (TEM) were conducted on FEI NOVA NanoSEM 450 and JEM-2000EX. High-resolution TEM (HRTEM) images were obtained on Philips Tecnai G220. FTIR spectroscopy analyses were carried out on Bruker Equinox 55 spectrometer. Specific surface area and pore size distribution were measured according to the data recorded on Micromeritics ASAP 2020 surface area and porosity analyzer at 77 K. The data of thermogravimetric analysis (TGA, Shimadzu, DRG-60) were collected in air.
Electrochemical measurements
The electrochemical performances were tested via converting the as-obtained materials into lithium ion batteries. The anode materials were manufactured through mixing HPCSs, acetylene black and polyvinylidene difluoride (PVDF) in a weight ratio of 7
:
2
:
1. After drying the anode materials at 80 °C in vacuum drying oven overnight, the LIBs were obtained by filling the CR2026 coin cells up with anode slices, diaphragms (polypropylene), Li foils and electrolyte ((1 M LiPF6 salt dissolved in ethylene carbonate)
:
(diethyl carbonate) = 1
:
1 volume ratio) in an Ar-filled glovebox with concentrations of moisture and oxygen below 0.1 ppm. Generally, the mass of active materials loaded on a single anode foil is ca. 0.5 mg. For the rate and cycle performance of the as-prepared LIBs, we conduct the galvanostatic charge/discharge tests using a LAND CT2001A electrochemical workstation at different current densities within a cut-off voltage window of 0.01–3.0 V. The specific capacity is calculated based on the mass of active material.
Results and discussion
Scanning electron microscopy was employed in the characterization of HPCS–Fe/Zn-T (Fig. S1†). Apparently, Fig. S1a† reveals an obvious sheet-like morphology of HPCS–Fe/Zn-850. HPCS–Fe-850 (obtained without using ZnCl2) reveals a similar sheet-like morphology with that of HPCS–Fe/Zn-850 (Fig. S1b†). In contrast, HPCS–Zn-850 prepared with only ZnCl2 appears to be block-like materials, which is dramatically different from the sheet-like morphology of HPCS–Fe/Zn-850 (Fig. S1c†). Therefore, it can be reasonably concluded that Fe species play a critical role in the formation of sheet-like morphology. Changing the carbonizing temperature from 700 °C to 850 °C and 1000 °C, we have systematically studied the morphology evolution of the carbon materials. When annealed at 700 °C, we can easily find that the as-prepared material was made up of both large lumps and nanosheets (Fig. 2a). When the annealing temperature was up to 850 °C, the as-obtained HPCS–Fe/Zn-850 demonstrates an obvious sheet-like morphology (Fig. 2b). However, the nanosheets tend to become thick at 1000 °C, possibly due to the aggregation of nanosheets at high temperature (Fig. 2c). A more profound insight into the microscopic morphology of these materials can be obtained from TEM image. According to Fig. 2d, HPCS–Fe/Zn-850 shows ultrathin nanosheet morphology. From the observation of HRTEM images, it can be seen that there exist large amounts of obvious diffraction fringes with the adjacent interlayer distances of ca. 0.335 nm, revealing that HPCS–Fe/Zn-850 achieves a high graphitization degree (Fig. 2e and f). The corresponding selected area electron diffraction (SAED) pattern can be assigned to the characteristic structure of carbon materials (inset of Fig. 2f). Obviously, HPCS–Fe/Zn-850 shows sheet-like morphology, high degree of graphitization and numerous potentials of being used in LIBs.
 |
| Fig. 2 SEM images of HPCS–Fe/Zn-700 (a), HPCS–Fe/Zn-850 (b) and HPCS–Fe/Zn-1000 (c); TEM images (d) and HRTEM images (e) and (f) (the inset shows the SAED image) of HPCS–Fe/Zn-850. | |
The crystal structures of HPCSs were also studied by Raman spectra and XRD analysis (Fig. 3). According to the Raman spectra, we can easily find that there exist three remarkable peaks which are respectively defined as D, G, and 2D bands (Fig. 3a). In a Raman spectrum for carbon materials, the G band centered at ca. 1587 cm−1 is a characteristic feature of the graphitic layers and corresponds to the tangential vibration of the carbon atoms, while the D band located at ca. 1353 cm−1 corresponds to disordered carbon or defective graphitic structures.42,43 Based on the intensities of D and G bands, we worked out the values of ID/IG, which are usually employed to characterize the disorder or defect of graphite crystal. Fig. 3a shows an apparent tendency that ID/IG decreases from 0.62 for HPCS–Fe/Zn-700 to 0.48 for HPCS–Fe/Zn-850 and 0.40 for HPCS–Fe/Zn-1000, evidencing that the amount of defects of HPCSs is exceedingly limited compared with the common carbonaceous materials and dramatically decreases with elevating the annealing temperature (Table S1†). Furthermore, the remarkable 2D bands which are second-order Raman spectra and viewed as the overtones of the D bands are amazing results, suggesting the high graphitization degree of HPCSs.44 Fig. 3b shows the XRD patterns of HPCS–Fe/Zn-Ts. Both HPCS–Fe/Zn-850 and HPCS–Fe/Zn-1000 exhibit apparent diffraction peaks at ca. 26° which are characteristic diffraction peaks of graphite carbon, while the one annealed at 700 °C shows a bump peak.45–47 Apparently, the 002 peaks intend to demonstrate a vertical line with the elevating of annealing temperature, realizing high graphitization degree compared with other usual carbonaceous materials.48–50 Our comparative results without using FeCl3·6H2O or ZnCl2 reveal that iron species are responsible for the enhanced graphitization degree of HPCSs, evidencing the catalytic graphitization of iron in carbonaceous materials (Fig. S2†).51 The Raman spectra, XRD analysis and HRTEM images are in good agreement with each other, convincingly evidencing the high graphitization degree of HPCS–Fe/Zn-850.
 |
| Fig. 3 Raman spectra (a), XRD patterns (b), N2 adsorption–desorption isotherms (c) and pore-size distribution curves (d) of HPCSs carbonized at different temperature. | |
As we know, high specific surface area (SSA) and big pore volume can find their superiorities in almost all the domains, ranging from catalysis to energy storage and many other applications.52–55 To examine the pore structure of the as-prepared materials, the nitrogen adsorption–desorption measurements were conducted, the isotherms and the corresponding pore size distribution curves were shown in Fig. 3. For all of the samples annealed at different temperatures from 700 °C to 1000 °C, there are three obvious hysteresis loops and the isotherms appear to be type IV, according to IUPAC classification, suggesting the existence of mesopores in these materials (Fig. 3c).56 According to FTIR spectrum, the absorption peaks at ca. 3070 cm−1, 2940 cm−1, 2850 cm−1 and 1640 cm−1 of precursor resin, assigned to phenyl, methyl, methylene and carbonyl respectively, were remarkably eliminated after annealing at 850 °C (Fig. S3†). The removal of these functional groups at high temperature leads to the formation of abundant micropores in HPCS–Fe/Zn-850. Fig. 3d exhibits the corresponding pore size distribution curves of the various materials obtained using the DFT method. Focusing on the curves between 2 nm and 50 nm, the prominent wide and strong peaks indicate mesopore structures. With respect to the regions less than 2 nm, all of the as-obtained materials have similar and remarkable peaks, suggesting the existence of micropore structures in these materials, which is in agreement with the FTIR spectrum. In general, we can apparently draw a conclusion that all of these three samples are hierarchical porous materials with the existence of mesopores and micropores. Table 1 list the detailed statistic message based on the nitrogen adsorption–desorption measurements. HPCS–Fe/Zn-850 owns the highest SSA (2109 m2 g−1) compared with 1815 m2 g−1 for HPCS–Fe/Zn-700 and 1461 m2 g−1 for HPCS–Fe/Zn-1000. The low SSA of HPCS–Fe/Zn-1000 can be reasonably attributed to an exorbitant carbonizing temperature causing the collapse of pores and leading to the decrease of SSA respectively, while 700 °C is too low for thoroughly activating these materials. However, the SSA of HPCS–Fe-850 without using ZnCl2 is only 1014.9 m2 g−1, much lower than that of HPCS–Fe/Zn-850, evidencing the activation from ZnCl2 in the formation of porous structure (Fig. S4†). Furthermore, the hysteresis loop of HPCS–Zn-850 is more apparent compared to HPCS–Fe-850, implying the enhancement of mesopores in the presence of ZnCl2. The low SSA of HPCS–Zn-850 indirectly demonstrates the synergetic effect of Zn and Fe in the activation of porous nanosheets. Accordingly, the pore structures of hierarchical porous carbonaceous material can be tuned via adjusting the annealing temperature.
Table 1 The elemental analysis, SSA and pore volume of carbon materials
Sample |
Element analysis (%) |
BET SSA |
Pore volume |
C |
H |
N |
(m2 g−1) |
(cm3 g−1) |
HPCS–Fe/Zn-700 |
59.7 |
4.3 |
4.2 |
1815.4 |
1.5 |
HPCS–Fe/Zn-850 |
77.2 |
1.6 |
1.2 |
2109.7 |
1.9 |
HPCS–Fe/Zn-1000 |
81.2 |
1.8 |
1.3 |
1461.3 |
2.1 |
The as-prepared materials are used as anode materials in LIBs to test their electrochemical performance. Fig. 4a and S5† show the typical discharge/charge voltage profiles of the HPCSs at the current density of 100 mA g−1 within a cut-off window of 0.01–3.0 V in the 1st, 2nd, 5th, and 10th cycles. All of these three samples show apparent decay between the 2nd cycle and the 1st cycle in specific capacity, which are attributed to the formation of solid electrolyte interface (SEI) film on the large surfaces of these materials. With varying the annealing temperature, the reversible specific capacity obtained from the second cycle on increases from 605 mA h g−1 at 700 °C to 1642 mA h g−1 at 850 °C and then decreases to 854 mA h g−1 at 1000 °C. HPCS–Fe/Zn-850 achieves the highest specific capacity among these three materials due to its ideal incorporation of high graphitization degree and large SSA. From the cyclic voltammograms, one can easily find that the reversibility of HPCS–Fe/Zn-850 is established from the second cycle on (Fig. S6a†). The electrochemical impedance spectroscopy (EIS) show that HPCS–Fe/Zn-850 is more efficient in electron or electrolyte ion transport compared with other samples, predicting excellent electrochemical performance (Fig. 4b).
 |
| Fig. 4 (a) Discharge/charge profiles of HPCS–Fe/Zn-850; (b) Nyquist plots and their expanded high-frequency regions, (c) cycling performance at the current densities of 100 mA g−1 and 500 mA g−1 and (d) rate capability tested at various current densities ranging from 200 mA g−1 to 3000 mA g−1 of HPCSs; (e) cycling performance tested at a current density of 2000 mA g−1 of HPCS–Fe/Zn-850. | |
The electrochemical data at 100 mA g−1 in the first ten cycles is similar to the one obtained from the typical discharge/charge voltage profiles. Changing the current density from 100 mA g−1 to 500 mA g−1, HPCS–Fe/Zn-850 still exhibits a high specific capacity of 1100 mA h g−1 after 150 cycles compared with 361 mA h g−1 for HPCS–Fe/Zn-700 and 578 mA h g−1 for HPCS–Fe/Zn-1000, which is excellent in carbonaceous materials without intentionally heterogeneously doping (such as nitrogen) (Fig. 4c). When cycled at high current densities of 200–3000 mA g−1, large specific capacities of 300–950 mA h g−1 can still be maintained for HPCS–Fe/Zn-850 while HPCS–Fe/Zn-700 and HPCS–Fe/Zn-1000 possess relatively lower capacity (Fig. 4d). After deeply cycled at 3000 mA g−1, a stable high specific capacity could be largely restored for repeated cycles when abruptly switching the current density back to 200 mA g−1, indicating the excellent robustness and stability of the HPCS–Fe/Zn-850. When tested at 2000 mA g−1 to get an idea about the long cycling performance at high current density, HPCS–Fe/Zn-850 achieves an excellent capacity of ca. 370 mA h g−1 after 300 cycles (Fig. 4e). As shown in Fig. S6b,† the EIS results of HPCS–Fe/Zn-850 anode after 5, 10 and 20 cycles respectively show good consistency, implying the excellent electrochemical stability of this material. Furthermore, the SEM and TEM images of HPCS–Fe/Zn-850 anode material after cycles demonstrate the unbroken carbon nanosheets, evidencing the structure stability of the as-obtained carbon nanosheets (Fig. S7†). According to the thermal gravimetric analysis (TGA), residues account ca. 3% of the initial mass, indicating the low content of iron species in HPCS–Fe/Zn-850 and the high efficiency of concentrated hydrochloric acid washing process (Fig. S8†). In consideration of the structure and composition features of the materials evidenced via Raman, XRD, EIS, TGA, elemental analysis and nitrogen adsorption–desorption isotherms, the superior performance of HPCS–Fe/Zn-850 is attributed to the combination of high graphitization degree and large surface area (2019 m2 g−1), as well as the suitable pore structure. The high graphitization degree provides excellent conductivity. Large amounts of nanopores may act as reservoirs for the storage of Li+ and the large surface area leads to sufficient electrode/electrolyte interface to absorb Li+.22,24,57,58
Conclusions
In summary, high SSA and large pore volume hierarchical porous carbon nanosheets have been successfully prepared with a facile, economical and scalable way from resin. The as-prepared materials (HPCS–Fe/Zn-850) exhibit an ideal combination of high graphitization degree and high surface area. When used as an anode material for LIBs, the carbon nanosheets achieve a specific capacity of 1642 mA h g−1 at 100 mA g−1 and 1100 mA h g−1 at 500 mA g−1 after 150 cycles, which exhibits tremendous superiority against the conventional graphite-based ones. The advantages such as high specific capacity and low cost suggest that there exist numerous promises in enlarging our methodology to practical application.
Acknowledgements
This work was supported by the Natural Science Foundation of China (No. 51072028).
Notes and references
- S. Yuan, X.-L. Huang, D.-L. Ma, H.-G. Wang, F.-Z. Meng and X.-B. Zhang, Adv. Mater., 2014, 26, 2273–2279 CrossRef CAS PubMed.
- W. Li, M. Li, M. Wang, L. Zeng and Y. Yu, Nano Energy, 2015, 13, 693–701 CrossRef CAS.
- Y. G. Guo, J. S. Hu and L. J. Wan, Adv. Mater., 2008, 20, 2878–2887 CrossRef CAS.
- V. Palomares, P. Serras, I. Villaluenga, K. B. Hueso, J. Carretero-Gonzalez and T. Rojo, Energy Environ. Sci., 2012, 5, 5884–5901 CAS.
- L. Li, Z. Wu, S. Yuan and X.-B. Zhang, Energy Environ. Sci., 2014, 7, 2101–2122 CAS.
- N. Mahmood, C. Zhang, H. Yin and Y. Hou, J. Mater. Chem. A, 2014, 2, 15–32 CAS.
- S. Yuan, Y.-B. Liu, D. Xu, D.-L. Ma, S. Wang, X.-H. Yang, Z.-Y. Cao and X.-B. Zhang, Adv. Sci., 2015, 2, 1400018 Search PubMed.
- X.-L. Huang, R.-Z. Wang, D. Xu, Z.-L. Wang, H. G. Wang, J. J. Xu, Z. Wu, Q. C. Liu, Y. Zhang and X. B. Zhang, Adv. Funct. Mater., 2013, 23, 4345–4353 CrossRef CAS.
- K. Saravanan, P. Balaya, M. V. Reddy, B. V. R. Chowdari and J. J. Vittal, Energy Environ. Sci., 2010, 3, 457–463 CAS.
- L. Ji, Z. Lin, M. Alcoutlabi and X. Zhang, Energy Environ. Sci., 2011, 4, 2682–2699 CAS.
- T. H. Hwang, Y. M. Lee, B.-S. Kong, J.-S. Seo and J. W. Choi, Nano Lett., 2012, 12, 802–807 CrossRef CAS PubMed.
- Z. Wang, D. Luan, S. Madhavi, Y. Hu and X. W. Lou, Energy Environ. Sci., 2012, 5, 5252–5256 CAS.
- R. Zhang, Y. He, A. Li and L. Xu, Nanoscale, 2014, 6, 14221–14226 RSC.
- H. Jiang, Y. Hu, S. Guo, C. Yan, P. S. Lee and C. Li, ACS Nano, 2014, 8, 6038–6046 CrossRef CAS PubMed.
- B. Wang, W. Al Abdulla, D. Wang and X. S. Zhao, Energy Environ. Sci., 2015, 8, 869–875 CAS.
- Y. Huang, X.-L. Huang, J.-S. Lian, D. Xu, L. M. Wang and X. B. Zhang, J. Mater. Chem., 2012, 22, 2844–2847 RSC.
- Y. Dong, Z. Zhao, Z. Wang, Y. Liu, X. Wang and J. Qiu, ACS Appl. Mater. Interfaces, 2015, 7, 2444–2451 CAS.
- K.-X. Wang, X.-H. Li and J.-S. Chen, Adv. Mater., 2015, 27, 527–545 CrossRef CAS PubMed.
- B. Dunn, H. Kamath and J.-M. Tarascon, Science, 2011, 334, 928–935 CrossRef CAS PubMed.
- Z. Wang, Y. Dong, H. Li, Z. Zhao, H. Bin Wu, C. Hao, S. Liu, J. Qiu and X. W. Lou, Nat. Commun., 2014, 5, 5002–5009 CrossRef CAS PubMed.
- R. Raccichini, A. Varzi, S. Passerini and B. Scrosati, Nat. Mater., 2015, 14, 271–279 CrossRef CAS PubMed.
- N. A. Kaskhedikar and J. Maier, Adv. Mater., 2009, 21, 2664–2680 CrossRef CAS.
- R. Fong, U. von Sacken and J. R. Dahn, J. Electrochem. Soc., 1990, 137, 2009–2013 CrossRef CAS.
- M. Winter, J. O. Besenhard, M. E. Spahr and P. Novák, Adv. Mater., 1998, 10, 725–763 CrossRef CAS.
- Y. Hou, J. Li, Z. Wen, S. Cui, C. Yuan and J. Chen, Nano Energy, 2015, 12, 1–8 CrossRef CAS.
- X. Zheng, J. Luo, W. Lv, D.-W. Wang and Q.-H. Yang, Adv. Mater., 2015, 27, 5388–5395 CrossRef CAS PubMed.
- P. Simon and Y. Gogotsi, Nat. Mater., 2008, 7, 845–854 CrossRef CAS PubMed.
- J. Xu, Q. Gao, Y. Zhang, Y. Tan, W. Tian, L. Zhu and L. Jiang, Sci. Rep., 2014, 4, 5545–5550 CAS.
- H. G. Wang, Z. Wu, F. L. Meng, D. L. Ma, X. L. Huang, L. M. Wang and X. B. Zhang, ChemSusChem, 2013, 6, 56–60 CrossRef PubMed.
- Z. L. Wang, D. Xu, Y. Huang, Z. Wu, L. M. Wang and X. B. Zhang, Chem. Commun., 2012, 48, 976–978 RSC.
- E. Yoo, J. Kim, E. Hosono, H.-S. Zhou, T. Kudo and I. Honma, Nano Lett., 2008, 8, 2277–2282 CrossRef CAS PubMed.
- R. Song, H. Song, J. Zhou, X. Chen, B. Wu and H. Y. Yang, J. Mater. Chem., 2012, 22, 12369–12374 RSC.
- B. He, W.-C. Li and A.-H. Lu, J. Mater. Chem. A, 2015, 3, 579–585 CAS.
- S. Wang, C. Xiao, Y. Xing, H. Xu and S. Zhang, J. Mater. Chem. A, 2015, 3, 6742–6746 CAS.
- H. Ji, X. Liu, Z. Liu, B. Yan, L. Chen, Y. Xie, C. Liu, W. Hou and G. Yang, Adv. Funct. Mater., 2015, 25, 1886–1894 CrossRef CAS.
- Z.-L. Wang, D. Xu, H.-G. Wang, Z. Wu and X.-B. Zhang, ACS Nano, 2013, 7, 2422–2430 CrossRef CAS PubMed.
- M. Terrones, N. Grobert, J. Olivares, J. P. Zhang, H. Terrones, K. Kordatos, W. K. Hsu, J. P. Hare, P. D. Townsend, K. Prassides, A. K. Cheetham, H. W. Kroto and D. R. M. Walton, Nature, 1997, 388, 52–55 CrossRef CAS.
- M. Sevilla and A. B. Fuertes, Carbon, 2006, 44, 468–474 CrossRef CAS.
- P. F. Fulvio, R. T. Mayes, X. Wang, S. M. Mahurin, J. C. Bauer, V. Presser, J. McDonough, Y. Gogotsi and S. Dai, Adv. Funct. Mater., 2011, 21, 2208–2215 CrossRef CAS.
- C. Long, J. Lu, A. Li, D. Hu, F. Liu and Q. Zhang, J. Hazard. Mater., 2008, 150, 656–661 CrossRef CAS PubMed.
- K. Bratek, W. Bratek and M. Kułażyński, Carbon, 2002, 40, 2213–2220 CrossRef CAS.
- E. M. Lotfabad, J. Ding, K. Cui, A. Kohandehghan, W. P. Kalisvaart, M. Hazelton and D. Mitlin, ACS Nano, 2014, 8, 7115–7129 CrossRef CAS PubMed.
- Y. Dong, S. Liu, Z. Wang, Y. Liu, Z. Zhao and J. Qiu, RSC Adv., 2015, 5, 8929–8932 RSC.
- O. Frank, M. Mohr, J. Maultzsch, C. Thomsen, I. Riaz, R. Jalil, K. S. Novoselov, G. Tsoukleri, J. Parthenios, K. Papagelis, L. Kavan and C. Galiotis, ACS Nano, 2011, 5, 2231–2239 CrossRef CAS PubMed.
- H. Hu, Z. Zhao, W. Wan, Y. Gogotsi and J. Qiu, Adv. Mater., 2013, 25, 2219–2223 CrossRef CAS PubMed.
- Y. Liu, X. Wang, Y. Dong, Z. Wang, Z. Zhao and J. Qiu, J. Mater. Chem. A, 2014, 2, 16832–16835 CAS.
- S. Liu, Z. Wang, C. Yu, H. B. Wu, G. Wang, Q. Dong, J. Qiu, A. Eychmüller and X. W. Lou, Adv. Mater., 2013, 25, 3462–3467 CrossRef CAS PubMed.
- E. P. Sajitha, V. Prasad, S. V. Subramanyam, S. Eto, K. Takai and T. Enoki, Carbon, 2004, 42, 2815–2820 CrossRef CAS.
- L. Zhang, Z. Su, F. Jiang, L. Yang, J. Qian, Y. Zhou, W. Li and M. Hong, Nanoscale, 2014, 6, 6590–6602 RSC.
- Y. Li, Z. Li and P. K. Shen, Adv. Mater., 2013, 25, 2474–2480 CrossRef CAS PubMed.
- S. Xu, F. Zhang, Q. Kang, S. Liu and Q. Cai, Carbon, 2009, 47, 3233–3237 CrossRef CAS.
- M. Pumera, Energy Environ. Sci., 2011, 4, 668–674 CAS.
- E. Frackowiak and F. Béguin, Carbon, 2002, 40, 1775–1787 CrossRef CAS.
- H. Sehaqui, Q. Zhou, O. Ikkala and L. A. Berglund, Biomacromolecules, 2011, 12, 3638–3644 CrossRef CAS PubMed.
- M. Wu, Q. Zha, J. Qiu, Y. Guo, H. Shang and A. Yuan, Carbon, 2004, 42, 205–210 CrossRef CAS.
- Z. Ling, G. Wang, Q. Dong, B. Qian, M. Zhang, C. Li and J. Qiu, J. Mater. Chem. A, 2014, 2, 14329–14333 CAS.
- L. Qie, W. M. Chen, Z. H. Wang, Q. G. Shao, X. Li, L. X. Yuan, X. L. Hu, W. X. Zhang and Y. H. Huang, Adv. Mater., 2012, 24, 2047–2050 CrossRef PubMed.
- T. Chen, L. Pan, T. A. J. Loh, D. H. C. Chua, Y. Yao, Q. Chen, D. Li, W. Qin and Z. Sun, Dalton Trans., 2014, 43, 14931–14935 RSC.
Footnote |
† Electronic supplementary information (ESI) available. See DOI: 10.1039/c6ra06992d |
|
This journal is © The Royal Society of Chemistry 2016 |
Click here to see how this site uses Cookies. View our privacy policy here.