Mohamed Karmaoui*ab,
E. Venkata Ramanac,
David M. Tobaldia,
Luc Lajaunied,
Manuel P. Graçac,
Raul Arenalde,
Maria P. Seabraa,
João A. Labrinchaa and
Robert C. Pullar*a
aDepartment of Materials and Ceramic Engineering, CICECO – Aveiro Institute of Materials, University of Aveiro, Campus Universitário de Santiago, 3810-193 Aveiro, Portugal. E-mail: rpullar@ua.pt; karmaoui@ua.pt; Tel: +351 234 370 041
bSchool of Chemistry, College of Engineering and Physical Sciences, University of Birmingham, Edgbaston, Birmingham, B15 2TT, UK. E-mail: m.karmaoui@bham.ac.uk; Tel: +44 (0)121 414 8672
cI3N-Aveiro, Department of Physics, University of Aveiro, Campus Universitário de Santiago, 3810-193 Aveiro, Portugal
dLaboratorio de Microscopías Avanzadas, Instituto de Nanociencia de Aragón, Universidad de Zaragoza, 50018 Zaragoza, Spain
eARAID Foundation, 50018 Zaragoza, Spain
First published on 5th May 2016
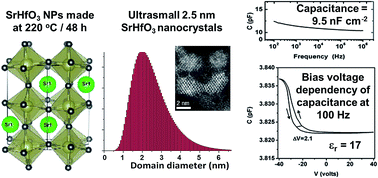
Strontium hafnium oxide (SrHfO3) has great potential as a high-k gate dielectric material, for use in memories, capacitors, CMOS and MOSFETs. We report for the first time the dielectric properties (relative permittivity and capacitance) of SrHfO3 nanoparticles (NPs), as opposed to thin films or sintered bulk ceramics. These monodisperse, ultra-small, perovskite-type SrHfO3 nanocrystals were synthesised through a non-aqueous sol–gel process under solvothermal conditions (at only 220 °C) using benzyl alcohol as a solvent, and with no other capping agents or surfactants. Advanced X-ray diffraction methods (whole powder pattern modelling, WPPM), CS-corrected high-resolution scanning transmission electron microscopy (HRSTEM), dielectric spectroscopy, and optical (UV-vis, Raman) and photoluminescent spectroscopy were used to fully characterise the NPs. These SrHfO3 NPs are the smallest reported and highly monodisperse, with a mean diameter of 2.5 nm, a mode of 2.0 nm and a small size distribution. The formation mechanism of the NPs was determined using NMR and GC-MS analysis of the species involved. Our SrHfO3 nanoparticles had a dielectric constant of 17, which is on par with literature data for bulk and thin film samples, and they also had a relatively large capacitance of 9.5 nF cm−2. As such, they would be suitable for applications as gate dielectrics for capacitors and in metal-oxide semiconductor field-effect transistor (MOSFET) technology.
Alkaline earth hafniates have great potential as near-zero τf microwave dielectric ceramics,14 and in particular SrHfO3 is a very promising candidate for the next generation of capacitors, complementary metal-oxide–semiconductor (CMOS)10 and metal-oxide–semiconductor-field-effect-transistor (MOSFET) devices,15 due to its outstanding physical and electrical properties. It possesses a dielectric constant (k) of 21, a semiconductor band gap (Eg) of 6.1 eV, and a lower gate leakage current, superior to that of STO (Eg = 3.4 eV).16 Thin films of SrHfO3 were found to be good materials with equivalent oxide thickness (EOT) < 1 nm and reasonable channel mobility. In n-type field effect transistors (n-FETs) fabricated from SrHfO3, Rossel et al.17 observed an increase in channel mobility with post processing annealing at 150 °C. However, thin films of SrHfO3 have been seen to have lowered photoconductivity thresholds of 4.5–5.7 eV, suggesting they are separating into HfO2 and SrO oxides.18 van Loef et al. reported that Ce-doped SrHfO3 ceramics yielded greater enhancement in radio luminescence, with values four orders of magnitude greater when compared to conventional materials used in scintillator applications.
Apart from these applications, SrHfO3 also shows different temperature-dependent phase transitions at high temperatures. From room temperature (300 K) to 673 K, SrHfO3 displays the orthorhombic (Pbnm) form. It transforms to another orthorhombic phase, (Cmcm), somewhere in the range 673–873 K, consisting entirely of the orthorhombic (Cmcm) form at 873 K. At 1023 K, SrHfO3 is transformed in to the tetragonal (I4/mcm) which remains stable up to 1353 K, and this has transformed into the cubic (Pm3m) phase at 1403 K, an undistorted cubic perovskite structure.16 High temperature Raman studies have shown that the 1023 K phase transition is displacive, with no disorder involved, and nearly second-order, which could affect the subsequent electrical properties of annealed SrHfO3 thin films.19 These phases are not stable upon cooling, and revert to their previous structures, yielding the (Pbnm) phase when cooled down to room temperature again. A ferroelectric soft mode has been observed by means of Raman spectroscopy,19 and SrHfO3 also has interesting optical properties.19,20
Various processing routes have been developed for the synthesis and characterisation of different perovskite-type NPs, such as coprecipitation,20,21 the citrate process,22 sol–gel chemistry,23 solid state methods,24 hydrothermal synthesis25 and solvothermal processing.26
However, there has been very little work on the synthesis of SrHfO3 NPs, partly because of the high temperature required. SrHfO3 requires prolonged calcination at 1100–1200 °C for several hours,27 often along with inter-mediate grinding28 to form in solid-state reactions, with large consequential grain growth, and requires even higher temperatures of 1600–1750 °C to be sintered.29 Even in thin film form, it needs to be annealed at 650–800 °C to become crystalline.15 Pure and doped SrHfO3 NPs have been formed by combustion synthesis, and Ce-doped SrHfO3 has been made by sol–gel synthesis for possible use in laser and scintillator applications, but even though these required lower temperatures in some cases, the smallest NPs produced were still 40 nm.29 10–20 nm SrHfO3 NPs were made by a complex process using hafnium metallocenes and strontium alkoxides, but a synthesis temperature of 800 °C was still required.30
Hydrothermal and solvothermal methods are particularly useful for producing perovskite NPs at lower temperatures, and they can be applied to synthesise broad classes of NPs, while controlling particle size and morphology. Large (100 nm to 1 μm) hollow cuboids of SrHfO3 have been produced from hydrothermal synthesis at 200 °C, and their photoluminescent spectra investigated.31 However, one of the main challenges for researchers is the development of reliable methodologies to produce smaller size ranges of perovskite NPs, while keeping precise control over their composition, structural/crystal phase and shape, usually using non-aqueous sol–gel routes and water-free systems.
Such non-aqueous approaches have been developed by Karmaoui et al., among others,32,33 to produce a large variety of NPs including alkaline-earth/transition aluminates,32,34 various metal oxides35 and hybrid materials.36,37 The method reported here, known as the “benzyl alcohol route”, was first used to produce SrHfO3 NPs in 2012 at a temperature of 300 °C.38 However, the synthesis route differs in terms of precursor and temperature used, and the formation mechanism was not investigated, as this paper focussed mainly on the photoluminescent characterisation of the SrHfO3 NPs, and did not include any Raman or dielectric measurements. Subsequent to his work on the synthesis of these NPs from a benzyl alcohol route (acknowledged in ref. 38), M. Karmaoui has continued to optimize the process.
This paper details the benzyl alcohol route synthesis of perovskite-type SrHfO3 nanomaterials at very low temperatures of 220 °C, much less than those of the other synthesis routes discussed above. Furthermore, this produced ultra-small nanocrystals of perovskite-type SrHfO3, the smallest NPs ever reported for this material. The NPs reported had a very small average diameter of 2.5 nm, a narrow log-normal size distribution, and an improved spherical shape, in comparison with other methods reported in the literature. For the first time the mechanism of formation of these SrHfO3 NPs from the benzyl alcohol route was investigated, using NMR and GC-MS. This is also the first time the dielectric properties of SrHfO3 NPs (as opposed to thin films or sintered ceramics) have been measured, an important feature, as previous studies of SrHfO3 NPs have focused only on their luminescent, and not dielectric, properties.
The synthesis was carried out in a glovebox (O2 and H2O < 1 ppm). In a typical synthesis of the strontium hafnium oxide nanocrystals, one mmol of metallic strontium (0.0876 g) was dissolved in 20 mL of anhydrous benzyl alcohol. Once the solution became clear/dissolved (stirring at around 60 °C; 2 hours was needed to dissolve the metallic strontium), 1 mmol of hafnium isopropoxide (0.41484 g) was added. The reaction mixture was transferred into a stainless steel autoclave, and carefully sealed to maintain anaerobic conditions. The autoclave was taken out of the glove-box, and heated in a furnace at 220 °C for 48 hours. The resulting milky suspensions were centrifuged, and the precipitates were thoroughly washed with ethanol, then dichloromethane, and then dried in air at 60 °C.
To uncover the formation mechanism, the reaction solution (supernatant) obtained by the centrifugation of the solid material was subjected to nuclear magnetic resonance (NMR) spectroscopy analysis. NMR was performed on a Bruker instrument at 300 MHz using CDCl3 as the solvent. The sample was also analysed by gas chromatography-mass spectrometry (GC-MS) on a Trace Gas Chromatograph 2000 Series, equipped with a Thermo Scientific DSQ II single-quadrupole mass spectrometer (electron impact energy: 70 eV; collection rate: 1 scan s−1; ion source temperature: 250 °C; m/z range: 33–700) and a DB-1 J&W capillary column (30 m × 0.32 mm inner diameter, 0.25 μm film thickness), using helium as carrier gas. The chromatographic conditions were as follows: initial temperature, 50 °C for 1 min; temperature gradient, 20 °C min−1; final temperature, 250 °C; injector temperature, 270 °C; transfer-line temperature, 290 °C; split ratio, 1:
33.
X-ray powder diffraction (XRPD) data were collected using a laboratory θ/2θ diffractometer (PANalytical X'Pert Pro), equipped with a fast RTMS detector (PANalytical PIXcel 1D), with Cu Kα radiation (generated at 45 kV and 40 mA, 15–115° 2θ range, a virtual step scan of 0.02° 2θ and virtual time per step of 500 s). The incident beam pathway was as follows: 0.125° divergence slit, 0.125° anti-scattering slit, 0.04 rad soller slits, and a 15 mm copper mask. The pathway of the diffracted beam included a Ni filter, soller slits (0.04 rad), and an antiscatter blade (5 mm). The crystal structural refinement, as well as a quantitative phase analysis (QPA) of the SrHfO3 – taking solely into account the crystalline phases present in the sample – was assessed via the Rietveld method as implemented in the GSAS-EXPGUI software package.39 SrHfO3, depending on the temperature, is reported to undergo various structural transitions, but at room temperature, and consistent with Raman spectroscopic analyses, it crystallises in the orthorhombic Pbnm type perovskite structure.40 The starting atomic parameters for SrHfO3, described in the space group (SG) Pbnm, were taken from Kennedy et al.,16 and41 those of metallic Sr (SG Im3m) from a work by McWhan and Jayaraman.42 The instrumental contribution was obtained by refining the NIST SRM 660b standard (LaB6). The following parameters were then refined: scale-factors, zero-point, 6 coefficients of the shifted Chebyshev function to fit the background, unit cell parameters, profile coefficients (one θ independent Gaussian term, Gw, and two Lorentzian terms, LX and LY), atomic positions, and isotropic displacement parameters (Uiso) – after the first refinement cycles, Uiso values were constrained, so as to avoid negative values, that are physically meaningless, but are often obtained handling data of materials with limited coherence, i.e. nanocrystals.
The microstructural refinement was assessed on the same XRPD data, via the whole powder pattern modelling (WPPM) procedure, that allows for refinement of model parameters via a non-linear least squares procedure;43,44 such modelling was assessed by the PM2K software.45
WPPM is a state-of-the-art methodology that enables us to extract microstructural information from a diffraction pattern. In this way, the experimental peaks are fitted without any use of arbitrary analytical functions (like Gaussian, Lorentzian, or Voigtian functions), the diffraction peak profile being the result of a convolution of instrumental and sample-related physical effects. Consequently, the analysis is directly made in terms of physical models of microstructure and/or lattice defects. Hence, with the WPPM formalism, aspects of SrHfO3 microstructure, such as the crystalline domain shape and size distribution, can be reliably studied, with much greater accuracy than possible with the integral breadth methods that are frequently used for line profile analysis (LPA), such as the routinely applied Scherrer formula,46 or the Williamson–Hall method.47 In these latter methods,40,47 effects of the instrumental profile component, background and peak profile overlapping can make it very difficult to correctly extract integral breadths. Furthermore, additional sources of line broadening – i.e. domain size, lattice strain and layer faulting – cannot be considered properly.48 Hence, it has to be stressed that the WPPM formalism is beyond Rietveld, and unlike the Rietveld method, it uses physical models of the microstructure to generate a theoretical expression of the line profiles – thus physically sound models for the microstructure are directly refined on the experimental data to provide self-consistent results. Fundamentally, WPPM technique describes each observed peak profile as a convolution of instrumental and sample-related physical effects, thus refining the corresponding model parameters directly on the observed data.49,50
The instrumental contribution was obtained by modelling (using the same software) 14 hkl reflections from the NIST SRM 660b standard (LaB6), according to the Caglioti et al. relationship.51 Afterward, SrHfO3 (SG Pbnm) and Sr (SG Im3m) were included in the WPPM modelling, and the following parameters were refined: background (modelled using a 6th-order of the shifted Chebyshev polynomial function) peak intensities, lattice parameters, and specimen displacement. Crystalline domains were assumed to be spherical, and distributed according to a lognormal size distribution.
High-resolution scanning transmission electron microscopy (HRSTEM) experiments have been performed using a FEI Titan Low-Base microscope operated at 300 kV and equipped with a CESCOR Cs probe corrector, an ultra-bright X-FEG electron source and a monochromator. HRSTEM imaging was performed by using high-angle annular dark field (HAADF) detector; the inner and outer angles for most of the micrographs recorded were 48 and 200 mrad, respectively. Samples for HRSTEM investigations were prepared by dispersing the NPs in ethanol and evaporating the drops of the suspension on carbon-coated copper grids.
Diffuse reflectance spectroscopy (DRS) was used to assess the optical Eg of the NPs. Spectra were acquired in reflectance mode on a Jasco V-560 spectrometer, in the UV-Vis range (220–850 nm), with 0.5 nm step-size, using an integrating sphere and a white reference material, made of MgO. Optical band gap (Eg) of the material was obtained using the Tauc plot.52,53 Literature data are contrasting regarding the type of SrHfO3 transition: some authors report it to be directly allowed,54 others that it is an indirectly allowed transition.55 Hence, in this work, both cases were considered. Raman spectra were measured at room temperature using a micro-Raman spectrometer (Horiba Jobin Vyon) with a 633 nm excitation laser, an edge filter for Rayleigh line rejection, and a CCD detector. The laser was focused on the sample to a spot size of ∼2 μm using a 50× objective lens.
Dielectric measurements were carried out in the frequency range 100 Hz to 1 MHz at room temperature using an impedance analyser (Agilent 4294A). For this purpose, nanoparticles were pressed into a cylindrical pellet under hydrostatic pressure of 1 MPa. Capacitance was measured as a function of frequency and bias voltage, using a specially designed sample holder, placing the sample between platinum plates.
The photoluminescence spectra of as-synthesised SrHfO3 NPs were recorded at room temperature with a modular double grating excitation spectrofluorimeter with a TRIAX 320 emission monochromator (Fluorolog-3, Horiba Scientific) coupled to a R928 Hamamatsu photomultiplier, using a front face acquisition mode. The excitation source was a 450 W Xe arc lamp. The emission spectra were corrected for detection and optical spectral response of the spectrofluorimeter, and the excitation spectra were corrected for the spectral distribution of the lamp intensity using a photodiode reference detector.
Significant amounts of several organic molecules resulting from the synthesis were detected, including dichloromethane, hexane, toluene, benzaldehyde, benzyl alcohol, 4-phenyl-2-butanol, 4-phenyl-2-butanone, 1,5-diphenyl-3-pentanol, 1,5-diphenyl-3-pentanone and benzyl ether, as well as other organic species in insignificant quantities (see more detail in Table 1, ESI†). Characteristic compounds identified with both NMR and GC-MS analyses were found to be in outstanding accordance with reference spectra in the integrated spectral data base system for organic compounds. The knowledge gained from the identification of these organic species now permits to us to propose a reaction mechanism. We know that the non-aqueous sol–gel synthesis of SrHfO3 nanocrystals is based on two consecutive steps which involve:
(a) The reaction of metallic strontium with benzyl alcohol to produce an alkoxide, with the release of hydrogen;56
(b) The reaction between the strontium benzyl alcoholate (alkoxide, formed upon dissolution of metallic strontium) and hafnium isopropoxide precursor results in the formation of multi metal oxide SrHfO3 nanoparticles as proposed in Scheme 1.
![]() | ||
Scheme 1 Proposed reaction mechanism occurring during the non-aqueous synthesis of SrHfO3 metal oxide nanoparticles in benzyl alcohol. |
QPA data and Rietveld agreement factors are reported in Table 1. A graphical output of the Rietveld crystal structural refinement is depicted in Fig. 1. The crystal structural data, as well as a 3D rendering of its crystal structure obtained with the VESTA software package,57 inserting the structural data (bond lengths, bond angles, atomic positions and Uiso) obtained from GSAS, and reported in Table 1, are both shown in the inset of Fig. 1.
Atom | Site | Atomic position | Uiso (Å2 × 100) | ||
---|---|---|---|---|---|
x | y | z | |||
a There were 7233 observations; the number of SrHfO3 reflections in the data set was 402. | |||||
Sr | 4c | 0.5300(1) | 0.5412(1) | 1/4 | 0.8(1) |
Hf | 4a | 0 | 1/2 | 0 | 0.5(1) |
O1 | 4c | 0.4748(7) | −0.0161(8) | 1/4 | 0.8(1) |
O2 | 8d | 0.7368(4) | 0.2855(5) | 0.0371(4) | 0.6(1) |
As can be seen in Table 2, the sample was composed of 98.7 wt% SrHfO3, with a small amount (1.3 wt%) remaining of the metallic Sr precursor, presumably as a result of incomplete dissolution in the benzyl alcohol.
No. of variables | Agreement factors | Crystalline phase composition (wt%) | |||
---|---|---|---|---|---|
R(F2) (%) | Rwp (%) | χ2 | SrHfO3 | Sr | |
14 | 3.23 | 2.87 | 5.55 | 98.6(1) | 1.4(1) |
Structural parameters (atomic positions) calculated via the Rietveld refinement are in good agreement with those experimentally calculated through the SPuDS software58. However, despite the good consistency of the obtained data, it is worth noting that, because of the very limited coherence in nanocrystals, complications may arise when investigating NPs, as the integrated intensities of the Bragg peaks can be determined only with large uncertainty because of the extremely broad profile. Hence, data in Table 1 are intended to be only relative. As a matter of fact, a local probe, as the pair distribution function (PDF), would be here necessary, aiming at highlighting the local differences, compared to the average structure that is obtainable from conventional crystallography.59
The size distributions were provided by an advanced X-ray powder diffraction (XRPD) technique, namely the whole powder pattern modelling (WPPM) method. The graphical output of the WPPM modelling of the as synthesised SrHfO3 sample is shown in Fig. 2 together with the crystalline domain size distribution.
The agreement factors and the microstructural data of WPPM modelling are reported in Table 2 of the ESI.† From this advanced XRPD analysis, the average crystalline domain diameter of as-prepared SrHfO3 NPs was found to be 2.5 nm, having a narrow size distribution, the mode being 2.0 nm, with little dispersion around the tails. Also, from Fig. 2, it is interesting to note that there are no detected crystalline domains with diameters approximately <0.7 and >7.5 nm.
To check the consistency of the data extracted from X-ray analyses, detailed investigations at the sub-nanometer level of the perovskite SrHfO3 NPs were performed by HRSTEM-HAADF experiments. Fig. 3a and b provide a representative HRSTEM overview of the metal oxide perovskite-type SrHfO3 nanoparticles. They are quite regular in shape with quasi-spherical morphology and the diameter of the NPs is estimated to be between 2 and 4 nm. This is in good agreement with the data extracted from the XRD analyses in the WPPM formalism. The crystalline nature of the NPs is clearly seen in all the micrographs (see also the inset in Fig. 3a) of the as-synthesised NPs. In order to investigate the structural phase of the NPs, interpretations of the Fourier transform (FFT) patterns obtained on a single NP (top inset of Fig. 3b) were performed using the JEMS software.41 It is important to note that for all the NPs investigated, successful indexation of the FFTs was possible only by using the SrHfO3 Pbnm type perovskite structure (top inset of Fig. 3b) whereas no solution was found with the metallic Sr (SG Im3m) structure. These findings confirm the results obtained from X-ray analyses regarding the crystal structure of the SrHfO3 NPs and the size distribution of the crystallites, as well as the low concentration of metallic Sr impurities in the synthesised products.
![]() | ||
Fig. 3 HRSTEM-HAADF micrographs of as-synthesised SrHfO3 NPs. The inset in (a) shows a magnified view of the area demarcated by the green square. The insets in (b) display the FFT pattern obtained from a single NP (red square) (top) and the superposition with the simulated diffractogram obtained with the SrHfO3 Pbnm type perovskite structural data described in Table 1 in the [1 3 5] zone axis (bottom). |
Raman spectroscopy is a sensitive technique for detecting small lattice distortions in the local crystal structure. We measured Raman spectra of as-synthesised, as well as annealed, SrHfO3 NPs. The Raman spectrum of SrHfO3 nanoparticles is shown in Fig. 4. The spectrum exhibits major peaks around 408, 549, 678 and 850 cm−1, along with weak vibrations at 146, 167, 408, 617 and 830 cm−1. The observation of these vibrational modes further substantiates the formation of single phase crystalline SrHfO3 nanoparticles.
![]() | ||
Fig. 4 Raman spectrum of as-synthesised SrHfO3 nanoparticles, and in the inset, those annealed at 800 °C. |
According to literature, orthorhombic SrHfO3 with the Pbnm space group exhibits 24 Raman active modes (7Ag + 5B1g + 7B2g + 5B3g), 25 IR active modes (9B1u + 7B2u + 9B3u) and 3 translational modes (B1u + B2u + B3u).19,60,61
The observed peaks match well with literature, confirming the orthorhombic phase. Compared to the as-synthesised NPs, the sample annealed at 800 °C shows well defined bands around 141, 163, 418, 446, 594 cm−1, which were assigned to the Ag, B1g, Ag, B2g, Ag modes, respectively, as well as minor peaks at 222, 280 and 398 cm−1 corresponding to Ag, B3g and B2g. The assignment of Raman modes for different wavenumbers is done based on theoretical work and recent experimental studies.19,62 The high frequency vibrational peaks around 830 and 850 cm−1 observed for as prepared samples correspond to B2g and B3g modes of the orthorhombic phase. The observation of broad Raman peaks, and their shift towards higher wave numbers for SrHfO3 NPs compared to the annealed samples, indicates the strain present in the lattice due to size effects. SrHfO3 in general shows a variety of phase transitions: orthorhombic → tetragonal → cubic as temperature increases.19 Here it can be noted that the size effect did not contribute to any structural change in the as-synthesised sample. Diffuse reflectance spectroscopy (DRS) data are reported in Fig. 5a–c. Fig. 5a shows the reflectance versus energy, whilst Fig. 5b and c show the Tauc plot outputs, considering indirectly and directly allowed transitions, respectively. The results highlighted that, considering an indirectly allowed transition (Fig. 5b), the optical Eg of our SrHfO3 NPs is equal to 5.78 eV, consistent with the 5.7 eV value reported by Fursenko et al.55
The room temperature photoluminescent (PL) emission spectra of the as-synthesised SrHfO3 NPs, under excitation with UV and visible light, are shown in Fig. 6. Under excitation with visible light at wavelengths at of 415 and 430 nm, a broad UV component appeared at 366 nm, along with a smaller shoulder at 290 nm. The large band at 366 nm represents a benzoate-related emission, and so this emission band can be assigned to the attached benzoate complex molecules on the surface of the NPs remaining from the synthesis, as already observed in our previous work.37 The lower intensity 290 nm band is probably related to the host SrHfO3 NPs. Excitation at UV wavelengths between 325–400 nm lead to broad visible emissions in the blue region, in the range of ∼425–500 nm. These were strong emissions for a material without any RE or Cu dopant ions, and the wavelength emitted increased as the excitation wavelength also increased. As seen in the Raman spectra, the PL emission of these perovskite NPs indicated the presence of a structural disorder, and so their PL emission thus controlled by the structure and the degree of disorder. Such structural disorder will result in a non-uniform band gap structure in which electrons or holes may be trapped. The increase of such defects should promote an increase in the PL emission intensity.
To study the dielectric properties of our SrHfO3 NPs, we measured capacitance as a function of frequency and voltage. For this purpose, a thin pellet of SrHfO3, with an area of 200 × 200 μm, sandwiched between platinum plates, was used for measurements.
The frequency dependence of capacitance measured at room temperature is shown in Fig. 7a. The data shows narrow frequency dispersion within the measured frequency range, similar to that reported in literature for SrHfO3 thin films. The calculated value of relative permittivity is 17 at 100 kHz, which is slightly smaller compared to a reported value of 21 for 59 nm thick SrHfO3 films grown on Si by atomic layer deposition.63 Bulk sintered SrHfO3 ceramics were reported to have a relative permittivity of 23.5 at 9.3 GHz,11 and sintered NPs made from a combustion route had a value of 25 at 1 MHz, so our unsintered and unannealed (as-prepared) NPs compare very well.
It is commonly known that the dielectric parameters are a function of grain size, and hence, this observed value is reasonable for such nanoscaled grains as we have in our sample. Here it is noteworthy to mention that the influence of small hydrostatic pressure (1 MPa) is insignificant for present dielectric properties as most of the effects observed on nanoparticles were reported at high pressures.64,65 For example, BaTiO3 nanoparticles experience a reduction in phase transition temperature (at a rate of 34.3 K/GPa) and large change in permittivity at hydrostatic pressures above 200 MPa.64
The room temperature dielectric loss (tanδ) shows a decreasing trend with frequency, as is to be expected, possessing a value in the range 0.7–0.5 for frequencies up to 1 kHz, with the losses levelling out above 10 kHz, with a value of 0.02 at 100 kHz and around the same at 1 MHz. These values are one order larger compared to those reported for BaHfO3 perovskites.66 Fig. 7b shows the C–V (capacitance–voltage) curve for the SrHfO3 NPs measured at 100 kHz. The value of Cmax is 3.837 pF that corresponds to a relatively large value of 9.55 nF cm−2. It can be noticed that capacitance displays a narrow hysteresis loop with a narrow opening (ΔV = 2.1 V). Such a hysteresis is an indication of dipole rotation of crystalline domains when a high electric field of opposite polarity is applied (a complete saturation was not possible in the present study due to constraints of applied voltage). There have been speculations that SrHfO3 satisfies the soft mode conditions to become a displacive ferroelectric.19 However, further studies are required to find out the origin of such hysteresis behaviour.
Footnote |
† Electronic supplementary information (ESI) available: 13C NMR spectrum 1H NMR spectrum, gas chromatogram, retention times and structures of relevant organic species and WPPM agreement factors, unit cell parameters, average crystalline domain diameter, and mode of the size distribution. See DOI: 10.1039/c6ra06990h |
This journal is © The Royal Society of Chemistry 2016 |