Three-dimensional potassium niobate nanoarray on vermiculite for high-performance photocatalyst fabricated by an in situ hydrothermal process

Yuwei Wanga, Xianggui Kong*a, Weiliang Tiana, Deqiang Leib and Xiaodong Lei*a
aState Key Laboratory of Chemical Resource Engineering, Beijing University of Chemical Technology, Beijing 100029, China. E-mail: leixd@mail.buct.edu.cn; kongxg@mail.buct.edu.cn; Fax: +86-10-64425385; Tel: +86-10-64455357
bDepartment of Neurosurgery, Union Hospital, Tongji Medical College, Huazhong University of Science and Technology, Wuhan 430022, China

Received 16th March 2016 , Accepted 9th June 2016

First published on 10th June 2016


Abstract

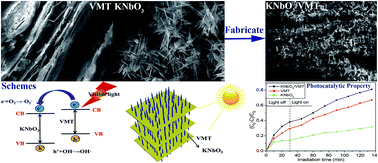
Three-dimensional (3D) potassium niobate nanoarray/vermiculite (KNbO3/VMT) was synthesized by an in situ hydrothermal method using niobium chloride as the niobium resource. Scanning electron microscopy, high resolution transmission electron microscopy, X-ray diffraction, Fourier transform infrared and X-ray photoelectron spectroscopy tests were used to confirm that KNbO3 nanoneedles have been grown both on the outer and inner surfaces of natural layered VMT and the growth mechanism of the well-aligned KNbO3 nanoarray grown on mineral VMT was attributed to the existence of Nb species. The photocatalytic performance of the as-prepared composite was investigated using the photodegradation of methylene blue (MB) under illumination. MB was removed from aqueous solution by fully taking advantage of the good absorption property of VMT and photocatalytic property of KNbO3, and visible light was used in the process. After illumination for 105 min, the removal rate of MB in aqueous solution could be higher than 81%. The removal of MB via adsorption–degradation synergy of the structured composite was much better than that of pristine VMT and KNbO3 powder with the same amount of addition, respectively. Moreover, the environmentally friendly KNbO3/VMT material is easy to synthesize and is expected to be a promising structured photocatalyst for the removal of dyes.


1 Introduction

Currently, potassium niobate (KNbO3), as a typical example of a perovskite-type material, has attracted great attention because of its excellent ferroelectric and photocatalytic properties.1–3 For example, a Au/KNbO3 composite was synthesized as a photocatalyst by loading Au nanoparticles on the surface of one-dimensional KNbO3 nanowires which exhibited good photocatalytic activity under ultraviolet and visible light illumination,4 and a nitrogen-doped KNbO3 nanocube has also been developed for enhancing the photocatalytic performance for water splitting and dye degradation.5 However, several disadvantages still exist in the photocatalysis process using KNbO3 powder. In general, photocatalytic particles have high activity when they are small enough to ensure a large surface area. Unfortunately, owing to the aggregation of KNbO3 nanoparticles and the bad dispersion stability in aqueous solution, both the effective surface area and photocatalytic efficiency of the material are largely reduced. In addition, although KNbO3 possesses a wide band gap, its photoactivity only can be motivated under UV light, which accounts for only 4% of solar energy, thus greatly limiting its practical applications.2g,4 Furthermore, the difficulty and cost of filtration, recovery and recycling of photocatalysts in powder form also limit their application.6 To solve the above problems, considerable attention has been paid on the development of catalyst-coated supports to reduce the separation and recycling spending and expand the photocatalytic response into the visible region.

Constructing a 3D architecture by supporting catalytic powder on mesoporous materials can partially solve the above problems with increasing the photocatalytic activity of the active material. Compared with the powder catalyst, 3D composites retain several prominent advantages, such as having a large contacting surface, facilitating electron transportation, being highly dispersing, and reducing separation cost. Recently, a lot of attention has been focused on supporting catalytic powder on mesoporous materials in terms of their very large surface areas.7 Among layered materials, mineral vermiculite (VMT) is a suitable candidate because it can offer a large surface area, good absorbability, heat stability and reproducibility. Moreover, VMT can also absorb visible light. Besides, VMT is a natural phyllosilicate clay material with non-toxic and environmentally friendly properties.8 For example, a CdS quantum dot sensitized VMT photocatalyst was successfully prepared and exhibited good photocatalytic activity for hydrogen evolution under light irradiation.9

VMT is a magnesium aluminium silicate with a 2[thin space (1/6-em)]:[thin space (1/6-em)]1 crystalline structure that is made up by two silica tetrahedral sheets and one magnesium octahedral sheet.10 The size of natural VMT is big enough (0.5 mm to 10 mm) which is advantageous to separation and recovery. Generally, owing to the negatively charged layer of VMT, it has presented excellent practical application as a sorbent in environmental protection for removing heavy metals from wastewater and in the treatment of oily waters by ion exchange/sorption.11 Furthermore, a small amount of Nb species exists in the layer of VMT12 which is beneficial for providing active sites where KNbO3 can in situ grow. At the same time, based on the adsorbing characteristics of VMT, it could utilize a niobium source which contains Nb5+ to be absorbed on the surface of VMT and in situ grow KNbO3 by hydrothermal synthesis. Meanwhile, KNbO3 requires UV light irradiation for photocatalytic activation, while VMT has good absorption in the visible region. Inspired by the above consideration, it should be a good choice to fabricate a hybrid with a 3D structure in which VMT works as a substrate for KNbO3, resulting in cooperation between VMT and KNbO3, which should display better absorption in the visible region range.

There are some literature reports about using KNbO3 powder as a photocatalyst,1a,3c,4 but to the best of our knowledge, investigations about utilizing structured 3D KNbO3 composite materials as photocatalysts are still few. In this work, a 3D KNbO3 nanoarray/VMT composite was synthesized by a facile in situ hydrothermal method. The photocatalytic performance of the structured KNbO3/VMT was investigated using photocatalytic degradation of MB in water under illumination, exhibiting a good photocatalytic performance (about 81% removal rate of MB after 105 min irradiation with 0.3 g catalyst). It can be concluded that the hierarchical architecture composite in this work should be a promising photocatalyst that will have practical applications in photocatalysis and relevant areas.

2 Experimental

2.1 Materials

Heat expanded natural VMT (calcined at about 1000 °C) was purchased from Xinjiang Yuli vermiculite Co. Ltd, China. The expanded VMT was immersed in alcohol (purity ≥ 99.7%) for 24 h at room temperature, then filtrated and dried at 60 °C for 24 h prior to use. Niobium chloride (NbCl5, 99%, Aladdin), potassium hydroxide (KOH, purity ≥ 85.0%, Sinopharm Chemical Reagent Co., Ltd), MB (purity ≥ 98.5%, Sinopharm Chemical Reagent Co., Ltd), p-benzoquinone (BQ, 97%, Aladdin), and isopropanol (i-PrOH, purity ≥ 99.7%, Sinopharm Chemical Reagent Co., Ltd) were used without any further purification.

2.2 Fabrication of the KNbO3 nanoarray/VMT composite

The composite was prepared by an in situ hydrothermal method. 39.2 g KOH was dissolved into 30 mL deionized water with magnetic stirring. After being completely dissolved, 0.5 g VMT was added and then 1.82 g NbCl5 was added slowly to the mixture in 30 min. After being stirred vigorously at room temperature for 30 min, the reaction mixture was sealed in an 80 mL Teflon-lined stainless steel autoclave and heated up to 180 °C, then maintained at this temperature for up to 12 h. After cooling to room temperature, the precipitate was washed several times with deionized water until the washing solution was clear and the pH of the washing water was 7. At last, the precipitate was dried at 60 °C for 24 h. The obtained sample was denoted as KNbO3/VMT.

For obtaining powder KNbO3, 39.2 g KOH was dissolved into 30 mL deionized water with magnetic stirring, and 1.82 g NbCl5 was added slowly into the solution after KOH is completely dissolved. The mixture was stirred at room temperature for 30 min, then sealed into an 80 mL Teflon-lined stainless steel autoclave and heated up to 180 °C and maintained at this temperature for 12 h. After cooling to room temperature, the suspension was vacuum filtrated. The filtrated solid was washed with deionized water until the pH of washing water was about 7. KNbO3 powder was obtained by drying at 60 °C for 24 h.

2.3 Characterization

The crystal structure of the as-synthesized samples was investigated by powder X-ray diffraction (XRD, Rigaku UItimaI II) in the 2θ range of 3–70° at a scanning step of 10° min−1. Fourier transform infrared (FTIR) spectroscopy was performed on a Nicolet 380 instrument between 4000 and 400 cm−1. Scanning electron microscopy (SEM) data were collected with ZEISS Supra 55 to explore the morphology of the as-synthesized samples. Energy dispersive X-ray spectroscopy (EDX) was used to determine the KNbO3 loadings. High resolution transmission electron microscopy (HRTEM) images were obtained using a JEM 2100-HRTEM microscope operating at 200 kV. X-ray photoelectron spectroscopy (XPS) data were obtained using an ESCALAB 250 electron spectrometer from Thermo Scientific Corporation. A monochromatic 150 W Al Kα source with a passing energy of 30 eV was used to get the high resolution spectra. Low energy electrons were utilized to compensate charge. The binding energies were relative to the adventitious C 1s line at 284.8 eV. Diffuse reflectance ultraviolet and visible (DRUV-vis) spectra were obtained on a Tsushima UV-3600 UV-vis spectrometer in the range of 200–700 nm. The standard was fine BaSO4 powder. The loading amount of KNbO3 on VMT was determined by an inductively coupled plasma (ICP) test on a Shinadzu ICPS-7500 instrument on solutions prepared by dissolving the samples in HCl with HNO3 solution (the volume ratio of concentrated hydrochloric acid vs. nitric acid solution was 3[thin space (1/6-em)]:[thin space (1/6-em)]1) for 24 h. Photoluminescence (PL) spectra were recorded using a CanyECLIPSe fluorescence spectrophotometer (Varian, USA) with an excitation at 260 nm light. Nitrogen adsorption–desorption measurements were conducted on a Conta AS-1C-VP analyzer. Samples were out-gassed at 373 K for 6 h. The specific surface areas were calculated using the Brunauer–Emmett–Teller (BET) method based on the N2 adsorption isotherms.

2.4 Photocatalysis testing

The photocatalytic performance of the KNbO3/VMT composite was evaluated by degrading MB under irradiation in aqueous solutions. Prior to irradiation, 0.3 g KNbO3/VMT was mixed with MB (100 mL, with a concentration of 10 mg L−1) in a 100 mL Pyrex flask. To obtain a complete adsorption–desorption equilibrium, the suspension was magnetically stirred in the dark for 0.5 h. Afterwards, the flask was exposed to visible light irradiation with a maximum illumination time up to 135 min. The light source was a 300 W xenon lamp located at ca. 12 cm away from the suspension surface. In the process of photocatalysis, the suspension was continuously stirred and the reaction system was placed in a cycling water bath. About 3 mL suspensions were sampled every 15 min and the samples were centrifuged several times to remove the residues. The dye concentration was evaluated according to the absorbance of MB at 665 nm in step time on a UV-vis spectrophotometer (Lambda 35, PerkinElmer).

For comparison, the same amount of KNbO3 powder and VMT (0.3 g) was used in the photocatalysis tests with the same process.

2.5 Scavenging experiments

The role of HO˙ and O2˙ in the degradation mechanism was assessed by the addition of 2 mL i-PrOH, and 1 × 10⁻³ M p-BQ, respectively. For all the experiments, 0.3 g KNbO3/VMT was added into MB aqueous solution (100 mL, 10 mg L−1) with or without adding the scavenger. The mixtures were magnetically stirred in the dark for 30 min before the reaction to encourage even dispersion of the composite and to establish an absorption/desorption equilibrium. The photocatalytic reaction was conducted at room temperature, with constant magnetic stirring to ensure full suspension of the composite throughout.

3 Results and discussion

3.1 Morphology and structure of samples

The morphologies of pristine VMT, the KNbO3/VMT hybrid and KNbO3 powder are shown in Fig. 1. It is clear to see that the surface of VMT is very smooth (Fig. 1a). After hydrothermal treatment, KNbO3 needles have closely grown on the surface of VMT to show a nanoarray structure (Fig. 1b), and the length of the KNbO3 needles is about 2 μm. The edge SEM image of the as-synthesized KNbO3/VMT composite (Fig. 1c) displays that the distance of the VMT host layers was expanded by KNbO3 needles. Obviously, the KNbO3 needles have grown both on the outer and inner surfaces of layered VMT which was beneficial for the loading of KNbO3 on VMT. The lattice structure of KNbO3 grown on VMT was further investigated by HRTEM (inset in Fig. 1c). It is shown that the lattice fringe spacing of the needle is about 0.281 nm, which corresponds to the theoretical (111) crystal plane of KNbO3.3c In contrast, the SEM image of KNbO3 powder (Fig. 1d) indicates that the needles present a dendritic growth mode. The length of the branch is up to 1–4 μm, and there is little agglomeration.
image file: c6ra06959b-f1.tif
Fig. 1 SEM image of VMT surface (a); the surface (b) and edge (c) of the KNbO3/VMT composite, and HRTEM image of a needle tip of KNbO3 powder (inset); and SEM image of the KNbO3 powder (d).

The elemental analysis of the VMT surface before and after the growth of KNbO3 was done by EDX mapping testing (Fig. 2). As shown in Fig. 2a and b, there is a tiny amount of Nb (the instrument can’t give the amount; it is nearly 0% wt) in pristine VMT. For KNbO3/VMT, the Nb element is homogeneously distributed on the sample and the content of Nb is about 26.9% wt (Fig. 2c and d). The result further indicates that KNbO3 has in situ grown on the surface and interlayers of VMT by the hydrothermal route.


image file: c6ra06959b-f2.tif
Fig. 2 SEM image of VMT (a) and KNbO3/VMT (c); (b and d) EDS maps of Nb in VMT and KNbO3/VMT, respectively.

Fig. 3 shows the in situ growth process of KNbO3 on VMT. At first, some irregular particles appeared on the smooth surface of VMT after the hydrothermal treatment for about 8 h (Fig. 3a). After reaction for 9 h, some needles were perpendicularly formed on the surface of the VMT substrate (Fig. 3b). Thereafter, the density of the highly oriented KNbO3 needles was increasing with the hydrothermal time prolonged (Fig. 3c and d). When the reaction time was extended to 12 h, a dense nanoarray of KNbO3 needles was formed all over the surface of VMT (Fig. 3d). Obviously, the mass loadings of KNbO3 increased with the hydrothermal time (Table S1). For 12 h treatment, the KNbO3 loading is about 9.85 wt%.


image file: c6ra06959b-f3.tif
Fig. 3 SEM images of KNbO3/VMT samples produced with different reaction times: 8 h (a), 9 h (b), 10 h (c), and 12 h (d).

The XRD patterns of VMT, KNbO3 powder and the KNbO3/VMT composite are shown in Fig. 4. The XRD spectrum of VMT is consistent with the previous report (Fig. 4a).7b For the pristine KNbO3 powder (Fig. 4b), a serious of reflections at 22.1°, 31.4°, 44.9°, 50.8°, 55.9° and 65.8° can be indexed as the (110), (111), (220), (221), (311) and (222) reflections of a KNbO3 phase, respectively.1a Compared with those of VMT and KNbO3, some diffraction peaks superimposed on the XRD pattern of the VMT substrate and KNbO3 are observed in the case of the KNbO3/VMT composite (Fig. 4c), indicating that the KNbO3/VMT composite has been fabricated by the hydrothermal precipitation method.


image file: c6ra06959b-f4.tif
Fig. 4 XRD patterns of VMT (a), KNbO3 (b), and KNbO3/VMT (c).

In the FTIR spectrum of KNbO3 powder (Fig. 5a), the absorption peaks in the range of 450–1000 cm−1 can be attributed to the NbO6 octahedron.13 The band which represents the O–Nb–O stretching vibration (v3 mode) in the corner-shared NbO6 is centered at ca. 623 cm−1. The band at 538 cm−1 is attributed to the edge-shared NbO6 octahedron. The peaks at 3441 and 1641 cm−1 can be ascribed to H2O adsorbed on the surfaces of samples, and the bands corresponding to adsorbed CO2 are presented at 2316, 2345 and 1383 cm−1.1a,13 The same peak signals appeared in the FTIR spectrum of KNbO3/VMT (Fig. 5b). Both the XRD and FTIR data indicate that the KNbO3 phase has been grown on the surface of VMT.


image file: c6ra06959b-f5.tif
Fig. 5 FTIR spectra of KNbO3 (a), and KNbO3/VMT (b).

In general, a larger surface area could offer more active adsorption sites that are catalytically active, which means that a higher surface area will result in a higher photocatalytic activity. N2 adsorption/desorption isotherms were used to investigate the specific surface area of VMT, KNbO3 and the KNbO3/VMT composite. As shown in Table S2, after KNbO3 was grown on VMT, the KNbO3/VMT composite acquired a larger surface area than that of the KNbO3 powder. However, after KNbO3 was loaded onto VMT, the surface area of the composite decreased compared with that of pristine VMT. The results may indicate that KNbO3 partly occupied both the outer and inner surfaces of VMT.

The oxidation state of the as-prepared samples was revealed by high resolution XPS (Fig. 6). The high resolution XPS spectra of Nb 3d for KNbO3 and KNbO3/VMT are shown in Fig. 6A. The binding energies corresponding to Nb 3d5/2 and Nb 3d3/2 are 206.067 and 208.822 eV in KNbO3, which are consistent with a previous study (Fig. 6A inset).3a However, compared with that of KNbO3, the binding energy of Nb 3d for KNbO3/VMT is increased (Fig. 6A). The two binding energies are shifted to 206.593 and 209.290 eV, respectively. The increased binding energy of Nb 3d5/2 and Nb 3d3/2 in the KNbO3/VMT composite can be attributed to the stronger bond (O–Nb–O) situation between VMT and KNbO3 for Nb5+ in the KNbO3/VMT composite than that in KNbO3. Fig. 6B shows a full XPS spectra comparison of the KNbO3 powder and KNbO3/VMT composite. The binding energies of 73.41 (Mg 2s), 87.82 (Al 2p), 101.15 (Si 2p), 530.82 (O 1s), 305.23 (K 2p), and 258.20 (C 1s) eV are ascribed to the Mg, Al, Si, O, K, and C elements in VMT.11 The photoelectron peak of the C element is referred to the adventitious hydrocarbon from the XPS instrument itself. It can be observed that the KNbO3/VMT composite consists not only of Mg, Al, Si, O, K, and C, but also the Nb element. These results are in agreement with EDX analysis which further confirmed the presence of KNbO3 on the VMT surface.


image file: c6ra06959b-f6.tif
Fig. 6 (A) The high resolution XPS spectra of the Nb core level for KNbO3 powder, and the XPS spectrum of the Nb core level for KNbO3/VMT (inset). (B) The full XPS spectra of KNbO3 powder and KNbO3/VMT.

According to the EDX and XPS results, the in situ growth mechanism of KNbO3 on the VMT surface can be explained as follows. The reaction processes most likely involve an oriented absorption and in situ growth.14 Firstly, Nb5+ is easily absorbed on the surface of VMT because of the negatively charged layer. Secondly, under a suitable temperature, the crystal seeds of KNbO3 are gradually grown on the surface of the VMT layer. Moreover, there is a little Nb in natural VMT, which can function as seed crystals for KNbO3 needle growth. Thirdly, with an extended reaction time, the crystal seeds of KNbO3 have been grown into KNbO3 needles. The Nb element in VMT gives the possibility of KNbO3 orientationally growing on the surface.

3.2 Optical absorption property and photocatalytic activity

The photophysical properties of KNbO3, VMT and KNbO3/VMT were revealed by DRUV-vis spectroscopy (Fig. 7). The absorption of KNbO3 (Fig. 7a) in the range from 400 to 700 nm is very weak, while the absorption of VMT (Fig. 7b) in this region is stronger. As for KNbO3/VMT (Fig. 7c), the absorption region has been widened into the visible range. Although the absorption of VMT in the visible range is stronger, it is usually used as an absorbent and its photocatalytic property is very poor. The as-synthesized composite displays a relatively weaker absorption in comparison with VMT in the visible range, but it is much stronger than that of the KNbO3 powder. The results indicate that the KNbO3/VMT composite extended the absorption range from the ultraviolet region to the visible region, which is beneficial for enhancing the utilization of sunlight in the photocatalysis process. The direct band gap value of the VMT sample was estimated from the (αhν)2 versus photon energy () plot as shown in the inset of Fig. 7. The extra polation of the linear regions in the Tauc plot suggests one-regime optical absorption by VMT, where the associated direct optical band gap is about 2.9 eV.9 The band gap for commercial KNbO3 is about 3.26 eV as reported in a previous study.15
image file: c6ra06959b-f7.tif
Fig. 7 DRUV-vis spectra of KNbO3 (a), VMT (b), and KNbO3/VMT (c).

PL spectrum testing is a well known technique to study the transfer process of the interface charge carrier as well as the recombination process involving the electron–hole pairs in semiconductor particles, and PL emission results from the radiative recombination of excited electrons and holes.16 As shown in Fig. S1, VMT displays a strong PL intensity, meaning a high recombination of charge carriers in VMT. After the KNbO3 nanoneedles are grown on VMT, the PL intensity decreased, indicating that the recombination of the photogenerated electron–hole pairs is efficient inhibited. Furthermore, the intimate and large contact interfaces with VMT have also improved the lifetime and transfer of the photogenerated charge carriers.17 Based on the PL results, the intensity of KNbO3 is weaker than that of KNbO3/VMT, meaning a better separation of photogenerated charge carriers. However, the efficiency of the photodegradation was lower than that of KNbO3/VMT, which is probably attributed to the higher content of surface oxygen vacancies and defects of the composite.18

The removal of MB under visible light illumination was used for evaluating the photocatalytic performance of the as-synthesized KNbO3/VMT composite. The photocatalytic performance of KNbO3, VMT and KNbO3/VMT is shown in Fig. 8. Before the photodegradation experiment, the suspension including the photocatalyst and MB was stirred for 30 min in the dark in order to reach a complete adsorption–desorption equilibrium. Fig. 8 shows a clear sharp decrease of MB concentration due to absorption in the first 30 min. It is observed that the MB removal percentages on the three materials increase slowly after adsorption for 20 min, almost reaching a plateau between 20 min and 30 min, which indicates that the adsorption equilibrium was achieved. The MB removal percentages on KNbO3, VMT and KNbO3/VMT by adsorption achieved 13.9%, 29.3% and 38.2%, respectively. MB adsorption percentages over the composite in the dark were used to calculate the equilibrium adsorption capacity of the sample. As shown in Fig. S2, it was about 2.165 mg g−1. It is noticed that the MB removal percentage of the composite is larger than that of KNbO3 and VMT, which may be due to the larger surface area of the KNbO3/VMT that induced the open layer structure which was expanded by the growth of KNbO3 needles on the inner surfaces of VMT. Subsequently, when turning on the light, the removal percentage of the composite had an obvious increase caused by photocatalysis. As the reaction proceeded, the MB removal percentages on KNbO3, VMT and KNbO3/VMT achieved 32%, 67% and 81% after visible light irradiation for 105 min, respectively. The photocatalytic performance of KNbO3/VMT is better than that of KNbO3, which can be explained by the fact that after the KNbO3 needles were grown on the surface of VMT layers, KNbO3/VMT with a 3D structure supplied lots of active sites exposed to the environment that can enhance the photocatalytic ability, resulting in an efficient removal percentage for the dye.15 In addition, VMT is transparent, which is propitious to the visible light irradiating the KNbO3 needles from all angles. Therefore, the KNbO3 needles grown on the VMT surface can take advantage of the use of visible light. All the above data suggest that the MB removal efficiency of the composite was improved by combining the synergetic effect of both the high photoactivity of KNbO3 and good absorption of VMT.


image file: c6ra06959b-f8.tif
Fig. 8 Photocatalytic activity of KNbO3, VMT and KNbO3/VMT for MB removal under visible light irradiation. The initial MB concentration was 10 mg L−1.

The effect of the KNbO3/VMT amount on the removal of MB is shown in Fig. 9a. Obviously, the reaction speed would be improved with an appropriate increase of the amount of catalyst. As the amount of the catalyst increased from 0.1 g to 0.5 g, the removal percentage increased from 28% to 81%. When 0.5 g catalyst was added, it almost reached reaction equilibrium after 120 min. 0.5 g catalyst provided about 81% removal rate of MB after 150 min irradiation, while the removal rate was only 28% with 0.1 g catalyst under the same conditions. The reason can be explained as that with the increasing amount of catalyst, the solid–liquid interface for adsorption and catalysis was enlarged, resulting in the material absorbing much more organic dye. When the amount of catalyst was 1 g and 2 g, the strong absorption played a major role in eliminating dye molecules. After 30 min, it almost removed about 85% of MB. Furthermore, the photocatalytic ability is not fully displayed when an excess amount of catalyst was added into MB solution. In addition, the effect of initial concentration of MB on the photocatalytic ability was also investigated. Fig. 9b shows the different removal rate of the 3D KNbO3/VMT catalyst with various concentrations of MB. Obviously, the MB degradation rate was enhanced with the initial MB concentration increasing, which can be attributed to the fact that there is much more contact probability between the catalysts and MB molecules in a high concentration. A recycling study was used to evaluate the stability and reusability of the materials. As shown in Fig. S3, after the third catalytic cycle, the MB removal percentage was still above 75%, indicating that the composite has high stability and reusability during recycling.


image file: c6ra06959b-f9.tif
Fig. 9 (a) The different removal rate of MB with different amounts of the KNbO3/VMT composite with an initial MB concentration of 20 mg L−1. (b) Removal rate versus time with various initial concentrations of MB. The amounts of the catalysts were all 0.3 g.

BQ (O2˙ scavenger) and i-PrOH (HO˙ scavenger) have been used to discern the participation of O2˙ and HO˙ in the photocatalysis mechanism.19 In our experiment, the removal percentages of MB were decreased when BQ and i-PrOH were added to the photocatalytic system, respectively (Fig. S4). The results clearly show the contribution of O2˙ and HO˙ to MB degradation. Fig. 10 shows the photocatalysis schematic diagram of the KNbO3/VMT composite for the degradation of MB. Firstly, when KNbO3/VMT was exposed to visible light, only the electrons in the valence band (VB) of VMT can be excited. The electrons in the conduction band (CB) of KNbO3 can migrate to the CB of VMT, which leads to the separation of carriers. Secondly, the KNbO3 and VMT semiconductors can generate pairs of electrons and holes under light illumination. Then the adsorbed O2 can react with the photoelectrons to produce superoxide radical anions (O2˙). Meanwhile, the H2O molecules can react with the holes to produce hydroxyl radicals (OH˙). Both the superoxide radical anions and hydroxyl radicals are important in the degradation of organic molecules.20 According to the cooperation effects, the KNbO3/VMT composite exhibits good degradation for MB in the visible light range.


image file: c6ra06959b-f10.tif
Fig. 10 The photocatalysis schematic diagram of the KNbO3/VMT composite.

4 Conclusions

In summary, we have fabricated a 3D structured KNbO3/VMT composite by an in situ hydrothermal method. KNbO3 nanoneedles have grown vertically both on the inner and outer surfaces of layered VMT to form a nanoarray structure. Furthermore, the photocatalytic property of the KNbO3/VMT composite was also investigated by the degradation of MB molecules in the visible light range. The removal percentage of MB can achieve 81% in 105 min with 0.3 g catalyst. KNbO3/VMT with a 3D structure provided lots of active sites exposed to an environment that can enhance the photocatalytic ability. Moreover, the cooperation effect of adsorption and photocatalysis occurred in the removal process. Thus, it can be concluded that the 3D structured KNbO3/VMT composite has more practical applications in photocatalysis and environmental remediation.

Acknowledgements

This work was supported by the 973 Program (no. 2014CB932104), National Natural Science Foundation of China, Program for New Century Excellent Talents in Universities, Fundamental Research Funds for the Central Universities (ZZ1501 and YS1406) and Program for Changjiang Scholars, Innovative Research Team in University (no. IRT1205) and Beijing Engineering Center for Hierarchical Catalysts of P. R. China.

Notes and references

  1. (a) T. Zhang, K. Zhao, J. Yu, J. Jin, Y. Qi, H. Li, X. Hou and G. Liu, Nanoscale, 2013, 5, 8375 RSC; (b) M. Peña and J. L. G. Fierro, Chem. Rev., 2001, 101, 1981 CrossRef.
  2. (a) Y. Saito, H. Takao, T. Tani, T. Nonoyama, K. Takatori, T. Homma, T. Nagaya and M. Nakamura, Nature, 2004, 432, 84 CrossRef CAS PubMed; (b) Z. Cheng, K. Ozawa, M. Osada, A. Miyazaki and H. Kimura, J. Am. Ceram. Soc., 2006, 89, 1188 CrossRef CAS; (c) Y. Nakayama, P. J. Pauzauskie, A. Radenovic, R. M. Onorato, R. J. Saykally, J. Liphardt and P. Yang, Nature, 2007, 447, 1098 CrossRef CAS PubMed; (d) J. Huang, Z. Chen, Z. Zhang, C. Zhu, H. He, Z. Ye, G. Qu and L. Tong, Appl. Phys. Lett., 2011, 98, 093 Search PubMed; (e) Y. Guo, K. Kakimoto and H. Ohsato, Appl. Phys. Lett., 2004, 85, 4121 CrossRef CAS; (f) F. Dutto, C. Raillon, K. Schenk and A. Radenovic, Nano Lett., 2011, 11, 2517 CrossRef CAS PubMed; (g) Q. Ding, Y. Yuan, X. Xiong, R. Li, H. Huang, Z. Li, T. Yu, Z. Zou and S. Yang, J. Phys. Chem. C, 2008, 112, 18846 CrossRef CAS; (h) G. Li, N. Yang, W. Wang and W. Zhang, J. Phys. Chem. C, 2009, 113, 14829 CrossRef CAS.
  3. (a) X. Li, N. K. Kikugawa and J. Ye, Adv. Mater., 2008, 20, 3816 CrossRef CAS; (b) D. Staedler, T. Magouroux, R. Hadji, C. Joulaud, J. Extermann, S. Schwung, S. Passemard, C. Kasparian, G. Clarke and M. Gerrmann, ACS Nano, 2012, 6, 2542 CrossRef CAS PubMed; (c) L. Jiang, Y. Qiu and Z. Yi, J. Mater. Chem. A, 2013, 1, 2878 RSC.
  4. J. Lan, X. Zhou, G. Liu, J. Yu, J. Zhang, L. Zhi and G. Nie, Nanoscale, 2011, 3, 5161 RSC.
  5. R. Wang, Y. Zhu, Y. Qiu, C. Leung, J. He, G. Liu and T. Lau, Chem. Eng. J., 2013, 226, 123 CrossRef CAS.
  6. X. Wang, Y. Liu, Z. Hu, Y. Chen, W. Liu and G. Zhao, J. Hazard. Mater., 2009, 169, 1061 CrossRef CAS PubMed.
  7. (a) S. Froehner, K. S. Machado and F. Falcao, Water, Air, Soil Pollut., 2010, 209, 357 CrossRef CAS; (b) T. Kogure, K. Morimoto, K. Tamura, H. Sato and A. Yamagishi, Chem. Lett., 2012, 41, 380 CrossRef CAS.
  8. Y. Qian, C. I. Lindsay, C. Macosko and A. Stein, ACS Appl. Mater. Interfaces, 2011, 3, 3709 CAS.
  9. J. Zhang, W. Zhu and X. Liu, Dalton Trans., 2014, 43, 9296 RSC.
  10. (a) X. Zhou, H. Yang, C. Wang, X. Mao, Y. Wang, Y. Yang and G. Liu, J. Phys. Chem. C, 2010, 114, 17051 CrossRef CAS; (b) J. Xu, Y. Meng, R. Li, Y. Xu and A. V. Rajulu, J. Polym. Sci., Part B: Polym. Phys., 2003, 41, 749 CrossRef CAS.
  11. J. Lin, Q. Tang, J. Wu and H. Sun, Sci. Technol. Adv. Mater., 2008, 9, 025010 CrossRef.
  12. R. Neumann, G. E. L. Costa, J. C. Gaspar, M. Palmieri and S. E. Silva, Miner. Eng., 2011, 12, 1323 CrossRef.
  13. J. S. d. Andrade, A. G. Pinheiro, I. F. Vasconcelos, J. M. Sasaki, J. A. C. d. Paiva, M. A. Valente and A. S. B. Sombra, J. Phys.: Condens. Matter, 1999, 11, 4451 CrossRef.
  14. (a) L. Mai, F. Yang, Y. Zhao, X. Xu, L. Xu and Y. Luo, Nat. Commun., 2011, 2, 381 CrossRef PubMed; (b) H. Colfen and M. Antonietti, Angew. Chem., Int. Ed., 2005, 44, 5576 CrossRef PubMed; (c) R. L. Penn and J. F. Banfield, Science, 1998, 281, 969 CrossRef CAS PubMed.
  15. (a) M. R. Hoffmann, S. T. Martin, W. Choi and D. W. Bahnemann, Chem. Rev., 1995, 95, 69 CrossRef CAS; (b) A. L. Linsebigler, G. Lu and J. T. J. Yates, Chem. Rev., 1995, 95, 735 CrossRef CAS; (c) A. G. S. Prado, L. B. Bolzon, C. P. Pedroso, A. O. Moura and L. L. Costa, Appl. Catal., B, 2008, 82, 219 CrossRef CAS; (d) J. Pan, H. Dou, Z. Xiong, C. Xu, J. Ma and X. Zhao, J. Mater. Chem., 2010, 20, 4512 RSC.
  16. (a) K. K. Haldar, G. Sinha, J. Lahtinen and A. Patra, ACS Appl. Mater. Interfaces, 2012, 4, 6266 CrossRef CAS PubMed; (b) X. Xin, R. Liu, X. Yu, G. Zhang, H. Cao, J. Ya, B. Ren, Z. Jiang and H. Zhao, J. Mater. Chem. A, 2013, 1, 1488 RSC; (c) Y. Shi, H. Li, L. Wang, W. Shen and H. Chen, ACS Appl. Mater. Interfaces, 2012, 4, 4800 CrossRef CAS PubMed.
  17. S. Han, L. Hu, Z. Liang, S. Wageh, A. Ghamdi, Y. Chen and X. Fang, Adv. Funct. Mater., 2014, 24, 5719 CrossRef CAS.
  18. L. Jing, Y. Qu, B. Wang, S. Li, B. Jiang, L. Yang, W. Fu, H. Fu and J. Sun, Sol. Energy Mater. Sol. Cells, 2006, 90, 1773 CrossRef CAS.
  19. Y. Lin, D. Li, J. Hu, G. Xiao, J. Wang, W. Li and X. Fu, Appl. Catal., B, 2016, 192, 152 CrossRef.
  20. L. Pan, X. Liu, Z. Sun and C. Q. Sun, J. Mater. Chem. A, 2013, 1, 8299 CAS.

Footnote

Electronic supplementary information (ESI) available. See DOI: 10.1039/c6ra06959b

This journal is © The Royal Society of Chemistry 2016