DOI:
10.1039/C6RA06724G
(Paper)
RSC Adv., 2016,
6, 52058-52066
Microwave-assisted synthesis of NaA nanozeolite from slag and performance of Ag-doped nanozeolite as an efficient material for determination of hydrogen peroxide†
Received
14th March 2016
, Accepted 18th May 2016
First published on 23rd May 2016
Abstract
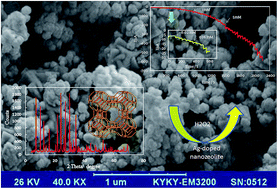
A new amperometric sensor is prepared based on a Ag doped NaA nanozeolite modified carbon paste electrode (Ag/ACPE) in order to detect hydrogen peroxide (H2O2) in phosphate buffer solution (PBS, pH 7.0). The NaA nanozeolite is synthesized from extracted silica of an industrial waste, silica slag, using microwave pretreatment and a hydrothermal method without organic additives. The sizes of NaA nanoparticles are in the range of 40 to 90 nm with an average diameter of 60 nm. The reduction current of H2O2 on Ag/ACPE is much higher than that on the non-modified NaA/CPE and CPE, which means the incorporation of Ag species into the NaA nanozeolite can create active sites for electrocatalytic reduction of H2O2. The Ag/ACPE sensor provides a linear response for H2O2 concentration with two linear ranges (0.02–7 mM and 7–30 mM) and has a low detection limit of 3.55 μM, a fast response time (t95% = 4 s), and a high sensitivity of about 651.37 μA mM−1 cm−2. Although oxygen interferes for H2O2 detection, the determination of peroxide in an anaerobic analyte cannot be affected by common interfering species such as ascorbic acid (AA), glucose, uric acid (UA) and sucrose. The obtained results show that the Ag modified zeolite has good performance as a sensor for H2O2 determination.
1. Introduction
The determination of hydrogen peroxide (H2O2) has recently received much attention because of its various and wide uses in different fields such as the chemical industry,1 biology,2,3 pharmacy,4 food production,5 pulp and paper bleaching,6 sterilization,7 clinical,8 fuel cell,9,10 environmental applications11 etc. H2O2 is also a final product of various enzymatic reactions, and its concentration may be used as a direct indicator of the reaction progress.12 Various methods are used for detection and determination of H2O2, such as titration,13 spectrophotometry,14 fluorometry,15 chemiluminescence,16 and chromatography.17 However, all of them are costly, complex and time consuming. Electrochemical sensors have the advantages of simplicity, high reliability, sensitivity and selectivity, low cost, fast response, and being easy to use.18,19 Since direct electrochemical reduction of H2O2 is slow and involves high over potential, it is necessary to use the modified electrode in order to facilitate the overall process. The structure and property of the support materials in modified electrodes can influence the behavior of H2O2 sensors.
Various materials such as carbon nanotubes, layer-by-layer assembly of polyoxometalates via zirconium ion glue,20 metal nanoparticles,21,22 silver nanowire,12 iron doped carbon aerogel23 and zeolite with transition metals24 have been used as modified electrodes in the determination of H2O2.
Zeolite modified electrodes (ZMEs) are prepared through the ion-exchange ability of zeolite. Different materials can be incorporated to the supercages of zeolite. Among them, the modified electrodes based on transition metal-zeolite such as Ni-ZSM5,25 Ni-SBA-15,26 Cu-zeolite,27 Pb-zeolite28 have been investigated for catalytic purposes with modification of nanozeolites. They show more capability to catalyze an electrochemical reaction due to their high surface area and cation exchange ability on the surface of nanozeolite.
Zeolites are crystalline, aluminosilicate minerals which have a wide range of pore sizes and high surface area. These materials are well known for their wide uses such as ion-exchanger, catalysts, adsorbents and zeolite membranes.29,30 The use of zeolites as supported electrodes can solve the problem of overpotential of electrocatalytic reduction of H2O2.
NaA zeolites are known for their ability to trap different types of molecules.29 In this zeolite, each unit cell consists of 96 AlO4 and 96 SiO4 tetrahedral and includes eight α cages or supercages, and eight β cages (sodalite cages).31 Recently, many efforts have been made to synthesize nanocrystalline zeolites with dimension less than 100 nm.26 Synthesis of nanozeolite from low cost silica sources such as sorghum,26 stem cane ash,32 barley husk33 and slags instead of expensive materials is of great importance. Slags, usually a mixture of metal oxides and silicon dioxide, are industrial wastes and can be used as a good source of silica.34
In this paper, NaA nanozeolite is synthesized based on silica extracted from slag using microwave-assisted hydrothermal method which has the advantages such as short reaction time, more nucleation versus crystal growth and small crystals size. Then, NaA nanozeolite is modified with silver (Ag/A). Then, the electrochemical behavior of Ag/A nanozeolite incorporated in carbon paste electrode (Ag/A CPE) is investigated for electrocatalytic reduction of H2O2 in phosphate buffer solution (PBS, pH 7.0) by cyclic voltammetry and amperometry technique.
2. Materials and methods
2.1. Materials and reagents
Silica powder was extracted from slag by Kalapathy et al. method.35 The materials used for the synthesis of NaA nanozeolite were extracted silica, sodium aluminate (Sigma-Aldrich) as an aluminum source, NaOH (Merck, 98%) and HCl (Merck, 37%). Graphite powder, silver nitrate and H2O2 (35%) were purchased from Fluka. PBS was prepared by mixing NaH2PO4·H2O (Merck) and Na2HPO4·12H2O (Sigma-Aldrich).
2.2. Apparatus
The X-ray diffraction (XRD) of the calcined zeolitie sample was recorded by X-ray diffractometer (GBC MMA Instrument, 35.4 kV and 45 mA) using Cu Kα radiation (λ = 1.5418 Å). FT-IR spectrum was recorded using FT-IR spectrometer (Vector 22-Bruker) in the range of 430–3500 cm−1 at room temperature. The surface morphology of synthesized zeolite was investigated by scanning electron microscopy (SEM, EM-3200). The chemical composition of extracted silica in the form of oxides was analyzed by X-ray fluorescence (XRF, Philips Pw 1480). The surface areas of the samples were studied by linear portion of the Brunauer–Emmett–Teller (BET, Quantachrome Instruments) plots. The pore size distribution was measured by the conventional Barrett–Joyner–Halenda (BJH) method. The spectra of elemental analysis of zeolite were recorded by energy dispersive X-ray (EDX, VEGA3 XUM/ESCAN). Electrochemical experiments were performed using a Dropsens, potentiostat/galvanostat (μSTAT400). Three electrode system containing platinum wire, Ag|AgCl (KCl, 3 M), Ag/ACPE were used as auxiliary, reference and working electrode, respectively.
2.3. Silica extraction from slag
Silica was extracted from slag by refluxing in HCl (6 M) solution under stirring at 60 °C for 4 h. To obtain further purity, this step was repeated again and the filtrate was washed with double distilled water and then was dried in oven at 70 °C overnight and calcinated at 550 °C for 4 h.
2.4. Synthesis of NaA nanozeolite
NaA nanozeolite was synthesized by microwave pretreatment and hydrothermal method at low temperature. Extracted silica and sodium aluminate were used as Si and Al sources. In a typical synthesis, 6 g NaOH was dissolved in 50 mL of double distilled water. Then, 0.94 g extracted silica was added to half of the NaOH solution under stirring at 80 °C. After that, the solution was centrifuged until a clear solution was obtained. The aluminate solution was prepared by mixing 1.3 g of sodium aluminate with another half of the NaOH solution at 80 °C. After cooling of both solutions at room temperature, the aluminate solution was slowly added to the silica solution under high speed stirring until a homogeneous solution was obtained. Then, the mixture was transferred to the polypropylene bottle and kept under microwave irradiation for 60 min. After wards, the solution was transferred to an oil bath at 40 °C under low rate stirring for 3 h. Finally, zeolite was separated by centrifugation (13
000 rpm, 30 min), followed by dispersion in double distilled water until the pH of solution was reached to 7.0 and dried at 70 °C overnight.
2.5. Preparation of working electrode
CPE was prepared by mixing graphite and diethyl ether. After the evaporation of the solvent, paraffin as mineral oil was added and the mixture was blended by hand mixing in mortar and the resulting paste was inserted in the bottom of a glass tube (with internal radius 1.5 mm). The electrical connection was created by a copper wire. Ag/CPE was prepared by immersing CPE in 0.1 M AgNO3 for 30 min.
Silver doped zeolite sample (Ag/A) was prepared by dispersing 0.4 g of NaA nanozeolite in 10 mL 0.1 M AgNO3 solution in the absence of direct light. Na+ ions in NaA could exchange with silver ions (Ag/A). Then, Ag/A was centrifuged, washed with double distilled water and dried in oven at 70 °C for 10 h. Two different electrodes of unmodified zeolite CPE (NaA/CPE) and Ag-doped zeolite CPE (Ag/ACPE) were prepared by mixing NaA and Ag/A to graphite powder in a ratio of 30
:
70% (w/w) and then were pasted with addition of diethyl ether and paraffin as mentioned above.
Finally, all the electrodes were washed with double distilled water to remove surface-adsorbed species. In order to investigate the electrocatalytic behavior of Ag/ACPE on reduction of H2O2, other experiments were carried out at CPE, Ag/CPE and NaA/CPE to investigate the role of different electrode in electrocatalytic reduction of H2O2.
2.6. Electrochemical pretreatment of Ag/ACPE
The electrode was pretreated at potential of −1.0 V vs. Ag|AgCl for 15 min in 0.1 M PBS (pH 7.0) in order to activate the electrode surface through electrochemical treatment. All the experiments were carried out under nitrogen atmosphere, because oxygen could be reduced at −0.4 V on CPE and has a negative effect on the signal of H2O2 reduction.24
3. Results and discussion
3.1. Characterization of NaA nanozeolite
The chemical composition of extracted silica was analyzed by X-ray fluorescence (XRF), which is shown in Table 1. The major component of extracted silica in the form of oxides are SiO2 (63.75%) along with small amounts of other inorganic oxides such as Al2O3, K2O, CaO, SO3, TiO2, P2O5, Na2O, MgO, MnO and Fe2O3. The silica purity is enough to be used as silica source in direct synthesis of NaA nanozeolite. The XRD patterns of the NaA nanozeolite before and after modification by AgNO3 are shown in Fig. 1a and b. The main peaks at 2θ = 7.18, 10.17, 12.46 are related to pure phase of the NaA nanozeolite.36 As can be seen in Fig. 1b, the peaks at 2θ = 34.42, 42.46° are related to presence of Ag in nanozeolite.
Table 1 The XRF analysis of extracted silica powder (wt%)
Al2O3 |
Fe2O3 |
CaO |
SiO2 |
Na2O |
K2O |
MgO |
TiO2 |
MnO |
P2O5 |
SO3 |
LOIa |
LOI: loss of ignition. |
0.11 |
0.15 |
0.21 |
63.75 |
0.02 |
0.01 |
0.02 |
0.335 |
0.001 |
0.710 |
0.002 |
34.54 |
 |
| Fig. 1 The XRD patterns of NaA nanozeolite (a) and Ag/A nanozeolite (b). | |
Fig. 2a shows FT-IR spectrum of NaA nanozeolite. The broad band at about 3423.80 cm−1 and band around 1654.88 cm−1 are related to water molecules of zeolite; the band at 460 cm−1 is due to internal vibration between Si–O–Si tetrahedral and the band about 1005.12 cm−1 is observed due to asymmetrical vibration of Si–O–Si tetrahedral. Finally, the absorption bands within the range of 420–500 cm−1 are attributed to the T–O–T bending of vibration mode (T = Al, Si) and those within the range 950–1250 cm−1 are related to the T–O–T stretching vibration mode.37 SEM technique was employed for determination of morphology and size of the synthesized NaA nanozeolite. Fig. 2b shows aggregated spherical and cubical nanoparticles in the range of 40–90 nm with the average particle size of 60 nm. The application of microwave irradiation has significant effect on heating time and reaction temperature, which causes the quick production of synthesis solution, more nucleation versus crystal growth and smaller crystals size. Therefore, this method is a faster, simpler and efficient in use of energy compared with other methods which used conventional hydrothermal.
 |
| Fig. 2 FT-IR spectra of NaA nanozeolite (a) and SEM image of NaA nanozeolite (b). | |
NaA nanocrystals were characterized by BET method using N2 adsorption/desorption isotherm to determine their pore diameter and specific surface area (Fig. 3a). The adsorption/desorption isotherm shows the type III behavior without hysteresis loop. The specific surface area of the NaA nanozeolite is 97.48 m2 g−1 (Table 2). The prepared NaA nanozeolite has specific surface area more than other reported nanozeolites prepared without organic template.33,38 However, the surface areas of synthesized NaA nanozeolite with organic template were considerably more than those of nanozeolite without organic template due to its larger pores.39 In addition, BJH pore size distribution desorption curve of NaA nanozeolite is shown in Fig. 3b, indicating the average pore diameter of 2.459 nm. Fig. 4a and b show EDX spectra of NaX and Ag/A nanozeolite. As it can be seen in EDXs of samples before and after modification with silver, the peak intensity of sodium (Na+) in Ag/ACPE decreases in comparison with the NaA/CPE whereas the peak of silver is appeared which confirms the presence of Ag species on the surface of nanozeolite. Inset of Fig. 4b show the percent of different elements in the synthesized NaA nanozeolite.
 |
| Fig. 3 The N2 adsorption–desorption isotherm (a) and the BJH pore size distribution desorption (b) of NaA nanozeolite. | |
Table 2 The structural properties of NaA nanozeolite powder determined by BET methoda
Sample |
aS (m2 g−1) |
Vt (cm3 g−1) |
DBET (nm) |
Abbreviations: aS, the BET surface area; Vt, total pore volume; DBET, average pore diameter. |
NaA nanozeolite |
97.48 |
0.14 |
2.459 |
 |
| Fig. 4 The EDX spectra of prepared NaA nanozeolite before (a) and after (b) modification by AgNO3. | |
3.2. Electrocatalytic reduction of H2O2
The presence of silver particles on the surface of modified electrode can be investigated from redox behavior of Ag/ACPE by cyclic voltammetry.40 Fig. S1† displays cyclic voltammograms (CVs) of the Ag/ACPE in the 0.1 M PBS (pH 7.0). The Ag/ACPE exhibits obvious anodic peak at 0.63 V and cathodic peak at −0.1 V which illustrates the oxidation of Ag particles and reduction of Ag+ cations.
Fig. S2† shows CVs of CPE (a) and Ag/ACPE (b) in the 0.1 M PBS (pH 7.0) at 50 mV s−1. In the absence of H2O2, no obvious cathodic current is observed on both electrodes. To compare the ability of Ag/ACPE to catalyze the reduction of H2O2, the responses of NaA/CPE (a), CPE (b), Ag/CPE (c) and Ag/ACPE (d) are shown in Fig. 5. In the presence of 2 mM H2O2, no obvious reduction current is observed at NaA/CPE (a) and CPE (b). However, on the surface of Ag/CPE (c), a small reduction peak is observed at −0.5 V due to reduction of H2O2 which indicates that the presence of Ag species in CPE is necessary for the reduction process and can increase the activity of electrode. In other hand, high reduction current is observed at −0.43 V at Ag/ACPE (d) for H2O2 reduction. In addition, the position of cathodic peak shifts to more positive potential. The low potential of H2O2 reduction (−0.43 V) and high electrocatalytic activity of the Ag/ACPE can be related to the presence of NaA nanozeolite as an efficient platform for catalytic performance of Ag species due to its high surface area and porous structure. It seems that NaA nanozeolite can absorb more Ag particles on its surface and provides active site to accelerate the reduction of H2O2 in comparison with Ag/CPE which is a nonporous material.
 |
| Fig. 5 CVs of (a) NaA/CPE (b) CPE (c) Ag/CPE and (d) Ag/ACPE in the presence of 2 mM H2O2 in 0.1 M PBS (pH 7.0) at scan rate of 50 mV s−1. | |
Generally, the direct electrochemical reduction at the bare electrode shows low electrode kinetics and overpotential41 and the net reduction of H2O2 at the bare electrode such as CPE is shown in eqn (1) Ag/ACPE can increase the rate of electron transfer. In this case, H2O2 is firstly decomposed into H2O and O2 on Ag/A as shown in eqn (2) and then the generated oxygen is reduced according to eqn (3)42
|
H2O2 + 2e− + 2H+ → 2H2O
| (1) |
|
 | (2) |
|
O2 + 2e− + 2H+ → H2O2
| (3) |
On the other hand, O2 was reduced on electrode by the following mechanism:43,44
|
[O2ads*−] + H2O → HO*2(ads) + OH−
| (5) |
After that, one of the following reactions can be occurred:
|
HO*2ads + O2*− → HO2−(aq) + OH−
| (6) |
|
HO*2ads + e− → HO2−(aq)
| (7) |
Consequently, the reduction peak current of H2O2 is amplified on Ag/ACPE electrode surface.
Fig. 6 shows the response of Ag/ACPE electrode in 0.1 M PBS when different concentrations of H2O2 are added. The cathodic peak current is increased proportional to the concentration of H2O2 due to an irreversible electrocatalytic reduction of H2O2.
 |
| Fig. 6 CVs of Ag/ACPE in the presence of various concentrations of H2O2: (a) 0.0, (b) 2, (c) 4, (d) 6, (e) 8, (f) 10, and (g) 12 mM in 0.1 M PBS (pH 7.0) at scan rate of 50 mV s−1. | |
3.3. Effect of scan rate
Fig. 7A displays CVs of Ag/ACPE in 0.1 M PBS at various scan rates (υ) in the presence of 2 mM H2O2. The peak potentials (Ep) of electrocatalytic reduction of H2O2 shifts towards more negative values with increase in scan rate. The reduction currents depend directly on the square root of the scan rate which suggests that the reduction process is controlled by the diffusion process (Fig. 7B). Generally, the uses of heterogeneous catalysis for catalytic systems occur when both the charge transfer and the chemical reaction are irreversible.45 There is a relationship between Ep and scan rate is defined by Laviron's equation which is used for irreversible chemical reaction:46 |
 | (8) |
 |
| Fig. 7 (A) CVs of Ag/ACPE in the presence of 2 mM H2O2 in 0.1 M PBS (pH 7.0) at various scan rates: (a) 0.025, (b) 0.05, (c) 0.075, (d) 0.1, (e) 0.15, (f) 0.2 and (g) 0.3 V s−1. (B) Plot of cathodic peak current density against the square root of the scan rate. (c) Plot of Ep vs. log υ for CVs showed in the (C). | |
Electron transfer coefficient or symmetry factor (α) is a factor which its values can change between 0 and 1. α is a quantity that is commonly used in the kinetic studies of electrode processes and defined as −(RT/F) (dln|j|/dE), where j is the cathodic or anodic current density. Also, in practice, α is considered as the reciprocal of the corresponding Tafel slopes. The amount of electron transfer coefficient is 0.5 for symmetric reactions which has equivalence backward and forward speed.
The linear dependence of Ep to the logarithm υ is shown in Fig. 7C, the slope of plot is equal to 2.303RT/(1 − α)nF and the electron transfer coefficient is calculated 0.23. Also, the value of anodic electron transfer coefficient is calculated to be 0.77. This results show that the rate limiting steps for cathodic and anodic might not be the same step.47 The obtained value of α = 0.23 shows that reduction reaction has low potential and it is faster than oxidation reaction with 1 − α = 0.77. As can be seen in Fig. 7A the increase in sweep rate causes a shift of the peak potential towards more negative values, for the catalytic reduction of H2O2.
3.4. Amperometric determination of H2O2
Amperometric determination is very sensitive and more useful method than CV for determination of low concentration of analytes. Fig. 8a shows the amperometric response of H2O2 at the Ag/ACPE recorded with addition of different concentration (0.02 mM to 30 mM) of H2O2 to a continuous stirred deoxygenated 0.1 M PBS. The applied potential was −0.45 V vs. Ag|AgCl in order to avoid interferences from some electroactive substance such as ascorbic acid, uric acid, glucose and sucrose. The current intensity decreases with the successive addition of small amount of H2O2 but in the high concentration of H2O2, the amperometric response of the electrode is noisy. The linear response of currents vs. H2O2 concentrations is depicted in Fig. 8b. Two linear range sections from 0.02 to 7 mM and 7 to 30 mM are found for Ag/ACPE. It seems that the increase in concentration of H2O2 can probably change the diffusion layer thickness and diffusion velocity which results in change of the reaction rate and due to it, slope of calibration curve can be changed.40,48 The detection limit is estimated to be 3.55 μM at a signal-to-noise (S/N) ratio of 3. The response time of the electrode toward H2O2 reduction is t95% = 4 s and its sensitivity is about 651.37 μA mM−1 cm−2. The detection potential, linear range, detection limit and sensitivity of the sensor are compared with the other H2O2 sensors in Table 3. Therefore from the obtained data, H2O2 sensor reported here has a wide linear range, low detection limit and high sensitivity.
 |
| Fig. 8 (a) Amperometric response of the Ag/ACPE sensor towards successive injections of 0.02 to 30 mM H2O2 at −0.45 V vs. Ag|AgCl in 0.1 M PBS (pH 7.0); inset: amperometric responses of first H2O2 additions during 100–550 s; (b) calibration plot of catalytic currents vs. H2O2 concentrations with two linear ranges. | |
Table 3 Comparison of non-enzymatic hydrogen peroxide sensors
Electrode |
Detection potential (V) |
Linear range (μM) |
Detection limit (μM) |
Sensitivity (μA mM−1 cm−2) |
Ref. |
Zeolite–Fe(III) carbon paste electrode (CPE). Ag doped mesoporous SBA-15 modified glassy carbon electrode (GCE). Fe doped carbon aerogel modified CPE. |
Nanorough Ag |
−0.3 vs. SCE |
10–22.5 × 10³ |
6 |
— |
51 |
Zeolite–Fe(III)–CPEa |
−0.3 vs. Ag/AgCl |
10–150, 3 × 10²–100 × 103 |
60 |
570 × 103 |
24 |
Ag nanowire array |
−0.2 vs. SCE |
0.1 × 10⁶ to 3.1 × 10³ |
29.2 |
0.0266 × 10⁻³ |
12 |
Ag–mSBA-15/GCEb |
−0.45 vs. Ag/AgCl |
48.5–97 × 104 |
12 |
— |
52 |
(Fe–CA)–CPEc |
−0.45 vs. Ag/AgCl |
1 × 10³ to 50 × 103 |
500 |
1780 ± 0.04 |
23 |
Ag/ACPE |
−0.45 vs. Ag/AgCl |
20–7 × 10³, 7 × 10³–3 × 10⁴ |
3.55 |
651.37 |
This work |
3.5. Interference study
The ability of the sensor and the effect of some possible interfering species such as ascorbic acid (AA), glucose, uric acid (UA) and sucrose which are usually present in physiological samples were investigated by amperometric detection at −0.45 V vs. Ag|AgCl. The experiment was performed under continuous stirring deoxygenated 0.1 M PBS. As shown in Fig. 9, the reduction currents were evaluated by addition of 1 mM H2O2, 0.15 mM AA, 0.5 mM UA, 5 mM glucose and 1 mM sucrose. The concentrations of interferences were selected based on their levels of endogenous in the blood samples.49,50 Some species should be added to the solution in higher concentrations than that of H2O2 (1 mM) so the electrode provides significant response to interferences (S/N = 3). The responses of electrode to interferences may be insignificant at low concentrations and it may be concluded that the electrode has not response to these materials but in blood the concentration is higher than 1 mM and at this concentration, the electrode may shows reasonable response to interferences material. So, the higher concentrations of interferences (>1 mM) are selected so that the real conditions are simulated to investigate the applicability of electrode in real samples. In other hand, the concentration of H2O2 is selected 1 mM to show the sensitivity of electrode to low concentration of it. The results show that the reduction currents decreases by addition of H2O2 and no interference could be observed by other electroactive interferences.
 |
| Fig. 9 Amperometric response of Ag/ACPE to addition of 1 mM H2O2 (three additions), 0.5 mM UA, 0.15 mM AA, 5 mM glucose, 1 mM sucrose and 1 mM H2O2 (two additions) at −0.45 V vs. Ag|AgCl in a continuous stirred and deoxygenated 0.1 M PBS (pH 7.0). | |
4. Conclusions
NaA nanozeolite was synthesized from amorphous silica which was extracted from slag in low temperature without organic additives. Then, modified carbon paste electrode based on Ag-doped NaA nanozeolite was prepared to investigate the electrocatalytic reduction of H2O2 using CV and amperometric detection. At the surface of modified electrode and in the presence of H2O2, decreases in overpotential of H2O2 reduction as well as increase in the reduction current are observed. The prepared sensor has a low detection limit, high sensitivity, wide linear ranges and fast response time in determination of H2O2. Although the Ag/ACPE electrode shows electrocatalytic activity toward H2O2 reduction, it has no responses to other electroactive interferences which are usually present in physiological samples such as AA, UA, glucose and sucrose.
References
- Y. Usui, K. Sato and M. Tanaka, Catalytic dihydroxylation of olefins with hydrogen peroxide: an organic-solvent- and metal-free system, Angew. Chem., Int. Ed., 2003, 42(45), 5623–5625 CrossRef CAS PubMed.
- X. Huang, C. S. Atwood, M. A. Hartshorn, G. Multhaup, L. E. Goldstein and R. C. Scarpa, et al., The A beta peptide of Alzheimer's disease directly produces hydrogen peroxide through metal ion reduction, Biochemistry, 1999, 38(24), 7609–7616 CrossRef CAS PubMed.
- P. Niethammer, C. Grabher, A. T. Look and T. J. Mitchison, A tissue-scale gradient of hydrogen peroxide mediates rapid wound detection in zebrafish, Nature, 2009, 459(7249), 996–999 CrossRef CAS PubMed.
- B. Haghighi, H. Hamidi and L. Gorton, Formation of a robust and stable film comprising ionic liquid and polyoxometalate on glassy carbon electrode modified with multiwalled carbon nanotubes: toward sensitive and fast detection of hydrogen peroxide and iodate, Electrochim. Acta, 2010, 55(16), 4750–4757 CrossRef CAS.
- C. P. Lu, C. T. Lin, C. M. Chang, S. H. Wu and L. C. Lo, Nitrophenylboronic acids as highly chemoselective probes to detect hydrogen peroxide in foods and agricultural products, J. Agric. Food Chem., 2011, 59(21), 11403–11406 CrossRef CAS PubMed.
- K. Schliefer and G. Heidemann, Investigation into the tendering mechanism in the peroxide bleaching of cotton caused by impurities containing catalysts, Melliand Textilber. Int., 1989, 70(11), 856–864 Search PubMed.
- M. Yamamoto, M. Nishioka and M. Sadakata, Sterilization by H2O2 droplets under corona discharge, J. Electrost., 2002, 55(2), 173–187 CrossRef CAS.
- W. R. Baeyens, K. Nakashima, K. Imai, B. L. Ling and Y. Tsukamoto, Development of chemiluminescence reactions in biomedical analysis, J. Pharm. Biomed. Anal., 1989, 7(4), 407–412 CrossRef CAS PubMed.
- M. A. Reddy, M. S. Kishore, V. Pralong, V. Caignaert, U. V. Varadaraju and B. Raveau, Electrochemical performance of VOMoO 4 as negative electrode material for Li ion batteries, J. Power Sources, 2007, 168(2), 509–512 CrossRef CAS.
- R. K. Raman and A. K. Shukla, A direct borohydride/hydrogen peroxide fuel cell with reduced alkali crossover, Fuel Cells, 2007, 7(3), 225–231 CrossRef CAS.
- R. Toniolo, P. Geatti, G. Bontempelli and G. Schiavon, Amperometric monitoring of hydrogen peroxide in workplace atmospheres by electrodes supported on ion-exchange membranes, J. Electroanal. Chem., 2001, 514(1), 123–128 CrossRef CAS.
- E. Kurowska, A. Brzozka, M. Jarosz, G. D. Sulka and M. Jaskuła, Silver nanowire array sensor for sensitive and rapid detection of H2O2, Electrochim. Acta, 2013, 104, 439–447 CrossRef CAS.
- N. V. Klassen, D. Marchington and H. C. McGowan, H2O2 determination by the I3-method and by KMnO4 titration, Anal. Chem., 1994, 66(18), 2921–2925 CrossRef CAS.
- R. C. Matos, E. O. Coelho, C. F. Souza, F. A. Guedes and M. A. Matos, Peroxidase immobilized on Amberlite IRA-743 resin for on-line spectrophotometric detection of hydrogen peroxide in rainwater, Talanta, 2006, 69(5), 1208–1214 CrossRef CAS PubMed.
- T. Taniai, A. Sakuragawa and T. Okutani, Fluorometric Determination of Hydrogen Peroxide in Natural Water Samples by Flow Injection Analysis with a Reaction Column of Peroxidase Immobilized onto Chitosan Beads, Anal. Sci., 1999, 15(11), 1077–1082 CrossRef CAS.
- A. Tahirovic, A. Copra, E. Omanovic-Miklicanin and K. Kalcher, A chemiluminescence sensor for the determination of hydrogen peroxide, Talanta, 2007, 72(4), 1378–1385 CrossRef CAS PubMed.
- U. Pinkernell, S. Effkemann and U. Karst, Simultaneous HPLC determination of peroxyacetic acid and hydrogen peroxide, Anal. Chem., 1997, 69(17), 3623–3627 CrossRef CAS PubMed.
- X. Kang, J. Wang, H. Wu, I. A. Aksay, J. Liu and Y. Lin, Glucose oxidase-graphene-chitosan modified electrode for direct electrochemistry and glucose sensing, Biosens. Bioelectron., 2009, 25(4), 901–905 CrossRef CAS PubMed.
- S. Yang, W. Z. Jia, Q. Y. Qian, Y. G. Zhou and X. H. Xia, Simple approach for efficient encapsulation of enzyme in silica matrix with retained bioactivity, Anal. Chem., 2009, 81(9), 3478–3484 CrossRef CAS PubMed.
- S. Pourbeyram, Electrocatalytic determination of H2O2 on the electrode modified by LBL assembly of polyoxometalates via zirconium ion glue, Sens. Actuators, B, 2014, 192, 105–110 CrossRef CAS.
- S. Guo, D. Wen, S. Dong and E. Wang, Gold nanowire assembling architecture for H2O2 electrochemical sensor, Talanta, 2009, 77(4), 1510–1517 CrossRef CAS PubMed.
- C. M. Welch, C. E. Banks, A. O. Simm and R. G. Compton, Silver nanoparticle assemblies supported on glassy-carbon electrodes for the electro-analytical detection of hydrogen peroxide, Anal. Bioanal. Chem., 2005, 382(1), 12–21 CrossRef CAS PubMed.
- C. I. Fort, L. C. Cotet, V. Danciu, G. L. Turdean and I. C. Popescu, Iron doped carbon aerogel-new electrode material for electrocatalytic reduction of H2O2, Mater. Chem. Phys., 2013, 138(2), 893–898 CrossRef CAS.
- D. Gligor, A. Maicaneanu and A. Walcarius, Iron-enriched natural zeolite modified carbon paste electrode for H2O2 detection, Electrochim. Acta, 2010, 55(12), 4050–4056 CrossRef CAS.
- J. B. Raoof, N. Azizi, R. Ojani, S. Ghodrati, M. Abrishamkar and F. Chekin, Synthesis of ZSM-5 zeolite: electrochemical behavior of carbon paste electrode modified with Ni(II)–zeolite and its application for electrocatalytic oxidation of methanol, Int. J. Hydrogen Energy, 2011, 36(20), 13295–13300 CrossRef CAS.
- S. N. Azizi, S. Ghasemi and E. Chiani, Nickel/mesoporous silica (SBA-15) modified electrode: an effective porous material for electrooxidation of methanol, Electrochim. Acta, 2013, 88, 463–472 CrossRef CAS.
- A. Babaei, B. Khalilzadeh and M. Afrasiabi, A new sensor for the simultaneous determination of paracetamol and mefenamic acid in a pharmaceutical preparation and biological samples using copper(II) doped zeolite modified carbon paste electrode, J. Appl. Electrochem., 2010, 40(8), 1537–1543 CrossRef CAS.
- A. Walcarius, B. Marouf, A. M. Lamdaouar, K. Chlihi and J. Bessiere, Sulfidation of lead-loaded zeolite microparticles and flotation by amylxanthate, Langmuir, 2006, 22(4), 1671–1679 CrossRef CAS PubMed.
- D. W. Breck, Zeolite Molecular Sieves: Structure, Chemistry and Use, John Wiley and Sons, New York, 1974 Search PubMed.
- H. Yan, C. Xue-min, L. P. Liu, X. D. Liu and J. Y. Chen, The hydrothermal transformation of solid geopolymers into zeolites, Microporous Mesoporous Mater., 2012, 161, 187–192 CrossRef CAS.
- T. Montanari, I. Salla and G. Busca, Adsorption of CO on LTA zeolite adsorbents: an IR investigation, Microporous Mesoporous Mater., 2008, 109(1), 216–222 CrossRef CAS.
- S. N. Azizi, S. Ghasemi and H. Yazdani-Sheldarrei, Synthesis of mesoporous silica (SBA-16) nanoparticles using silica extracted from stem cane ash and its application in electrocatalytic oxidation of methanol, Int. J. Hydrogen Energy, 2013, 38(29), 12774–12785 CrossRef CAS.
- S. N. Azizi, A. R. Dehnavi and A. Joorabdoozha, Synthesis and characterization of LTA nanozeolite using barley husk silica: mercury removal from standard and real solutions, Mater. Res. Bull., 2013, 48(5), 1753–1759 CrossRef CAS.
- M. Aarabi-Karasgani, F. Rashchi, N. Mostoufi and E. Vahidi, Leaching of vanadium from LD converter slag using sulfuric acid, Hydrometallurgy, 2010, 102(1), 14–21 CrossRef CAS.
- U. Kalapathy, A. Proctor and J. Shultz, A simple method for production of pure silica from rice hull ash, Bioresour. Technol., 2000, 73(3), 257–262 CrossRef CAS.
- M. M. J. Treacy and J. B. Higgins, Collection of Simulated
XRD Powder Patterns for Zeolites, Elsevier, Amsterdam, 4 edn, 2001 Search PubMed.
- S. Markovic, V. Dondur and R. Dimitrijevic, FTIR spectroscopy of framework aluminosilicate structures: carnegieite and pure sodium nepheline, J. Mol. Struct., 2003, 654(1), 22334 Search PubMed.
- Z. Ghasemi and H. Younesi, Preparation and characterization of nanozeolite NaA from rice husk at room temperature without organic additives, J. Nanomater., 2011, 1–8 CrossRef.
- H. Katsuki and S. Komarneni, Synthesis of Na–A and/or Na–X zeolite/porous carbon composites from carbonized rice husk, J. Solid State Chem., 2009, 182(7), 1749–1753 CrossRef CAS.
- J. B. Raoof, R. Ojani, E. Hasheminejad and S. Rashid-Nadimi, Electrochemical synthesis of Ag nanoparticles supported on glassy carbon electrode by means of p-isopropyl calix [6] arene matrix and its application for electrocatalytic reduction of H2O2, Appl. Surf. Sci., 2012, 258(7), 2788–2795 CrossRef CAS.
- S. Thiagarajan, B. W. Su and S. M. Chen, Nano TiO2–Au–KI film sensor for the electrocatalytic oxidation of hydrogen peroxide, Sens. Actuators, B, 2009, 136(2), 464–471 CrossRef CAS.
- W. Zhao, H. Wang, X. Qin, X. Wang, Z. Zhao and Z. Miao, et al., A novel nonenzymatic hydrogen peroxide sensor based on multi-wall carbon nanotube/silver nanoparticle nanohybrids modified gold electrode, Talanta, 2009, 80(2), 1029–1033 CrossRef CAS PubMed.
- M. Honda, T. Kodera and H. Kita, Electrochemical behavior of H2O2 at Ag in HClO4 aqueous solution, Electrochim. Acta, 1986, 31(3), 377–383 CrossRef CAS.
- S. N. Azizi, S. Ghasemi and S. Kavian, Synthesis and characterization of NaX nanozeolite using stem sweep as silica source and application of Ag-modified nanozeolite in electrocatalytic reduction of H2O2, Biosens. Bioelectron., 2014, 62, 1–7 CrossRef CAS PubMed.
- R. S. Nicholson and I. Shain, Theory of stationary electrode polarography. Single scan and cyclic methods applied to reversible, irreversible, and kinetic systems, Anal. Chem., 1964, 36(4), 706–723 CrossRef CAS.
- E. Laviron, The use of linear potential sweep voltammetry and of ac voltammetry for the study of the surface electrochemical reaction of strongly adsorbed systems and of redox modified electrodes, J. Electroanal. Chem. Interfacial Electrochem., 1979, 100(1), 263–270 CrossRef CAS.
- H. Luo, Z. Shi, N. Li, Z. Gu and Q. Zhuang, Investigation of the electrochemical and electrocatalytic behavior of single-wall carbon nanotube film on a glassy carbon electrode, Anal. Chem., 2001, 73(5), 915–920 CrossRef CAS PubMed.
- L. Fotouhi, A. B. Hashkavayi and M. M. Heravi, Interaction of sulfadiazine with DNA on a MWCNT modified glassy carbon electrode: determination of DNA, Int. J. Biol. Macromol., 2013, 53, 101–106 CrossRef CAS PubMed.
- S. Hrapovic, Y. Liu, K. B. Male and J. H. Luong, Electrochemical biosensing platforms using platinum nanoparticles and carbon nanotubes, Anal. Chem., 2004, 76(4), 1083–1088 CrossRef CAS PubMed.
- J. Wang, Electrochemical glucose biosensors, Chem. Rev., 2008, 108(2), 814–825 CrossRef CAS PubMed.
- W. Lian, L. Wang, Y. Song, H. Yuan, S. Zhao and P. Li, et al., A hydrogen peroxide sensor based on electrochemically roughened silver electrodes, Electrochim. Acta, 2009, 54(18), 4334–4339 CrossRef CAS.
- D. H. Lin, Y. X. Jiang, Y. Wang and S. G. Sun, Silver nanoparticles confined in SBA-15 mesoporous silica and the application as a sensor for detecting hydrogen peroxide, J. Nanomater., 2008, 2008(12), 1–10 Search PubMed.
Footnote |
† Electronic supplementary information (ESI) available. See DOI: 10.1039/c6ra06724g |
|
This journal is © The Royal Society of Chemistry 2016 |
Click here to see how this site uses Cookies. View our privacy policy here.