DOI:
10.1039/C6RA06624K
(Communication)
RSC Adv., 2016,
6, 47443-47453
Correlations between crystal structure and dielectric properties of high-Q materials in rock-salt structure Li2O–MgO–BO2 (B = Ti, Sn, Zr) systems at microwave frequency
Received
12th March 2016
, Accepted 9th May 2016
First published on 9th May 2016
Abstract
A series of ultra-low loss microwave dielectric materials Li2O–MgO–BO2 (B = Ti, Sn, Zr) were prepared by the conventional solid-state method. The Li2O–MgO–BO2 (B = Ti, Sn, Zr) ceramics with nearly full density were sintered at a range of 1320 °C to 1520 °C for 4 h with excellent microwave properties of dielectric constants of 14.42 (at 9.14 GHz), 10.04 (at 11.05 GHz), 12.17 (at 10.2 GHz), Qf values of 15.3 × 10⁴ GHz, 14.5 × 10⁴ GHz, 11.3 × 10⁴ GHz and temperature coefficient (τf) values of −11.07, −14.15, −17.13 ppm °C−1. During the entire range of sintering temperatures a single phase of rock-salt structure Li2O–MgO–BO2 (B = Ti, Sn, Zr) ceramics could be obtained and then structural parameters such as the packing fraction and B-site octahedral distortions due to B-site cations were investigated to be associated with microwave properties based on Rietveld refinements. Based on the Raman spectrum for B = Ti, Zr, Sn ions the Raman shifts were assigned to be 478.91 cm−1, 479.17 cm−1, and 479.3 cm−1 and the FWHM values were 10.97 cm−1, 11.82 cm−1, and 11.28 cm−1 correspondingly. The dielectric constants showed an inverse correlation with Raman shifts of vibration modes and an inverse correlation also existed between the FWHM and dielectric loss. Moreover, based on the complex bond theory the crystalline structure refinement, chemical bond ionicity, and lattice energy were calculated to evaluate the correlations between the crystalline structure and dielectric properties.
1. Introduction
Microwave dielectric materials have attracted increasing interest because of their potential applications in mobile and satellite communications. Specifically, they have been investigated as various components for wireless communications, including duplexers, resonators, antennas, and oscillators.1–3 The dielectric materials available for microwave devices are required to show predictable properties with respect to higher dielectric constant (εr), higher quality factor (Qf), and a near-zero temperature coefficient of the resonant frequency (τf). These parameters are correlated with the properties of microwave devices such as the size, frequency selectivity and temperature stability of a system. At present, many dielectric materials with excellent microwave dielectric properties have been reported.4–9 Among several kinds of dielectric ceramics, a series of compounds based on the Li2O–MgO–TiO2 system were reported for the possible use in microwave applications.10–14 For example, a cubic spinel Li2MgTi3O8 that satisfied the requirements was reported by George et al.10 The ceramics exhibited good dielectric properties with εr = 27.2, Qf = 42![[thin space (1/6-em)]](https://www.rsc.org/images/entities/char_2009.gif) 000 GHz, τf = 3.2 ppm °C−1. It was also claimed that the same family of materials Li2Mg1−xZnxTi3O8 and Li2A1−xCaxTi3O8 (A = Mg, Zn) showed good microwave dielectric properties.11 With partial replacement of Mg by Zn, Li2(Mg0.94Zn0.06)Ti3O8 ceramics exhibited good microwave dielectric properties of εr = 27.1, Qf = 44800 GHz, τf = 1.9 ppm °C−1.12
000 GHz, τf = 3.2 ppm °C−1. It was also claimed that the same family of materials Li2Mg1−xZnxTi3O8 and Li2A1−xCaxTi3O8 (A = Mg, Zn) showed good microwave dielectric properties.11 With partial replacement of Mg by Zn, Li2(Mg0.94Zn0.06)Ti3O8 ceramics exhibited good microwave dielectric properties of εr = 27.1, Qf = 44800 GHz, τf = 1.9 ppm °C−1.12
In addition, the rock-salt structure Li2Mg3BO6 (B = Ti, Zr, Sn) materials based on Li2O–MgO–TiO2 system, were firstly reported about the correlations between sintering characteristics and microwave properties.15,16 In these research three kinds of promising ceramics Li2Mg3TiO6, Li2Mg3SnO6 and Li2Mg3ZrO6 sintered at 1280 °C, 1360 °C and 1380 °C possessed out-bound microwave dielectric properties: εr = 15.2, 8.8 and 12.6, Q × f = 152000 GHz (at 8.3 GHz), 123000 GHz (at 10.7 GHz) and 86000 GHz (at 9.3 GHz), and τf = −39 ppm °C−1, −32 ppm °C−1 and −36 ppm °C−1, respectively. However, in these reports the microwave dielectric properties of Li2Mg3BO6 (B = Ti, Zr, Sn) compounds were deteriorated due to the second phases caused by lithium evaporation. In addition, the origin of intrinsic factors between crystal structure and properties should be further investigated and the mechanism should be clarified due to the difference of B-site ions in Li2Mg3BO6 (B = Ti, Zr, Sn) compounds.
In the crystal structure of Li2Mg3BO6 (B = Ti, Zr, Sn) compounds with Fm3m space group (225), all the B-site (Ti4+, Zr4+, Sn4+) cations coordinate with oxygen anions in a mode of octahedral structure, occupy the 4a Wyckoff positions. The different B-site (Ti4+, Zr4+, Sn4+) cations are incorporated in the same structure, bond length and strength are changed due to the interactions with their surrounding atoms. These interactions lead to crystal structural modifications and determine the physical properties of materials. Relationships between atomic interactions and bond characteristics, such as bond length, bond energy, bond iconicity, etc., can be evaluated quantitatively by the chemical bond theory. The parameters, including crystalline structure refinement, chemical bond ionicity and lattice energy, are investigated for Li2Mg3BO6 (B = Ti, Zr, Sn) ceramics based on the complex bond theory.
2. Experimental procedure
The samples were prepared by the conventional solid-state reaction method from oxide powders (analytical-grade Li2CO3, MgO, TiO2, SnO2 and ZrO2; Kojundo Chemical Laboratory Co., Ltd Saitama, Japan). The raw materials were mixed according to the formula of Li2Mg3BO6 (B = Ti, Zr, Sn). The mixed powders were milled for 4 h with distilled water in a nylon container with ZrO2 balls. All the slurries were dried and calcined at 1000–1200 °C for 4 h. The powders were then mixed with polyvinyl alcohol as a binder, granulated and pressed into cylindrical disks of 10 mm diameter and about 5 mm height at a pressure of about 200 MPa. These pellets were preheated at 600 °C for 4 h to expel the binder and then sintered at 1350–1550 °C for 4 h in air at a heating rate of 5 °C min−1 for the optimum sintering temperature of Li2Mg3BO6 (B = Ti, Zr, Sn) with nearly full densification. In order to suppress the lithium evaporation, all the pellets were buried in sacrificial powders of the same composition on a piece of platinum (Pt) foil. The Pt foil tray with the pellets and muffling powders were placed in an alumina crucible together with a small amount of additional sacrificial powder. Finally the crucible was covered tightly with a flat lid.
Phase analysis of samples was conducted with the help of a Rigaku diffractometer (Model D/MAX-B, Rigaku Co., Japan) using Ni filtered CuKα radiation (λ = 0.1542 nm) at 40 kV and 40 mA settings. Rietveld refinements of the crystal structures were performed using the fullpro program. The reliability of the refinement result was judged by the pattern R factor (Rp), the weighted pattern R factor (Rwp) and the goodness of fit indicator (χ2). The zero shift, individual scale factor, unit-cell parameters, and phase profile parameters (U, V, and W) along with symmetry parameter were refined until the apparent convergence of XRD patterns was reached. Based on XRD analysis, the morphology and particle sizes were examined using a transmission electron microscopy (Model JEOL JEM-2010, FEI Co., Japan). The apparent densities of the sintered pellets were measured use the Archimedes method (Mettler ToledoXS64). To examine the relative density of the sample, the theoretical density was obtained from the crystal structure and atomic weight.17 The network analyzer (N5234A, Agilent Co., America) was used for the measurement of microwave dielectric properties. Dielectric constants were measured by exciting the TE011 resonant mode of dielectric resonator as suggested by Hakki and Coleman.18 Unloaded quality factors were measured using TE01d mode by the cavity method.19 All measurements were performed at room temperature in the frequency of 8–12 GHz. The temperature coefficient of the resonant frequency (τf) was calculated from data collected in the temperature range of 25–85 °C according to τf = Δf/(f0ΔT), where f0 was the corresponding frequency at 25 °C.
3. Results and discussion
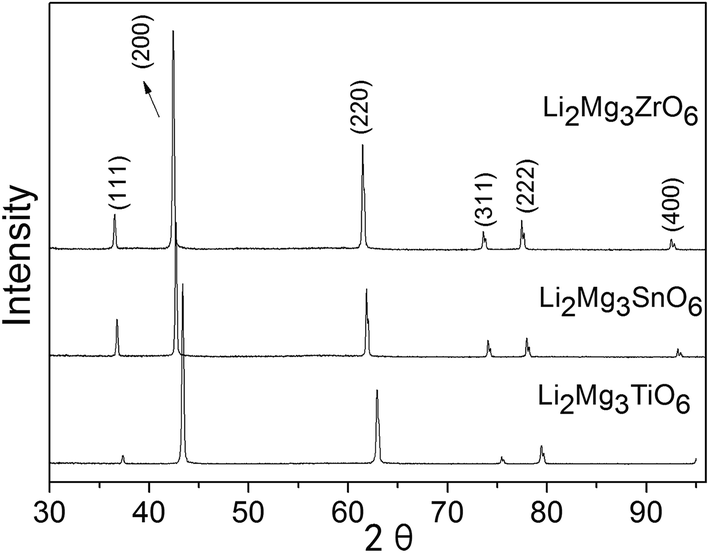
The precursor powders of Li2Mg3BO6 (B = Ti, Zr, Sn) compounds were firstly calcined at 1000 °C for 6 h and the XRD results were shown in Fig. 1. It was observed that the rock salt structure Li2Mg3BO6 (B = Ti, Zr, Sn) precursor could be obtained with single phase by the solid state reaction. Li2Mg3BO6 (B = Ti, Zr, Sn) ceramics were sintered at a temperature range of 1320 °C to 1520 °C for 4 h in order to obtain the densified samples. The samples were sintered at optimum temperatures with relative density more than 94% as listed in Table 1. In order to characterize the microstructure of Li2Mg3BO6 (B = Ti, Zr, Sn) ceramics sintered at optimum temperatures, SEM micrographs were illustrated in Fig. 2(a)–(c). It was easily found that nearly dense microstructure could be obtained at 1360 °C, 1420 °C, 1520 °C for 4 h according to the fracture surface of Li2Mg3BO6 (B = Ti, Zr, Sn) ceramics. P. Liu et al. also reported the similar SEM microstructure of Li2Mg3BO6 (B = Ti, Zr, Sn) ceramics with minor pores at optimum sintering temperatures.16
 |
| | Fig. 1 XRD patterns of Li2Mg3BO6 (B = Ti, Zr, Sn) precursors calcinated at different temperatures. | |
Table 1 Sintering temperature (S.T.), relative density (R.D.), polarizability (αD), packing fraction (P.F.) and microwave dielectric properties of Li2Mg3BO6 (B = Ti, Zr, Sn) compounds
| Formula |
S.T. (°C) |
R.D. |
αtheo |
Observed |
Δ (%) |
Qf (GHz) |
P.F.% |
τf (ppm °C−1) |
| εr |
V (Å3) |
Z |
αobs |
| Li2Mg3TiO6 |
1360/4 h |
94.1 |
21.35 |
14.42 |
73.14 |
0.5 |
28.54 |
25.19 |
15.3 × 10⁴ |
53.49 |
−11.07 |
| Li2Mg3SnO6 |
1520/4 h |
95.2 |
21.25 |
10.04 |
76.79 |
0.5 |
25.41 |
16.39 |
14.5 × 10⁴ |
51.24 |
−14.15 |
| Li2Mg3ZrO6 |
1420/4 h |
94.3 |
21.67 |
12.17 |
78.02 |
0.5 |
29.36 |
26.21 |
11.3 × 10⁴ |
50.56 |
−17.13 |
 |
| | Fig. 2 FE-SEM fracture micrographs of Li2Mg3BO6 (B = Ti, Zr, Sn) ceramics sintered at optimum temperatures for 4 h ((a)–(c) corresponding to Li2Mg3TiO6 at 1360 °C, Li2Mg3SnO6 at 1520 °C, Li2Mg3ZrO6 at 1420 °C). | |
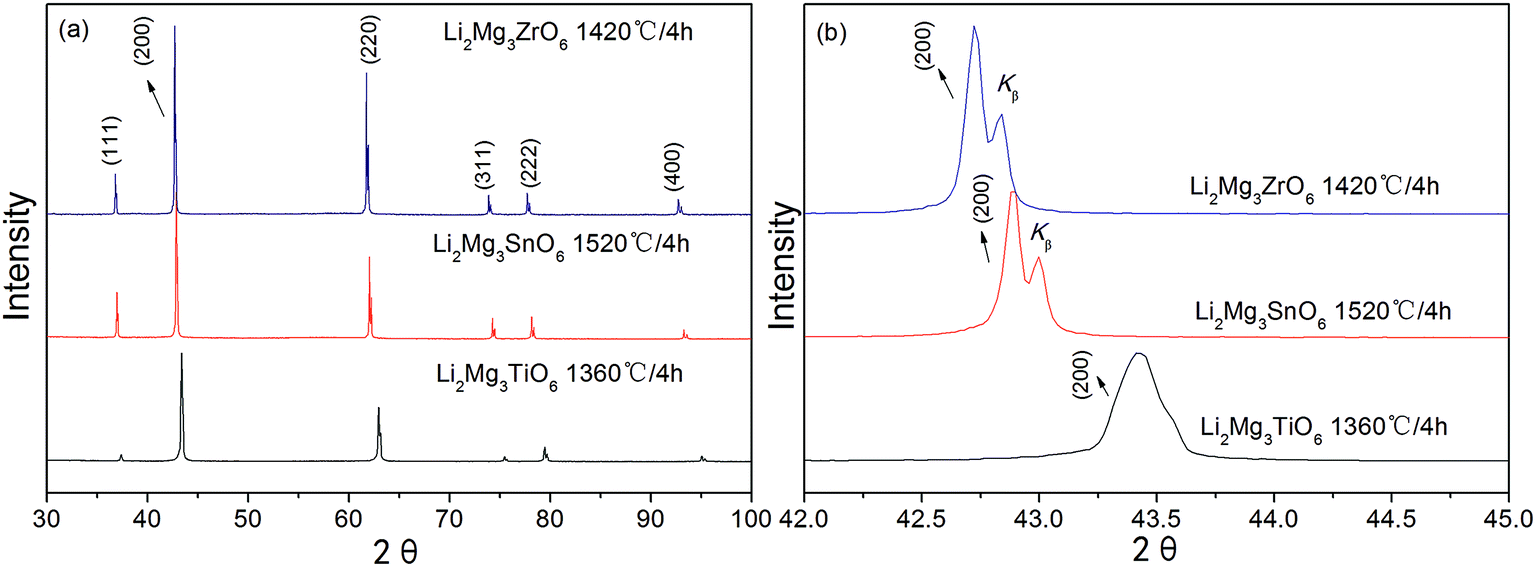
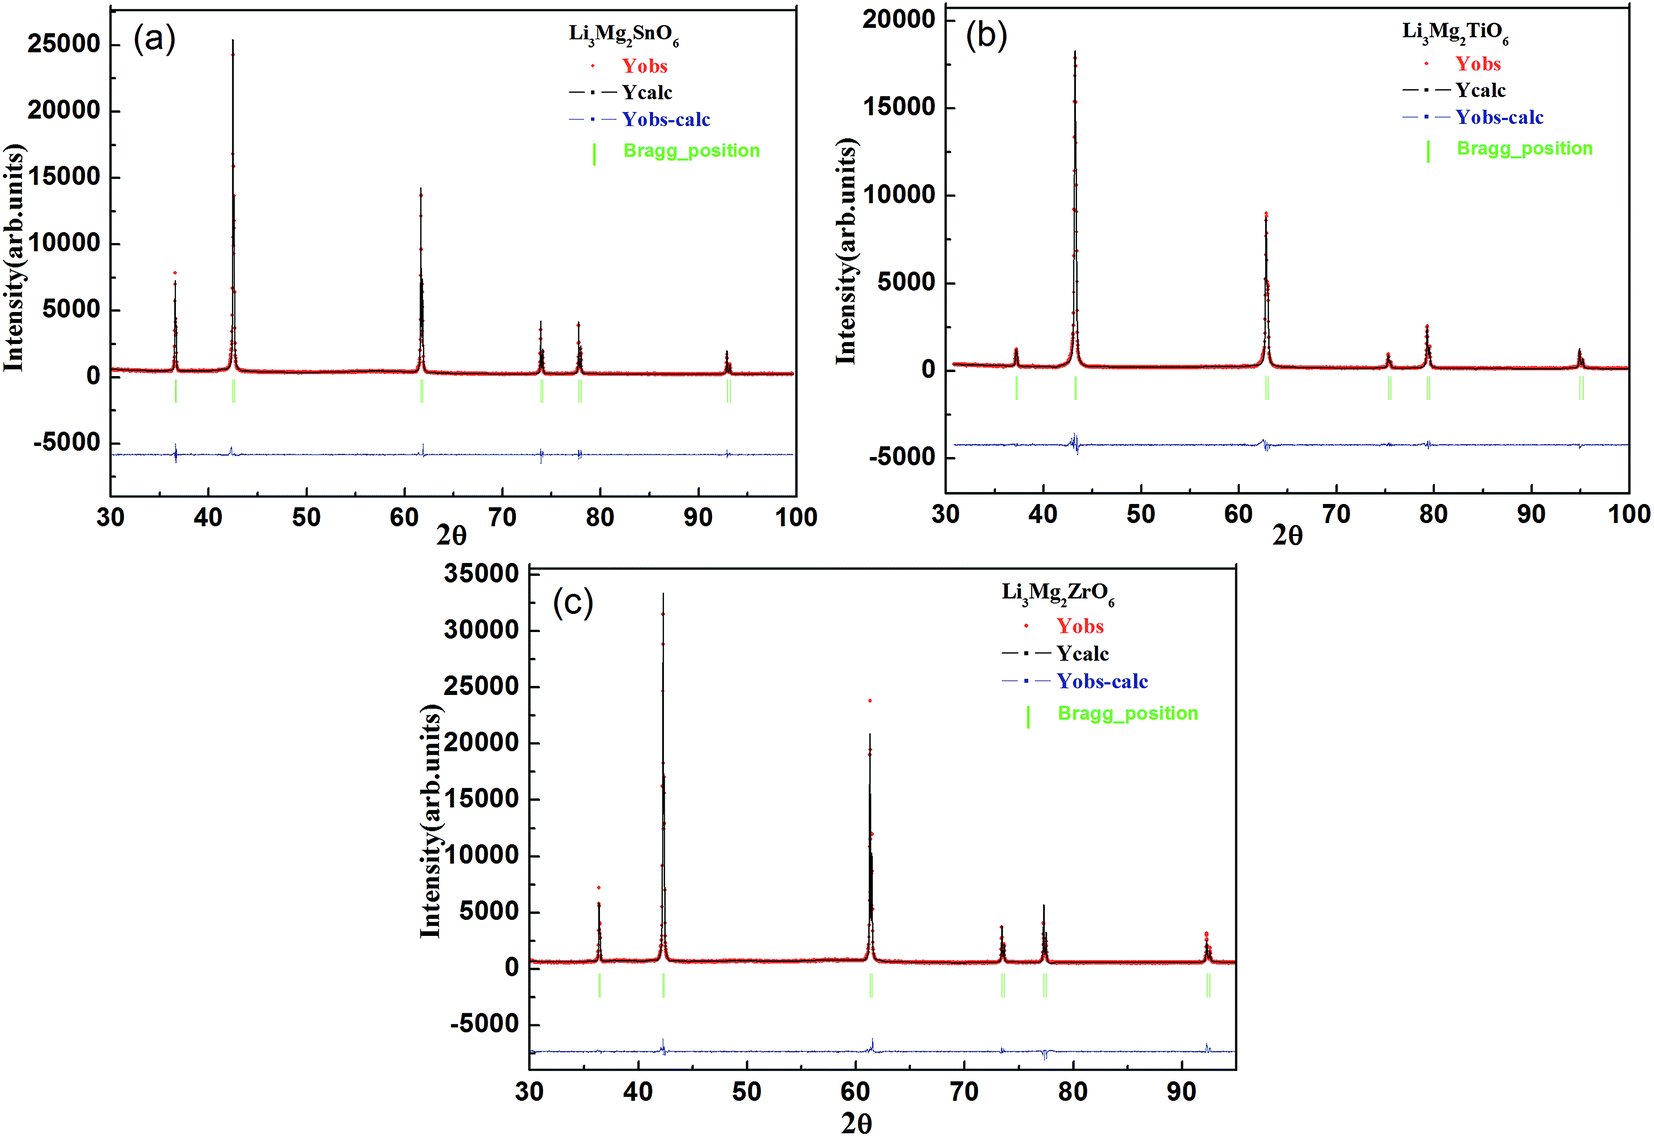
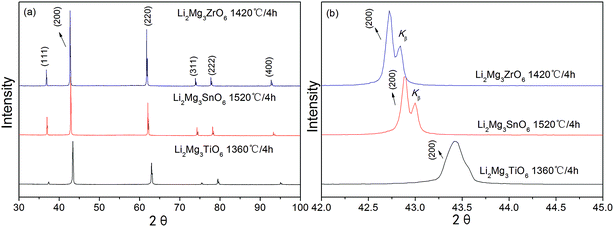
Fig. 3(a) showed the X-ray diffraction patterns of Li2Mg3BO6 (B = Ti, Zr, Sn) ceramics sintered at optimum temperature for 4 h. The pure phases of Li2Mg3BO6 (B = Ti, Zr, Sn) were obtained respectively and all these compounds showed the rock salt structure with a Fm![[3 with combining macron]](https://www.rsc.org/images/entities/char_0033_0304.gif) m space group (225). As a representative of crystal plane of (200), it was found that reflection shifted to lower angles as shown in Fig. 3(b). Rietveld refinement of Li2Mg3BO6 (B = Ti, Zr, Sn) ceramics was performed on all of these compounds as shown in Fig. 4(a)–(c) and the crystallographic parameters of refinement on Li2Mg3BO6 (B = Ti, Sn, Zr) ceramics were given in Table 2. According to the data in Table 2, it was found that bond lengths of B–O in Li2Mg3BO6 (B = Ti, Sn, Zr) compositions were significantly affected by the variation of B ions. With the increase of ions radius from Ti4+ to Zr4+ (rTi4+ = 0.605 Å, rSn4+ = 0.69 Å, rZr4+ = 0.72 Å), the lattice parameters and unit cell volume increased correspondingly as shown in Fig. 5. For example, the bond length of B–O(1) was 2.091 Å, 2.1252 Å, 2.1365 Å, corresponding to the increasing radius of B = Ti4+, Sn4+, Zr4+. As for unit cell volume, the values were 73.14 Å3, 76.79 Å3, 78.02 Å3 for B = Ti, Sn, Zr with the sequence of VTi < VSn < VZr.
m space group (225). As a representative of crystal plane of (200), it was found that reflection shifted to lower angles as shown in Fig. 3(b). Rietveld refinement of Li2Mg3BO6 (B = Ti, Zr, Sn) ceramics was performed on all of these compounds as shown in Fig. 4(a)–(c) and the crystallographic parameters of refinement on Li2Mg3BO6 (B = Ti, Sn, Zr) ceramics were given in Table 2. According to the data in Table 2, it was found that bond lengths of B–O in Li2Mg3BO6 (B = Ti, Sn, Zr) compositions were significantly affected by the variation of B ions. With the increase of ions radius from Ti4+ to Zr4+ (rTi4+ = 0.605 Å, rSn4+ = 0.69 Å, rZr4+ = 0.72 Å), the lattice parameters and unit cell volume increased correspondingly as shown in Fig. 5. For example, the bond length of B–O(1) was 2.091 Å, 2.1252 Å, 2.1365 Å, corresponding to the increasing radius of B = Ti4+, Sn4+, Zr4+. As for unit cell volume, the values were 73.14 Å3, 76.79 Å3, 78.02 Å3 for B = Ti, Sn, Zr with the sequence of VTi < VSn < VZr.
 |
| | Fig. 3 XRD patterns of Li2Mg3BO6 (B = Ti, Zr, Sn) ceramics (a) and the shiftment of crystal plane (200) with the variation of B ions radius (b). | |
 |
| | Fig. 4 Rietveld refinement plot of Li2Mg3BO6 (B = Ti, Zr, Sn) ceramics sintered at optimal temperatures for 4 h ((a)–(c) corresponding to Li2Mg3TiO6 at 1360 °C, Li2Mg3SnO6 at 1520 °C, Li2Mg3ZrO6 at 1420 °C). | |
Table 2 Crystallographic data from Rietveld refinement from Li2Mg3BO6 (B = Ti, Zr, Sn) ceramics
| Samples |
Li2Mg3TiO6 |
Li2Mg3SnO6 |
Li2Mg3ZrO6 |
| dLi–O |
2.091 |
2.1252 |
2.1365 |
| dMg–O |
2.091 |
2.1252 |
2.1365 |
| dB–O |
2.091 |
2.1252 |
2.1365 |
| α = β = γ |
90 |
90 |
90 |
| a = b = c (Å) |
2.091 |
2.1252 |
2.1365 |
| Unit-cell volume (Å3) |
73.14 |
76.79 |
78.02 |
| Rp |
0.133 |
0.147 |
0.148 |
| Rwp |
0.115 |
0.104 |
0.112 |
| Rexp |
0.067 |
0.065 |
0.073 |
 |
| | Fig. 5 Crystal parameters as a function of different B site ions. | |
The microwave dielectric properties of the Li2Mg3BO6 (B = Ti, Sn, Zr) samples with nearly full densities were also listed in Table 1. It was found that the Li2Mg3BO6 (B = Ti, Sn, Zr) compounds sintered at optimum temperatures possessed dielectric constants of 14.27, 10.8, 12.17, higher Qf values of 15.3 × 10⁴, 14.5 × 10⁴, 11.3 × 10⁴ GHz and temperature coefficient (τf) of −11.07, −14.15, −17.13 ppm °C−1. Compared with the results reported by P. Liu et al.,16 the microwave dielectric properties of Li2Mg3BO6 (B = Ti, Sn, Zr) samples were improved significantly due to the lack of second phases. Throughout all the samples of Li2Mg3BO6 (B = Ti, Sn, Zr) pure phase could be obtained without any impure phase like Mg2SnO4 or ZrO2 due to the suppression of lithium evaporation according to the XRD results shown in Fig. 3. It had been reported that the microwave dielectric properties were affected by many factors, which could be divided into the intrinsic loss and extrinsic loss. The extrinsic losses were usually dominated by second phases, oxygen vacancies, grain boundaries, and densification or porosity, while the intrinsic losses were mainly caused by crystal structure such as bond strength and bond energy.20,21 As is known, the impure phase would deteriorate the microwave properties of samples.
Generally, the microwave dielectric properties can be affected by the intrinsic factors such as lattice vibration and the extrinsic factors such as bulk density, secondary phase, grain size, and so on.22 As confirmed by Fig. 1 and Table 1, the specimens showed single phase and relative densities higher than 94% of the theoretical values. The influences of secondary phases and the density on dielectric properties could be neglected in this study. Therefore, the intrinsic loss was the predominant factor for Li2Mg3BO6 (B = Ti, Sn, Zr) compounds and the dielectric properties were strongly dependent on the composition of the materials, chemical nature of the constituent ions, the distance between cations and anions, and the structural characteristics originating from the bonding type.
The dielectric constant of samples usually depended on the density, molar volume and ionic polarizability of the constituent ions. As all the samples were observed to possess more than 94% theoretical density, the intrinsic loss would be the predominant factor for the dielectric constant of Li2Mg3BO6 (B = Ti, Sn, Zr). To clarify effects of crystal structure on dielectric constant of Li2Mg3BO6 (B = Ti, Sn, Zr) compounds, the conventional additive rules were firstly used to calculate theoretical ionic polarizability (αtheo) of composing ions or oxides suggested by Shannon23 according to the eqn (1). While the observed dielectric polarizability (αobs) was calculated by Clausius–Mossotti equation as formulated in eqn (2) with measured dielectric constant at microwave frequencies.24 The theoretical ionic polarizability (αtheo) theoretical dielectric polarizability (αtheo) of Li2Mg3BO6 (B = Ti, Sn, Zr) compounds were listed in Table 1.
| | |
αtheo = α(Li2Mg3BO6) = 2α(Li2+) + 3α(Mg2+) + α(B4+) + 6α(O2−)
| (1) |
| |
 | (2) |
where
α(Mg
2+),
α(Nb
5+),
α(O
2−), and
α(B
4+) represented ions polarizabilities reported by Shannon.
23 Moreover,
Vm,
ε and
b indicated the molar volume of samples, dielectric constant and constant value (4π/3), respectively.
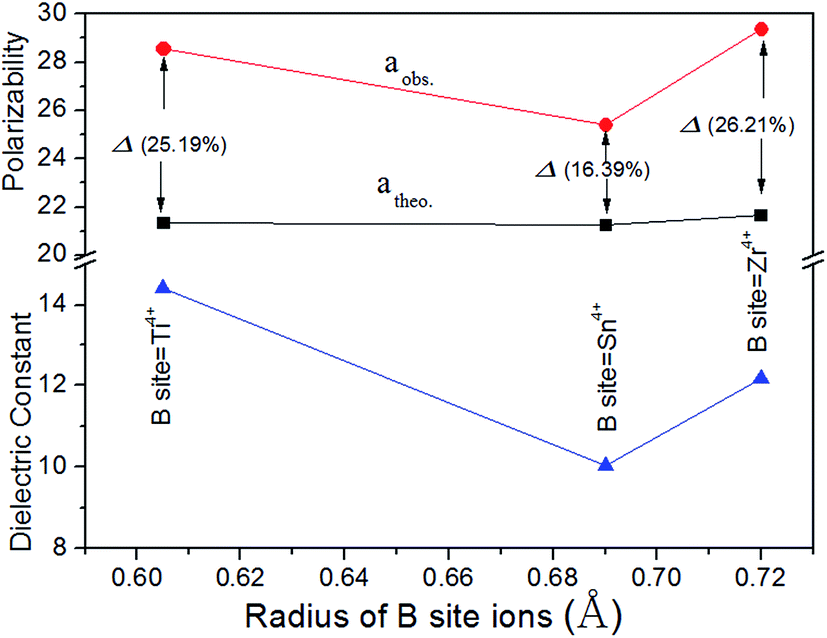
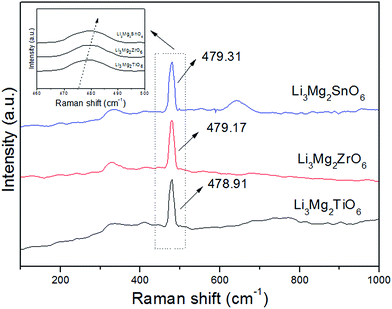
By comparison there was a significant discrepancy between the values of αtheo and αobs with a deviation of Δ (%) ≥ 25% (Δ (%) = |(αtheo − αobs)|/αobs × 100%) as shown in Fig. 6, and the major deviation from the αobs and αtheo could attribute to other factors suggested by Shannon.23 Shannon23 pointed out that large discrepancies between measured and estimated values could be an indication of “rattling” or “compressed” cations with correspondingly high or low polarizabilities, or the presence of dipolar impurities. The deviations in Li2Mg3BO6 (B = Ti, Sn, Zr) samples were possibly caused by “structural changes”, such as local atomic motion or polyhedral distortion. In addition, P. Liu also firstly found the same phenomenon in Li2Mg3BO6 (B = Ti, Sn, Zr) samples.16 As was known to all, Raman spectra could effectively reflect the polarization characteristics of samples and were widely used to analyze the relationships between the lattice vibration modes and resonant patterns.25–29 The variations of Raman shift and the full-width-at-half-maximum (FWHM) were two important fingerprints in investigating the correlation between crystal structure and dielectric properties of the ceramics. The Raman spectra of Li2Mg3BO6 (B = Ti, Sn, Zr) samples were shown in Fig. 7 and the inset was the shift of vibration modes. Owing to the high symmetry, throughout the total frequency range of 200–1000 cm−1 only one significant Raman peak was found and located at around ≈478 cm−1 associated with the lattice vibration. For B = Ti, Zr, Sn ions the Raman shifts were assigned to be 478.91 cm−1, 479.17 cm−1, 479.3 cm−1 and the FWHM values were 10.97 cm−1, 11.82 cm−1, 11.28 cm−1 correspondingly. The variation of the dielectric constant as a function of Raman shifts was plotted as shown in Fig. 8. It was found that dielectric constants showed an inverse correlation with Raman shifts of vibration modes. Higher polarizability was corresponding to lower Raman shift based on Fig. 8. The similar phenomena in other ceramics like Ba[Mg(1−x)/3ZrxTa2(1−x)/3]O3 solid solutions and were reported and dielectric constants had inverse correlation with Raman shifts of A1g(O) phonon modes.27 Therefore Raman shifts could be used to predict the variation of dielectric constant of Li2Mg3BO6 (B = Ti, Sn, Zr) samples.
 |
| | Fig. 6 Theoretical, observed dielectric polarizability and dielectric constant as a function of radius of B-site ions. | |
 |
| | Fig. 7 Raman spectra of Li2Mg3BO6 (B = Ti, Zr, Sn) ceramics. | |
 |
| | Fig. 8 Correlations between the Raman shift, dielectric constant of Li2Mg3BO6 (B = Ti, Zr, Sn) ceramics. | |
The Qf values were mainly affected by the intrinsic losses of the ceramics such as bond strength (s), bond valence (V) and octahedral distortion (δ) reported elsewhere.22,30 Based on the refinement of Li2Mg3BO6 (B = Ti, Sn, Zr) compounds, the bond parameters such as bond strength (s) and bond valence (V), octahedral distortion (δ) were summarized as shown in Table 3. These parameters were also believed to be correlated with the microwave properties. Bond strength (s) and bond valence (V), octahedral distortion (δ) of Li2Mg3BO6 (B = Ti, Sn, Zr) compounds were calculated according to the following eqn (3)–(6).31
| |
 | (3) |
| |
 | (4) |
| |
 | (5) |
| |
 | (6) |
Table 3 Bond strength (s) and bond valence (V), octahedral distortion (δ) from Rietveld refinement from Li2Mg3BO6 (B = Ti, Zr, Sn) ceramics
| Compounds |
Bond type |
d |
d0 |
s |
δ (10−4) |
V |
| Li2Mg3TiO6 |
Li–O |
2.091 |
1.466 |
0.141 |
0.000 |
1.312 |
| Mg–O |
2.091 |
1.693 |
0.282 |
0.000 |
2.422 |
| Ti–O |
2.091 |
1.815 |
0.563 |
0.000 |
3.369 |
| Li2Mg3SnO6 |
Li–O |
2.1252 |
1.466 |
0.219 |
−0.002 |
1.064 |
| Mg–O |
2.1252 |
1.693 |
0.316 |
−0.002 |
1.965 |
| Sn–O |
2.1252 |
1.905 |
0.633 |
−0.002 |
3.485 |
| Li2Mg3ZrO6 |
Li–O |
2.1365 |
1.466 |
0.158 |
0.003 |
1.032 |
| Mg–O |
2.1365 |
1.693 |
0.316 |
0.003 |
1.907 |
| Zr–O |
2.1365 |
1.928 |
0.633 |
0.003 |
3.598 |
In eqn (8)–(10), Ravg is the average bond length between the B-site cation and oxygen ion, R1 and N are constants for the cation–oxygen ion bond valence curves from Brown's report,32 dij is the bond valence parameter in Brese's report,33 dij is the bond length between the B-site cations and oxygen ions calculated using the Rietveld method, and b is generally taken to be a universal constant equal to 0.37 Å. The curves of Qf values depending on bond valence (V) was plotted in Fig. 9. For Li2Mg3BO6 (B = Ti, Sn, Zr) compounds the Qf values were 15.3 × 10⁴, 14.5 × 10⁴, 11.3 × 10⁴ GHz respectively and the bond valence (V) of B-site were corresponding to 3.369, 3.485, 3.598. The Qf value increased with the increase of B-site bond valence. The similar phenomena about the correlations between Qf values and bond valence (V) were also reported in other systems such as MgTiO3-based ceramics.22,30 Moreover, based on the Raman spectra of Li2Mg3BO6 (B = Ti, Sn, Zr) compounds in Fig. 7, FWHM values of vibration modes were obtained from the Lorentz fitting to be 10.97 cm−1, 11.82 cm−1, 11.28 cm−1 correspondingly. The relationship between the FWHM of vibration modes and dielectric loss was shown in Fig. 10. Dielectric loss increased with the sequence of B = Ti, Sn, Zr ions, while FWHM increased. An inverse correlation existed between the FWHM and dielectric loss. The results indicated that the dielectric loss was closely related to the FWHM, which were consistent with other reports.34,35
 |
| | Fig. 9 Variation of Qf values as a function of B site bond valence of Li2Mg3BO6 (B = Ti, Zr, Sn) ceramics. | |
 |
| | Fig. 10 Variation of Qf values as a function of FWHM based on Raman spectra of Li2Mg3BO6 (B = Ti, Zr, Sn) ceramics. | |
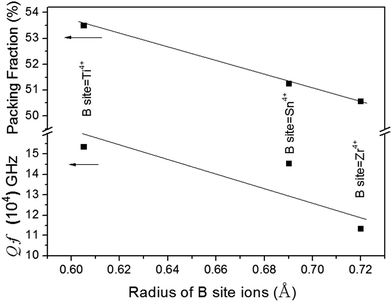
Kim et al.21 reported that Qf values were closely related to the packing fraction of the structure. With an increase in the packing fraction, the lattice vibrations decreased and then the Qf value would increase. In this work the packing fraction was dependent on the unit cell volume and calculated as listed in Table 1. The packing fraction was calculated using the following eqn (7), where Z was the number of formula units per unit cell. With the decreasing of the unit cell volume, the packing fraction would increase in Li2Mg3BO6 (B = Ti, Sn, Zr) compounds. The Qf values presented the positive correlation with the packing fraction as shown in Fig. 11. For Li2Mg3BO6 (B = Ti, Sn, Zr) compounds the Qf values were 15.3 × 10⁴, 14.5 × 10⁴, 11.3 × 10⁴ GHz respectively and was corresponding to 53.50%, 51.25%, 50.56% of PF values. The similar results were also reported by Liu et al.16
| |
 | (7) |
 |
| | Fig. 11 Variation of Qf values as a function of packing fraction of Li2Mg3BO6 (B = Ti, Zr, Sn) ceramics. | |
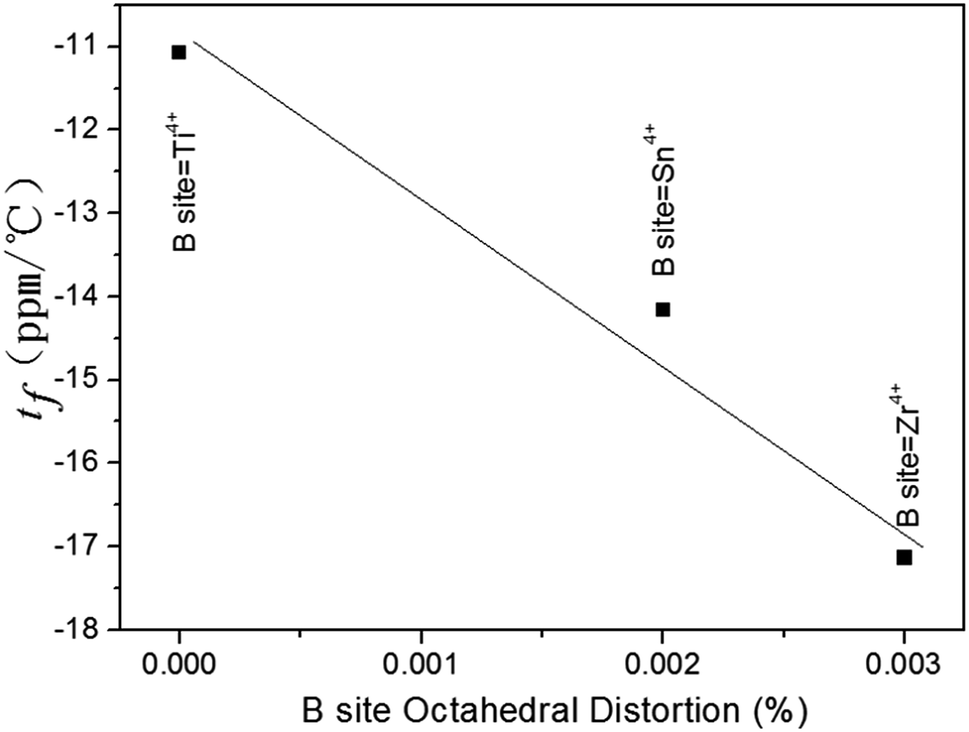
As for the temperature coefficient of the resonant frequency (τf), Kim et al.36 reported that the τf would depend on the average octahedral distortion in the compounds. The octahedral distortion (δ) was believed to be associated with τf values. Taking into account these variations in BO6 octahedra (B = Ti, Sn, Zr), the plot of the temperature coefficient of the resonant frequency (τf) as a function of B-site octahedral distortion was shown in Fig. 12. It was found that from Ti4+ to Zr4+, the distortion in the BO6 octahedra varied from 0% to 0.3%, and hence the τf values varied from −11.07 to −17.13 ppm °C−1. The variation in the B-site octahedral distortions and τf values of Li2Mg3BO6 (B = Ti, Sn, Zr) shown in Fig. 12 agreed well with the findings of Kim et al.36
 |
| | Fig. 12 Variation of τf values as a function of B-site octahedral distortion (δB) of Li2Mg3BO6 (B = Ti, Zr, Sn) crystal structure. | |
To further investigate the correlations between crystal structure and microwave properties quantitatively, the complex bond theory was used to explain the mechanism. For demonstration, a schematic representation of Li2Mg3BO6 supercell (2 × 2 × 2) was shown in Fig. 13. In the supercell, there was 0.5 Li2Mg3BO6 molecules per primitive cell and all the B-site (B = Ti, Sn, Zr) cations were octahedrally coordinated with oxygen anions, occupying the 4a and 4b Wyckoff positions. Due to the characteristics of crystal structure, the change of the oxygen octahedron could affect the microwave dielectric properties. With the variation of B4+ ions, the atomic interactions of Li2Mg3BO6 changed, which resulted in different bond length of the oxygen octahedron. As was known to all, the bond length of oxygen octahedron showed the close connection to the bond ionicity, lattice energy and the coefficient of thermal expansion, which played an important role in evaluating the Li2Mg3BO6 system. The difference of B ions had significant effect on the microwave dielectric properties of the Li2Mg3BO6 (B = Ti, Sn, Zr) compounds. Based on the crystallographic data and complex chemical bond theory, the complex crystals Li2Mg3BO6 could be decomposed into the sum of binary crystals as shown in eqn (8).
| | |
Li2Mg3BO6 → Li2O2 + Mg3O3 + BO
| (8) |
 |
| | Fig. 13 Schematic representation of rock salt structured Li2Mg3BO6 (3 × 3 × 3) supercell (a) and single B–O octahedral (b). | |
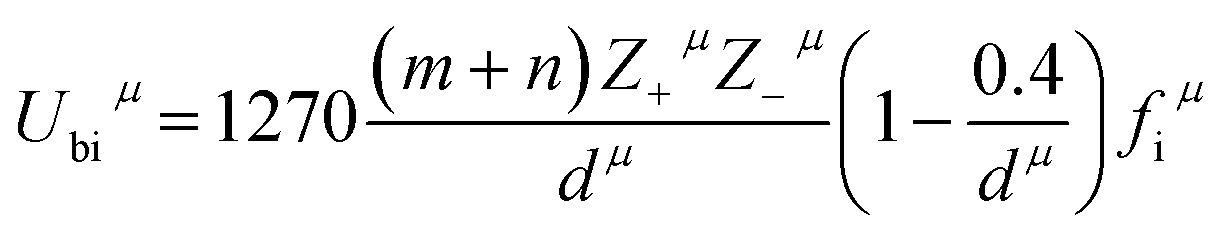
Three kinds of bonds such as B–O, Mg–O, and Li–O existed in the Li2Mg3BO6 system with the same coordination numbers for B, Mg, Li and O atoms. For example, the cations of B, Mg, Li were surrounded by six oxygen atoms, while O atoms were connected with six other cations. The valence electron numbers of cations in these bonds were known to be ZB = 4, ZLi = 1 and ZMg = 2, while the valence electron numbers of O2− anions mainly depended on charge balance for each sub-formula in different type bonds, where ZO = 4 in B–O bond, ZO = 2 in Mg–O bond and ZO = 1 in Li–O bond. Based on the coordination number and charge distribution of ions in the Li2Mg3BO6 system, here ZO = 8/3 in B–O bond, ZO = 4/3 in Mg–O bond and ZO = 2/3 in Li–O bond for effective valence electron numbers of O2− anions in every bond according to the rule of charge balance for each sub-formula. On the basis of generalized P–V–L theory, Zhang et al.37–39 firstly reported that the lattice energy could be obtained by the chemical bond, and lattice energy Ucal of a complex crystal could be written as the following eqn (9), (10). Based on the crystallographic data and complex chemical bond theory, chemical bond parameters of Li2Mg3BO6 (B = Ti, Sn, Zr) compounds were calculated as listed in Table 4 and lattice energy of Li2Mg3BO6 (B = Ti, Sn, Zr) ceramics using bond ionicity and covalent was listed in Table 5. As for the calculation of lattice energy and coefficient of thermal expansion could be performed based on the eqn (9)–(12).
| |
 | (9) |
| |
 | (11) |
| |
 | (12) |
where
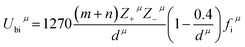
Ubcμ was the covalent part and
Ubiμ was the ionic part of
μ bond.
Z+μ and
Z−μ were the valence states of cation and anion which constituted bond
μ. Based on the lattice energy, the coefficient of thermal expansion
α of a complex crystal could be written as the following
eqn (13).
| |
 | (13) |
where
Fmnμ was the proportion of
μ bond in the total bonds of a supercell. According to the P–V–L theory suggested by S. S. Batsanov
et al.,
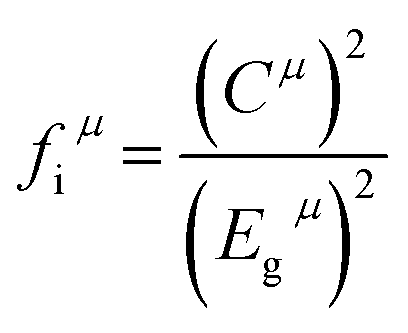
40 the dielectric constant was correlated with bond iconicity. Here the bond ionicity
fiμ of an individual bond
μ could be defined as the following
eqn (14).
| |
 | (14) |
where
Egμ was the average energy gap for the type bond
μ, which was composed of homopolar
Ehμ and heteropolar
Cμ parts. The calculated results of bond ionicity for Li
2Mg
3BO
6 (B = Ti, Sn, Zr) ceramics were also listed in
Table 4. According to the calculated results shown in
Table 4, it was found that the values of
fi(B–O) was 0.9078, 0.9066, 0.9063, corresponding to the B ions of Ti
4+, Sn
4+, Zr
4+ respectively. And the dielectric constants of Li
2Mg
3BO
6 (B = Ti, Sn, Zr) ceramics were 14.42, 10.07, 12.17, corresponding to the B ions of Ti
4+, Sn
4+, Zr
4+, respectively. The dielectric constant and bond ionicity as a function of B–O bond length was shown in
Fig. 14, which indicated the variation of the dielectric constant and the B-site bond ionicity
fi(B–O) in Li
2Mg
3BO
6 (B = Ti, Sn, Zr) ceramics. The dielectric constants of Li
2Mg
3BO
6 (B = Ti, Sn, Zr) ceramics showed the similar tendency with the average ionicity of the B–O bond as shown in
Fig. 14. It was clarified that the variation of B
4+ produced more effects on the B–O bond ionicity of Li
2Mg
3BO
6 (B = Ti, Sn, Zr) ceramics. P. Zhang also reported the similar tendency about the effect on dielectric constants due to bond iconicity based on the chemical bond theory on other systems such as Nd(Nb
1−xSb
x)O
4 and (Nd
1−xLa
x)NbO
4 ceramics.
41,42
Table 4 Calculation of lattice energy and expansion coefficient of Li2Mg3BO6 (B = Ti, Zr, Sn) ceramics based on bond ionicity calculated by the complex bond theory
| Compounds |
Bond type |
Bond length (Å) |
Valence electrons |
Density of valence electrons |
Eh |
Eg |
fiμ |
fcμ |
Ubc (kJ mol−1) |
Ubi (kJ mol−1) |
U (kJ mol−1) |
α (10−6 K−1) |
| Li2Mg3TiO6 |
Li–O |
2.091 |
0.67 |
1.3671 |
6.3789 |
12.6558 |
0.7459 |
0.2540 |
102 |
366 |
468 |
12.2126 |
| Mg–O |
2.091 |
1.33 |
2.7343 |
6.3789 |
16.4203 |
0.8491 |
0.1509 |
189 |
1668 |
1857 |
4.5842 |
| Ti–O |
2.091 |
2.67 |
5.4687 |
6.3789 |
21.0131 |
0.9078 |
0.0921 |
360 |
7135 |
7495 |
0.6732 |
| Li2Mg3SnO6 |
Li–O |
2.1252 |
0.67 |
1.302 |
6.1274 |
12.1525 |
0.7457 |
0.2542 |
101 |
362 |
463 |
12.3787 |
| Mg–O |
2.1252 |
1.33 |
2.6044 |
6.1274 |
15.7265 |
0.8481 |
0.1518 |
188 |
1646 |
1834 |
4.6814 |
| Sn–O |
2.1252 |
2.67 |
5.2089 |
6.1274 |
20.0598 |
0.9066 |
0.0933 |
360 |
7038 |
7398 |
0.7235 |
| Li2Mg3ZrO6 |
Li–O |
2.1365 |
0.67 |
1.2817 |
6.0473 |
11.9918 |
0.7456 |
0.2543 |
101 |
360 |
461 |
12.446 |
| Mg–O |
2.1365 |
1.33 |
2.5635 |
6.0473 |
15.5052 |
0.8478 |
0.1521 |
188 |
1639 |
1827 |
4.7115 |
| Zr–O |
2.1365 |
2.67 |
5.1269 |
6.0473 |
19.7563 |
0.9063 |
0.0936 |
361 |
7006 |
7367 |
0.7399 |
Table 5 Calculation of bond energy of Li2Mg3BO6 (B = Ti, Zr, Sn) ceramics based on bond ionicity calculated by the complex bond theory
| Compounds |
Bond type |
Bond length |
Electronegativity of cations |
Ion coefficient |
Covalent coefficient |
Covalent radius of cations |
Total of covalent radius |
Bond energy of cations |
Ec |
Ei |
E |
| Li2Mg3TiO6 |
Li–O |
2.091 |
0.98 |
0.41 |
0.59 |
133 |
196 |
105 |
214.42 |
664 |
398.74 |
| Mg–O |
2.091 |
1.31 |
0.355 |
0.645 |
139 |
202 |
11.3 |
72.49 |
664 |
282.47 |
| Ti–O |
2.091 |
1.54 |
0.3166 |
0.6833 |
136 |
199 |
117.6 |
230.39 |
664 |
367.70 |
| Li2Mg3SnO6 |
Li–O |
2.1252 |
0.98 |
0.41 |
0.59 |
133 |
196 |
105 |
210.97 |
653.31 |
392.33 |
| Mg–O |
2.1252 |
1.31 |
0.355 |
0.645 |
139 |
202 |
11.3 |
71.32 |
653.31 |
277.93 |
| Sn–O |
2.1252 |
1.96 |
0.2466 |
0.7533 |
140 |
203 |
187.1 |
291.67 |
653.31 |
380.88 |
| Li2Mg3ZrO6 |
Li–O |
2.1365 |
0.98 |
0.41 |
0.59 |
133 |
196 |
105 |
209.85 |
649.85 |
390.25 |
| Mg–O |
2.1365 |
1.31 |
0.355 |
0.645 |
139 |
202 |
11.3 |
70.9511 |
649.85 |
276.46 |
| Zr–O |
2.1365 |
1.33 |
0.3516 |
0.64833 |
154 |
217 |
298.2 |
391.54 |
649.85 |
482.38 |
 |
| | Fig. 14 Variation of dielectric constant and bond ionicity as a function of B–O bond length in Li2Mg3BO6 (B = Ti, Zr, Sn) crystal structure. | |
The lattice energies were calculated by chemical bond method of the Li2Mg3BO6 (B = Ti, Sn, Zr) ceramics shown in Table 4. The total values of lattice energies for the Li2Mg3BO6 (B = Ti, Sn, Zr) ceramics were calculated to be 9820 kJ mol−1, 9695 kJ mol−1, 9649 kJ mol−1, respectively. The concept of the lattice energy could be applied to evaluate the phase stability of a crystal structure.43 The Qf values and the lattice energy for Li2Mg3BO6 (B = Ti, Sn, Zr) ceramics were shown in Fig. 15 and the Qf values were strongly dependent on the lattice energy. The intrinsic factor on Qf value was minimum loss related with lattice anharmonicity.44 As shown in Fig. 15, the variation of Qf values showed the same tendency with the U value. The variation of the Qf suggested that the lattice energy played a non-negligible role in Li2Mg3BO6 (B = Ti, Sn, Zr) ceramics. From the calculated results in Table 4, the total lattice energy of Li2Mg3BO6 (B = Ti, Sn, Zr) ceramics changed with the variation of B–O bond length, and the U had a similar tendency with that of the Qf values. It was demonstrated that U had more contributions to the properties of Li2Mg3BO6 ceramics. Combined with the analysis of the lattice energies in Table 4, it was found that it was sensitive to the U values based on the results in Fig. 15. For Li2Mg3BO6 (B = Ti, Sn, Zr) ceramics due to higher lattice energies there were higher Qf values with shorter bond length of B–O bond. It was suggested that the Qf values of the Li2Mg3BO6 (B = Ti, Sn, Zr) ceramics could be predicted by the variation of lattice energies. P. Zhang also reported the similar tendency about the effect of Qf values as a function of lattice energies based on the chemical bond theory on other systems such as Nd(Nb1−xSbx)O4 and (Nd1−xLax)NbO4 ceramics.41,42 In these reports the Qf values showed the same variation tendency with the lattice energy which was considered as an intrinsic factor.
 |
| | Fig. 15 Variation of Qf values and lattice energy as a function of B–O bond length in Li2Mg3BO6 (B = Ti, Zr, Sn) crystal structure. | |
In addition, it was well known that shorter bond length correlated with higher bond energy, and higher bond energy indicated that the system would be more stable. R. T. Sanderson45–47 reported that the bond energy could be obtained by the chemical bond and the electronegativity. Based on the electronegativity and bond energy theory, the bond energy E of a complex crystal could be written as the following eqn (15)–(17).
| |
 | (15) |
where
Ebμ was bond energy for the type
μ bond, which was composed of nonpolar covalence energy
Ecμ and complete ionicity energy
Eiμ parts as shown in
eqn (16). For any binary crystal A
mB
n type compounds, the nonpolar covalence energy
Ecμ parts could be calculated as shown in
eqn (17).
| |
 | (17) |
where
rcA and
rcB were the covalent radii,
EA–A and
EB–B were the homonuclear bond energy. In this paper,
EZr–Zr = 298.2 kJ mol
−1,
ELi–Li = 105 kJ mol
−1,
ESn–Sn = 187.1 kJ mol
−1,
ETi–Ti = 117.6 kJ mol
−1,
EMg–Mg = 11.3 kJ mol
−1 and
EO–O = 498.36 kJ mol
−1 which could be obtained from the handbook of bond energies.
48 The final results were obtained as shown in
Table 5 for Li
2Mg
3BO
6 (B = Ti, Sn, Zr) compounds. The
Qf values presented the similar trends with the ionicity energy as shown in
Fig. 16. The ionicity energies of
Ei were 664, 653.3145, 649.8591 kJ mol
−1, for the bonds of Ti–O, Sn–O and Zr–O. The
Qf values of Li
2Mg
3BO
6 (B = Ti, Sn, Zr) ceramics increased with the increase of bond energy of Ti–O, Sn–O and Zr–O. It was suggested that the
Qf values of the Li
2Mg
3BO
6 (B = Ti, Sn, Zr) ceramics could be predicted by the variation of bond energy.
 |
| | Fig. 16 Variation of Qf values and ionic energy as a function of B–O bond length in Li2Mg3BO6 (B = Ti, Zr, Sn) crystal structure. | |
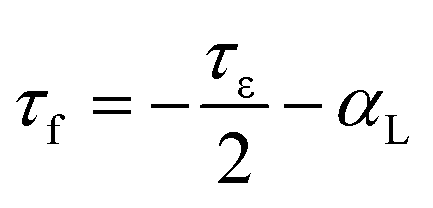
It was well known that the τf value was a function of the temperature coefficient of the dielectric constant (τε) and the linear thermal expansion coefficient (αL), as shown in eqn (18).49 Compared with the chemical bond ionicity and lattice energy, the coefficient of thermal expansion (α) in B–O bond played an important role in Li2Mg3BO6 (B = Ti, Sn, Zr) ceramics even though the αL was usually considered as constants (∼10 ppm °C−1) in many other reports.
| |
 | (18) |
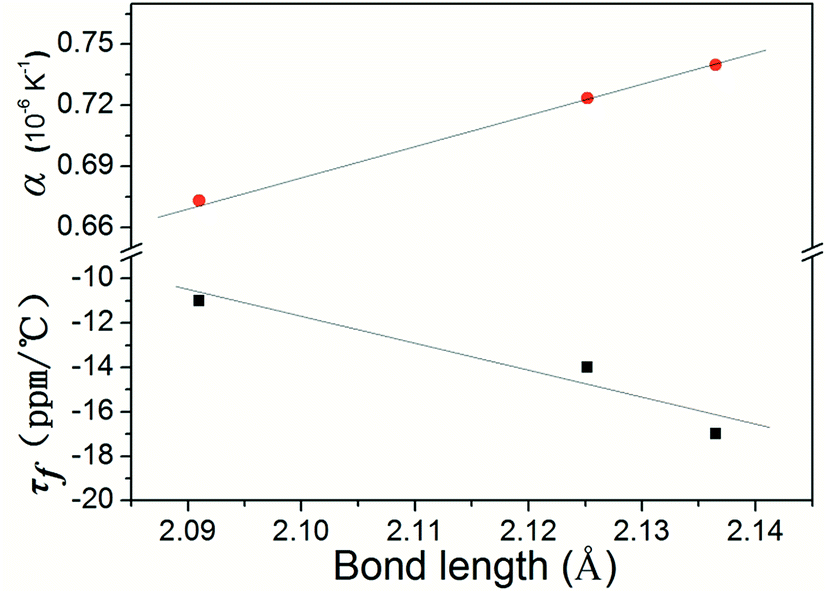
Here the τf value had a close relationship with the coefficient of thermal expansion (α) of B–O bonds. With the decreasing of α of B–O bond, τf value varied in the range of B = Ti, Sn, Zr as shown in Table 4, in which the calculated results of coefficient of thermal expansion for Li2Mg3BO6 (B = Ti, Sn, Zr) ceramics were listed. The correlations between the coefficient of thermal expansion (α) of B–O bond and temperature coefficient of resonant frequency τf were shown in Fig. 17. According to the results in Fig. 17, with the variation of the B–O bond, the coefficient of thermal expansion α of Li2Mg3BO6 (B = Ti, Sn, Zr) ceramics increased in the sequence of B = Ti, Sn, Zr. It was suggested that the α was also one of key factors on the microwave dielectric properties of Li2Mg3BO6 (B = Ti, Sn, Zr) ceramics.
 |
| | Fig. 17 Variation of τf values as a function of B–O bond length in Li2Mg3BO6 (B = Ti, Zr, Sn) crystal structure. | |
4. Conclusions
Rock salt structure Li2Mg3BO6 (B = Ti, Sn, Zr) compounds were prepared by solid-state reaction and the single phase was obtained throughout the composition for B = Ti, Sn, Zr. Dense samples possessed promising microwave dielectric properties, including εr values of 10.12–14.47, Qf values of 114000–153000 GHz and τf of −11.13 to −17.47 ppm °C−1. The correlations between the crystal structure and microwave dielectric properties were investigated based on the Rietveld refinement and chemical bond theory. Due to the variation of crystal structure caused by different B ions, bond ionicity was observed to be associated with the dielectric polarization. The variation of the Qf could be attributed to the lattice energy, ionicity energy of B–O, while τf values varied with the coefficient of thermal expansion.
Acknowledgements
This work was supported by the project development plan of science and technology of Ji'nan City (No. 201303061), Ji'nan City Youth Science and Technology Star Project (No. 2013035), National Natural Science Foundation (No. 51472108) and Study Abroad Programs by Shandong Province Government.
References
- A. Terrell Vanderah, Science, 2002, 298, 1182 CrossRef PubMed.
- I. M. Reaney and D. Iddles, J. Am. Ceram. Soc., 2006, 89, 2063 CAS.
- H. Ohsato, Ceram. Int., 2012, 38, S141 CrossRef CAS.
- D. Zhou, W. B. Li, L. X. Pang, Z. X. Yue, G. S. Pang and X. Yao, RSC Adv., 2015, 5, 19255 RSC.
- Y. G. Zhao and P. Zhang, RSC Adv., 2015, 5, 97746 RSC.
- S. D. Ramarao and V. R. K. Murthy, Dalton Trans., 2015, 2311 RSC.
- M. T. Sebastian, R. Ubic and H. Jantunen, Int. Mater. Rev., 2015, 60, 392 CrossRef.
- M. T. Sebastian and H. Jantunen, Int. Mater. Rev., 2008, 53, 57 CrossRef CAS.
- M. T. Sebastian, Dielectric materials for wireless communications, Elsevier Publishers, Oxford, 2008 Search PubMed.
- S. George and M. T. Sebastian, J. Am. Ceram. Soc., 2010, 93, 2164 CrossRef CAS.
- S. George and M. T. Sebastian, J. Eur. Ceram. Soc., 2010, 30, 2585 CrossRef CAS.
- L. J. Wang, Q. C. Sun, W. B. Ma and Z. L. Huan, Ceram. Int., 2013, 39, 5185 CrossRef CAS.
- Y. Tang, L. Fang, H. F. Zhou, Q. W. Liu and H. Zhang, Ceram. Int., 2013, 39, 8503 CrossRef CAS.
- C. H. Su, Y. D. Ho and C. L. Huang, J. Alloys Compd., 2014, 607, 67 CrossRef CAS.
- Z. F. Fu, P. Liu, J. L. Ma, X. M. Chen and H. W. Zhang, Mater. Lett., 2016, 164, 436 CrossRef CAS.
- Z. F. Fu, P. Liu, J. L. Ma, X. G. Zhao and H. W. Zhang, J. Eur. Ceram. Soc., 2016, 36, 625 CrossRef CAS.
- E. S. Kim, C. J. Jeon and P. G. Clem, J. Am. Ceram. Soc., 2012, 95, 2934 CrossRef CAS.
- B. W. Hakki and P. D. Coleman, IRE Trans. Microwave Theory Tech., 1960, 8, 402 CrossRef.
- W. E. Courtney, IRE Trans. Microwave Theory Tech., 1970, 18, 476 CrossRef.
- S. J. Penn, M. N. Alford, X. Wang, M. Xu, M. Reece and K. Schrapel, J. Am. Ceram. Soc., 1997, 80, 1885 CrossRef CAS.
- W. S. Kim, K. H. Yoon and E. S. Kim, J. Am. Ceram. Soc., 2008, 83, 2327 CrossRef.
- H. J. Jo, J. S. Kim and E. S. Kim, Ceram. Int., 2015, 41, S530 CrossRef CAS.
- R. D. Shannon, J. Appl. Phys., 1993, 73, 348 CrossRef CAS.
- R. D. Shannon and G. R. Rossman, Am. Mineral., 1992, 77, 94 CAS.
- S. Z. Jiang, Z. X. Yue and F. Shi, J. Alloys Compd., 2015, 646, 49 CrossRef CAS.
- F. Shi, H. Q. Sun, H. Q. Liu, G. G. Xu, J. Wang and Y. Han, Mater. Res. Bull., 2016, 75, 115 CrossRef CAS.
- H. Zhang, C. L. Diao, S. L. Liu, S. Z. Jiang, F. Shi and X. P. Jing, J. Alloys Compd., 2014, 58, 717 CrossRef.
- J. J. Bian and J. Y. Wu, Ceram. Int., 2016, 42, 3290 CrossRef CAS.
- J. Guo, C. A. Randall, D. Zhou, G. Q. Zhang, C. H. Zhang, B. B. Jin and H. Wang, J. Eur. Ceram. Soc., 2015, 35, 4459 CrossRef CAS.
- H. J. Jo and E. S. Kim, Mater. Res. Bull., 2015, 67, 221 CrossRef CAS.
- I. D. Brown and D. Altermatt, Acta Crystallogr., Sect. B: Struct. Sci., 1985, 41, 244 CrossRef.
- I. D. Brown and K. U. Kang, Acta Crystallogr., Sect. B: Struct. Crystallogr. Cryst. Chem., 1976, 32, 1957 CrossRef.
- N. E. Brese and M. O. Keeffe, Acta Crystallogr., Sect. B: Struct. Sci., 1991, 47, 192 CrossRef.
- S. J. Webb, J. Breeze, R. I. Scott, D. S. Cannell, D. M. Iddles and N. M. Alford, J. Am. Ceram. Soc., 2002, 85, 1753 CrossRef CAS.
- M. Y. Chen, C. Y. Chiu, C. T. Chia, J. F. Lee and J. J. Bian, J. Eur. Ceram. Soc., 2010, 30, 335 CrossRef CAS.
- E. S. Kim, C. J. Jeon, S. J. Kim and S. J. Kim, J. Korean Ceram. Soc., 2008, 45, 251 CrossRef CAS.
- Z. J. Wu, Q. B. Meng and S. Y. Zhang, Phys. Rev. B: Condens. Matter Mater. Phys., 1998, 58, 958 CrossRef CAS.
- Q. B. Meng, Z. J. Wu and S. Y. Zhang, Phys. Condens. Matter, 1998, 10, 85 CrossRef.
- J. A. Van Vechten, Phys. Rev., 1969, 182, 891 CrossRef CAS.
- S. S. Batsanov, Russ. Chem. Rev., 1982, 51, 684 CrossRef.
- P. Zhang, Y. G. Zhao and Y. X. Wang, Dalton Trans., 2015, 10932 RSC.
- P. Zhang, Y. G. Zhao and L. X. Li, Phys. Chem. Chem. Phys., 2015, 17, 16692 RSC.
- L. Glasser and H. D. B. Jenkins, J. Am. Chem. Soc., 2000, 122, 632 CrossRef CAS.
- C. L. Huang and J. Y. Chen, J. Am. Ceram. Soc., 2012, 93, 1248 Search PubMed.
- R. T. Sanderson, Inorg. Nucl. Chem., 1968, 30, 375 CrossRef CAS.
- R. T. Sanderson, Chemical Bonds and Bond Energy, Academic Press, New York, 1971 Search PubMed.
- R. T. Sanderson, J. Am. Chem. Soc., 1983, 105, 2259 CrossRef CAS.
- Y. R. Luo, Comprehensive Handbook of Chemical Bond Energies, CRC Press, Boca Raton, 2007 Search PubMed.
- I. M. Reaney, E. L. Colla and N. Setter, Jpn. J. Appl. Phys., 1994, 33, 3984 CrossRef CAS.
|
| This journal is © The Royal Society of Chemistry 2016 |
Click here to see how this site uses Cookies. View our privacy policy here.