Enhanced algal-based treatment of petroleum produced water and biodiesel production

Ahmad Farhad Talebi*a, Seyed Mohammad Mehdi Dastgheibb, Hassan Tirandazb, Akram Ghafaric, Ebrahim Alaieb and Meisam Tabatabaei*cd
aFaculty of Biotechnology, Semnan University, Semnan, Iran. E-mail: ahmad_farhad64@yahoo.com; Fax: +98-2333383301; Tel: +98-2333383506
bEnvironment and Biotechnology Research Division, Research Institute of Petroleum Industry, Tehran, Iran
cAgricultural Biotechnology Research Institute of Iran (ABRII), Agricultural Research, Education, and Extension Organization (AREEO), 31535-1897 Karaj, Iran
dBiofuel Research Team (BRTeam), Karaj, Iran. E-mail: meisam_tab@yahoo.com; Fax: +98-2632701067; Tel: +98-2632703536

Received 12th March 2016 , Accepted 29th April 2016

First published on 3rd May 2016


Abstract

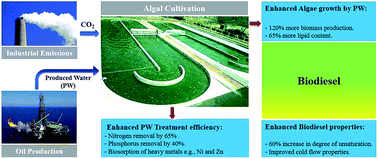
Millions of barrels of produced water (PW) are generated on a daily basis in petroleum-rich regions around the world. A locally isolated microalgal strain identified as Dunaliella salina was used to treat PW herein. The results showed that the application of the PW increased biomass production and lipid content by approximately 120 and 65% compared to the control (sea water), respectively. Consequently, significantly higher lipid productivity values (2–3.6 times) were achieved using the cultures enriched by different ratios of seawater and PW (1[thin space (1/6-em)]:[thin space (1/6-em)]1 to 3[thin space (1/6-em)]:[thin space (1/6-em)]1). Moreover, bioprospection by FAME profiling revealed that the inclusion of PW in the culture media altered some properties of the resultant biodiesel. More specifically, cold flow properties were improved by PW enrichment while oxidative stability was deteriorated. From the bioremediation point of view, the studied marine strain, D. salina coped well with the salinity fluctuations in wastewater and was found to be highly capable of removing nitrogen, by 65% and phosphorus, by 40%. Biosorption of toxic heavy metal pollutants such as Ni and Zn were also achieved at rates of approximately 90 and 80%, respectively. Overall, the integrated strategy presented herein seems very promising in minimizing the operating expenses of PW treatment while concurrently offering a sustainable platform to improve algal biodiesel production both in terms of quantity and quality.

1. Introduction

In many areas across the world where oilfields are located, produced water (PW) management is regarded as a crucial factor when investigating the feasibility of oil and gas field development. In fact, this highly-polluting wastewater of the petroleum industry is an inextricable part of the hydrocarbon recovery processes and is generated along with crude oil in huge quantities. For instance, Iran's current oil production of 2 million barrel per day is accompanied with the production of more than 6 million barrel per day of PW. In the United States, PW production exceeds 14–18 billion barrels per year.1 Besides its large quantity, due to the presence of organic compounds and heavy metals such as copper, zinc and nickel, PW poses a serious threat to the environment if not treated properly.2 It is worth quoting that heavy metals even at trace concentrations could be toxic to humans and their presence in aquatic food chains could lead to the accumulation of such metals in the human body leading to increased risk of various diseases.3 On the other hand, organic compounds present in PW could result in eutrophication if PW is disposed of in rivers, lakes, and sea waters.4

Presently, around 60–90% of the generated PW is injected into disposal wells or is re-used for maintaining pressure and integrity of production operation.5 The disposal of untreated PW into disposal wells is accompanied with the risk of leakages into underground water resources and hazardous consequences. This has forced authorities to impose stricter regulatory standards on discharging PW. It is worth quoting that limited access to disposal wells is also another driving factor further highlighting the importance of treating and reusing PW. The physicochemical treatment methods conventionally used to remove the high concentrations of nutrients and toxic heavy metals from PW are summarized in Table 1. In fact, the initial composition of the PW, the availability of technical and financial facilities, and the required quality of the finished effluent are the determining factors when selecting the processing type. It can be inferred from the data presented in Table 1 that each of these processes has its own pros and cons. Therefore, in order to remove various types of pollutants, e.g., hydrocarbons, suspended solids, heavy metal, etc., a combination of different techniques, such as membrane-based processes and chemical precipitation is required to enhance the recovery and to minimize the amount of concentrated brine generated.6 However, high costs, large input of chemicals, and incomplete removal of the metal are among the main limiting factors associated with the application of the physicochemical approaches.

Table 1 A summary of the processes and their features used in produced water treatment6,7
Treatment Hydrocarbons removal Suspended solids removal Metal removal Softening and SAR adjustment Soluble organic removal Pre/post treatment Desalination PW recovery (%) Toxics removala Environmental/economical sustainability Feed quality
a Special constituents of concern, such as boron and BTEX compounds (sum of benzene, toluene, ethylbenzene, and xylenes).
Hydrocyclone           High   Long lifetime, low energy input All TDS
Gas flotation       Coagulation   ∼100   Coagulant, pumping costs High TOC and oil
Ultra-filtration       Straining, desalination   85–100   Polymeric/ceramic membranes cost All TDS
Sand filtration         Coagulation   ∼100   Optional coagulant All TDS
Aeration & sedimentation         Low   No energy and chemical use No restrictions
Chemical precipitation         95 Good in combined processes High TDS
Oxidation         100   High cost chemical All TDS
Ion exchange       Mineral removal, remineralization   ∼100 Resin regeneration, pumping costs 0.5 < TDS < 7 g L−1
Adsorption     ∼100 Pumps, plumbing and chemical needed All TDS
Membrane separation         Extensive pre and post treatment 30–60   Chemical cleaning and high-pressure pumps needed 0.5 < TDS < 50 g L−1
Freeze/thaw evaporation Deoiling 50 (in winter)   Limited by land availability and climate conditions TDS > 40 g L−1 with no methanol
Evaporation and distillation         Less rigorous pretreatment 20–70   High energy demand High TDS range
Electrodialysis       Filtration, pH adjustment 70–90   Complicated operation, chemical cleaning use TDS < 8 g L−1
Biological activities     Sedimentation 100 Low cost, no chemical use Cl < 6600 and oil < 60 mg L−1


Alternatively, biosorption of heavy metals using microalgae has been proposed as an ecologically-safer, more economic, and efficient mean to remove metals from different wastewaters.8 Besides, the produced biomass by photosynthetic microalgae can be transformed into a wide range valuable products, such as biofuels (e.g., bioethanol and biodiesel). To achieve the desired level of treatment with algal systems, maximizing autotrophic production is of primary importance which could be accomplished by providing a rich source of wastewater. However, to the best of our knowledge, there are no published reports on the integration of PW treatment using microalgae and biofuels production.

Therefore, the present study was set to investigate the potentials of algal-based treatment of PW while focusing on biomass and lipid production concurrently. The removal of heavy metals as well as the other polluting compounds were taken into consideration. Moreover, the impact of PW enrichment on the properties of the resultant biodiesel was studied by bioprospection of fatty acid methyl ester (FAME) profile.

2. Materials and methods

2.1. Algal cultivation

A marine strain of Dunaliella sp. isolated from Bandar Lengeh, a port city on the northern coast of the Persian Gulf, was selected for this study. To propagate the algal cells, green colonies were transferred into new glass flasks containing the Lake medium and were kept at 20 °C. The light intensity was set to 3 klux photon flux using white and red LED lamps with a light[thin space (1/6-em)]:[thin space (1/6-em)]dark cycle of 16[thin space (1/6-em)]:[thin space (1/6-em)]8 h. Illumination was monitored using an LUTRON LX-105 lux meter (Taiwan). The lake medium contained the Urmia Lake salt sediment (60 g L−1), NPK 15-15-15 fertilizer (2 g L−1), and FeSO4 (0.05 g L−1).9 The pH of the media was set at 7.5 and the samples were constantly shaken at 120 rpm.

The PW was provided by the research institute of petroleum industry (RIPI), Tehran, Iran. The wastewater source was the desalinated PW of a crude oil well located in the southwest of Iran and the total dissolved solids (TDS) content of the PW was at approximately 1%.

2.2. Strain identification

To identify the studied marine strain, morphological and molecular identification techniques were simultaneously used. The morphology of single cells was studied using a Leica DMRXA compound light microscope with a Nikon (DXM 1200) digital camera (Nikon, Tokyo, Japan). The following parameters were recorded: length and width of vegetative cells; morphology of the cells; the presence or absence of flagellum, filaments and gas vesicles; and finally, the shape of flagellum and their potential aggregation into colonies. Molecular identification of green microalgae isolate was also performed according to a previously described method.9 In brief, PCR amplification of 18S rRNA was performed with species specific oligonucleotides, MA1 (5′-CAGACACGGGGAGGATTGACAGATTGAGAG-3′) and MA3 (5′-GCGCGTGCGGCCCAGAACATC-3′) using the DNA extracted from axenic algal cultures. The purified PCR products were sequenced by Macrogen Company (Korea) and the results were blasted against the database available in the NCBI GenBank. Bioinformatics analysis was performed using MEGA software to compute the evolutionary distances and phylogenetic relationship.

2.3. Effect of PW on algal growth kinetic parameters

To investigate the effect of the PW on the growth kinetic parameters, different ratios of PW and sea water (1[thin space (1/6-em)]:[thin space (1/6-em)]1, 1[thin space (1/6-em)]:[thin space (1/6-em)]2 and 1[thin space (1/6-em)]:[thin space (1/6-em)]3, respectively) were prepared and the adaptive changes of the algal populations were studied. Neat sea water and PW were used as controls. During the cultivation period, growth kinetic parameters, i.e., biomass productivity (BP), lipid content (LC), and volumetric lipid productivity (LP) (mg L−1) were recorded. To investigate the growth rate, cell density was determined by measuring the absorbance of 1 mL of cell suspension by a spectrophotometer at 600 nm. For BP determination, a 25 d-old algal suspension was first centrifuged at 3000 × g for 10 min. Then, to remove the extra salt from the cells, the precipitate was rinsed and re-suspended in ddH2O followed by centrifugation at 3000 × g for 10 min. Finally, the wet weight of the resultant pellet was determined gravimetrically to compute the BP. Twenty-five d-old algal cultures in their the initial stationary phase were harvested for measuring LC (% dwt) by using the Bligh and Dyer method.10 LP (mg L−1) was calculated using to the following equation:
 
LP = PB × LC (1)

2.4. Estimation of biodiesel properties based on algal FA profiles

The fatty acid (FA) profile of the algal cells was determined using a Varian CP-3800 Gas Chromatography (GC) (Varian, Inc., Palo Alto, CA) equipped with a CP-Sill 88 fused silica column (100 m, 0.25 mm I.D., film thickness 0.25 μm) as reported in our previous publication.11 The oven temperature was maintained at 130 °C for 4 min, then programmed to increase to 180 °C at a rate of 5 °C min−1, and kept at this temperature for 8 min. Then, the oven temperature was increased from 180 to 220 °C at the rate of 4 °C min−1 under the following conditions: carrier gas helium (1 mL min−1), split ratio 20[thin space (1/6-em)]:[thin space (1/6-em)]1, and flame ionization detector (FID) 280 °C. The generated FA profiles were used to estimate the characteristics of the prospective biodiesel. Bioprospection of biodiesel quality for the studied samples was achieved using the BiodiselAnalyser ver. 1.2 software (available on http://brteam.ir/analysis/acme/).12

2.5. Algal-based PW treatment

Chemical analysis of the PW before and after the algal-treatment was conducted to provide a clear insight into the effect of the algal growth on the final physico-chemical characteristics of the wastewater. To achieve that, algal cells were cultured for 4 weeks in the ratio of PW and sea water which resulted in the highest LP. Then, the biomass was removed from the media by centrifugation and filtration (Wattman filter, no. 3). Subsequently, 1 mL of the filtrate was diluted by deionized water at a ratio of 1[thin space (1/6-em)]:[thin space (1/6-em)]100 and was analyzed by an Ion Chromatography (Metrohm, Switzerland). The total solids (TS), total suspended solids (TSS), and TDS contents were determined according to the standard methods.13 The TS was determined after drying the samples at 100 °C in pre-weighed crucibles while TSS and TDS were determined using the filtered samples after drying at 100 °C and 180 °C, respectively. The sodium adsorption ratio (SAR), a determining factor showing the suitability of water for irrigation, was also calculated by using the following formula by inputting the concentrations of Na, Ca, and Mg ions (mg L−1):5
 
image file: c6ra06579a-t1.tif(2)

The heavy metal contents were determined using an atomic absorption spectrophotometer (AAS). Subsequently, in order to investigate the bioremediation capabilities of the studied algal strain, the PW was surged with different concentrations of NiCl·6H2O and ZnSO4·7H2O stock solutions (1000 ppm). Then, the heavy metal solutions were directly added into the lake medium containing 5 × 10⁵ algal cells per mL at their stationary growth phase. After 6 h, the supernatant was collected by centrifugation at 8000 × g and the heavy metal concentration was analyzed by the AAS.

2.6. Statistical analyses

Mean comparison was carried out using the ANOVA test. This procedure was carried out using SPSS statistics 18 (SPSS Inc., IL, USA). Further analyses were done using Microsoft Excel 2010. All experiments were conducted in triplicate.

3. Results and discussion

3.1. Algal strain identification

Identification of the isolate by its morphological features followed by phylogenetic analysis using the 18S rRNA gene showed that the studied strain was Dunaliella salina (gene bank accession number KF477384 (ref. 9)). Single cells were found to harbor a well-developed apical papilla and contained a pyrenoid surrounded by starch. The cells were encapsulated by a mucilaginous layer and were motile using two equal-long (25.0–30.0 μm) and smooth flagella enabled cells to easily move. The lack of cell wall, filaments, heterocysts, akinetes, and gas vesicles were also observed as is the case for D. salina.14

3.2. Effect of PW on algal growth kinetic parameters

By synchronizing all the conditions under which the studied strain was grown, the results achieved would solely represent the impact of the PW on the growth parameters, oil content and composition as well as biodiesel properties. All cultures were harvested 28 d after inoculation. The algal cells cultivated in the medium consisting of the 1[thin space (1/6-em)]:[thin space (1/6-em)]1 combination of PW and sea water, showed the highest optical density (OD = 3) during the 28 d cultivation period. The lowest cell density was observed for the controls, i.e., neat sea water (OD < 1.5) while no growth was observed for neat PW (Fig. 1).
image file: c6ra06579a-f1.tif
Fig. 1 Growth dynamics of Dunaliella salina cultured in different media. Cell density was measured during the 4 weeks of cultivation period.

After three weeks of inoculation by algal cells, all cultures of different PW concentrations reached the variant growth phase. The results obtained revealed that the growth dynamics represented by cell density were significantly influenced by the PW inclusion. This could be ascribed to the nutrients contained in the PW (especially nitrate and phosphate) which must have promoted cell division and consequently cell density (Fig. 1). In fact, the higher the PW supplementation, the faster the log phase and doubling time were. By comparing the graphs presented in Fig. 1, one could conclude that at the time the algal cells grown in the 1[thin space (1/6-em)]:[thin space (1/6-em)]1 medium reached the pre-stationary phase (day 28), the cells grown in the neat sea water were still in their early stages of development.

As tabulated in Table 2, the highest BP, LC, and LP values were also obtained when the 1[thin space (1/6-em)]:[thin space (1/6-em)]1 dilution rate was used. More specifically, this medium increased BP, LC, and LP values by approximately 120%, 65%, and 263% compared with the neat sea water. Moreover, further dilutions of the PW, i.e., 1[thin space (1/6-em)]:[thin space (1/6-em)]2 and 1[thin space (1/6-em)]:[thin space (1/6-em)]3 (PW[thin space (1/6-em)]:[thin space (1/6-em)]sea water) negatively affected the BP compared to the 1[thin space (1/6-em)]:[thin space (1/6-em)]1 medium. The achieved significant improvements could be ascribed to the robust biomass production achieved by using this medium. These findings were in line with those of previous studies highlighting the prominent impact of optimizing media formulations9,11 and growth conditions15 on microalgae growth kinetics. In another word, some manipulation in key nutrients availability can alter the metabolic and developmental pathways in green algae and therefore, end to growth enhancement. Therefore, it should be quoted that in the present study simultaneous supplementation of N and P as well as their high availability as could be comprehended by high removal rates obtained (Table 3), were the main factors which led to enhanced cell division and consequently increased BP and LP values.

Table 2 Biomass productivity, lipid content, and lipid productivity of the microalgae strain
Samplea Parameters
Biomass productivityb (g L−1) Lipid content (% dwt) Volumetric lipid productivity (mg L−1)
a Dunaliella salina cultured in 1[thin space (1/6-em)]:[thin space (1/6-em)]1, 1[thin space (1/6-em)]:[thin space (1/6-em)]2 and 1[thin space (1/6-em)]:[thin space (1/6-em)]3; PW and sea water, respectively.b Data expressed as mean ± SD (n = 3) during a 25 days cultivation period. Means were compared using one-way ANOVA and those with different letter are significantly different (at P < 0.05).
1[thin space (1/6-em)]:[thin space (1/6-em)]1 2.75 ± 0.3A 28.90 ± 1.1A 794.75 ± 0.4A
1[thin space (1/6-em)]:[thin space (1/6-em)]2 2.50 ± 0.2A 22.33 ± 2.1B 558.25 ± 0.7B
1[thin space (1/6-em)]:[thin space (1/6-em)]3 1.75 ± 0.2B 18.91 ± 1.1B 330.92 ± 0.3C
Sea water 1.25 ± 0.3C 17.52 ± 1.8C 219.00 ± 0.4D


Table 3 Characteristics of the 1[thin space (1/6-em)]:[thin space (1/6-em)]1 diluted PW with sea water, before and after algae inoculation
Parameter Value (mg L−1) Variation (%)
Before algal treatment After algal treatment
pH 6.5–7 Set at 8
TPH <0.2 <0.2
TDS 13[thin space (1/6-em)]622 14[thin space (1/6-em)]387 +5.62
TSS 254 209 −17.72
TOC 63 102 +61.90
SAR 182 157 −13.74
NH4 10 7 −30.00
NO3 622 212 −65.92
PO4 300 178 −40.67
SO4 486 338 −30.45
Cl 8473 7661 −9.58
Na 4280 3283 −23.29
K 28 26 −7.14
Ca 976 763 −21.82
Mg 131 104 −20.61
Li 507 476 −6.11
Fe 1.5 1.4 −6.67


Morphological changes of D. salina in response to the best PW dilution rate, i.e., 1[thin space (1/6-em)]:[thin space (1/6-em)]1 was also microscopically investigated in comparison with the cells grown in sea water. As presented in Fig. 2b, the algal cells grown in the 1[thin space (1/6-em)]:[thin space (1/6-em)]1 dilution rate of PW turned pale green and grew larger, presumably due to moderate β-carotene accumulation. Nevertheless, both cultures contained motile cells with an equal cell density.


image file: c6ra06579a-f2.tif
Fig. 2 Microscopic images of Dunaliella salina; two flagella, mucilaginous layer, pyrenoid structures in unique chloroplast and accumulation of β-carotene-containing lipid droplets are visible. (a) D. salina cells grown in the sea water and (b) 1[thin space (1/6-em)]:[thin space (1/6-em)]1 dilution rate of PW and sea water.

Termini et al.16 investigated the potential of microalgae in wastewater treatment in indoor photo bioreactors and achieved an acceptable nutrients (nitrogen and phosphorus) removal of about 99.9% with a specific biomass productivity of 0.25 g L−1. However, their achieved specific biomass productivity was significantly lower than what accomplished in the present study, i.e., 2.75 g L−1 using the 1[thin space (1/6-em)]:[thin space (1/6-em)]1 medium.

3.3. FAME-based bioprospection of biodiesel properties

FA profiles of the studied microalgae varied in cultures supplemented by different ratios of PW and sea water (Table 4). It has been well documented that FA profile directly influence biodiesel quality parameters, such as oxidation stability (OS), cold flow properties (cloud point (CP) and pour point (PP)), and combustion characteristics (cetane number (CN)).17 Herein, the results obtained clearly showed a sharp decline in the saturated fatty acid (SFA) accumulation in the cells in response to the PW inclusion. In more details, the ratio of SFA to unsaturated fatty acid (USFA) decreased by half (from 0.63 to 0.3 in sea water and the 1[thin space (1/6-em)]:[thin space (1/6-em)]1 medium, respectively). This resulted in an increased degree of unsaturation (DU) and consequently deteriorated OS as a result of PW inclusion (Table 5). Cold flow properties of the resultant biodiesel were improved when the algal cells were cultured in the PW-enriched media compared with the neat sea water (Table 5). These changes in FA profiles and biodiesel properties could be explained by the signaling role of nitrate in modulating carbon allocation in FAs production pathways.
Table 4 Fatty acids profiles of D. salina in response to different incorporation ratios of PW
Samplea Fatty acidb (%) SFA/USFA
16[thin space (1/6-em)]:[thin space (1/6-em)]0 16[thin space (1/6-em)]:[thin space (1/6-em)]1 18[thin space (1/6-em)]:[thin space (1/6-em)]0 18[thin space (1/6-em)]:[thin space (1/6-em)]1 18[thin space (1/6-em)]:[thin space (1/6-em)]2 18[thin space (1/6-em)]:[thin space (1/6-em)]3 20[thin space (1/6-em)]:[thin space (1/6-em)]1
a Dunaliella salina cultured in 1[thin space (1/6-em)]:[thin space (1/6-em)]1, 1[thin space (1/6-em)]:[thin space (1/6-em)]2 and 1[thin space (1/6-em)]:[thin space (1/6-em)]3; PW and sea water, respectively.b Non identified FAs are around 10%.c 1[thin space (1/6-em)]:[thin space (1/6-em)]1, 1[thin space (1/6-em)]:[thin space (1/6-em)]2 and 1[thin space (1/6-em)]:[thin space (1/6-em)]3 represent different PW and sea water ratios, respectively.
1[thin space (1/6-em)]:[thin space (1/6-em)]1c 16.67 ± 1.8 1.58 ± 1.9 4.02 ± 1.3 13.63 ± 2.1 20.33 ± 1.4 30.58 ± 1.2 1.4 ± 1.7 0.30
1[thin space (1/6-em)]:[thin space (1/6-em)]2 17.02 ± 0.9 3.18 ± 0.3 3.65 ± 0.7 21.95 ± 0.7 19.15 ± 0.9 30.66 ± 0.4 1.12 ± 1.6 0.28
1[thin space (1/6-em)]:[thin space (1/6-em)]3 19.41 ± 0.6 4.54 ± 0.7 3.95 ± 0.5 22.08 ± 1.5 11.47 ± 1.4 21.06 ± 1.9 7.03 ± 1.3 0.35
Sea water 28.10 ± 0.8 2.03 ± 1.1 2.91 ± 0.3 17.23 ± 2.4 9.15 ± 1.3 15.93 ± 1.4 4.8 ± 1.1 0.63


Table 5 Comparison of the estimated properties of the biodiesel obtained from D. salina feedstock treated with different incorporation ratios of PWb
Samplea Biodiesel properties
SV IV CN DU LCSF CFPP CP PP APE BAPE OS HHV υ ρ
a Dunaliella salina cultured in 1[thin space (1/6-em)]:[thin space (1/6-em)]1, 1[thin space (1/6-em)]:[thin space (1/6-em)]2 and 1[thin space (1/6-em)]:[thin space (1/6-em)]3; PW and sea water, respectively.b SV: saponification value, IV: iodine value, CN: cetane number, DU: degree of unsaturation, LCSF: long chain saturated factor, CFPP: cold filter plugging point, CP: cloud point, PP: pour point, APE: allylic position equivalent, BAPE: bis-allylic position equivalent, OS: oxidation stability, HHV: higher heating value, υ: kinematic viscosity, ρ: density.
1[thin space (1/6-em)]:[thin space (1/6-em)]1 179.44 135.5 46.23 118.43 3.68 −4.92 3.78 −2.72 115.45 81.49 4.91 34.68 1.08 0.78
1[thin space (1/6-em)]:[thin space (1/6-em)]2 196.8 142.43 41.99 125.87 3.53 −5.4 3.96 −2.52 121.57 80.47 4.96 38.05 1.19 0.85
1[thin space (1/6-em)]:[thin space (1/6-em)]3 181.87 108.55 51.89 98.71 3.92 −4.17 5.22 −1.16 87.14 53.59 6.22 35.28 1.15 0.79
Sea water 164.69 81.62 61.08 74.22 4.27 −3.08 9.79 3.81 67.39 41.01 7.29 7.29 1.04 0.7


Inorganic nutrient residues contained in the PW could potentially be responsible for the changes observed herein in biodiesel production, quantitatively and qualitatively. The results pertaining to the impacts of PW incorporation on the FAs profiles and consequent biodiesel properties are presented in Tables 4 and 5, respectively.

3.4. Analysis of bioremediation capabilities using IC

The characteristics of the PW are presented in Table 3. These data were comparable to those previously reported by Utvik.18 As shown, the PW used was characterized by high TDS, nitrogen and total heavy metals contents. The high TDS content compared with the TSS content indicates the presence of high amounts of soluble salts in the PW used. The results of the chemical analysis of the PW before and after algal-based are shown in Table 3. Accordingly, the NO3 and PO4 reduction rates achieved were approximately 66% and 41%, respectively. In fact, the algal cells efficiently took up the required nutrients present in the PW particularly N and P and, hence, no further nutrient supplementation was necessary to improve biomass production. Chisti19 states that 6.6% and 1.3% of a typical algal biomass (by weight) are contributed by nitrogen and phosphorous, respectively. The bioremoval efficiency of N achieved in the present study were comparable to those of Craggs et al.20 who reported 64–67% N removal from municipal wastewater using high rate algal ponds (HRAPs). In a different study, Rasoul-Amini et al.21 highlighted the nutrients removal capabilities of Chlorella sp. and Chlamydomonas sp. by achieving complete depletion of N and P residues from urban wastewaters while achieving high biomass productivity. However, it should be mentioned that the initial concentrations of NO3 and PO43− in their study were so lower than those studied during the present investigation.

Based on the findings of this study, Na+ ion concentration was moderately decreased by just over 23% in the treated PW (Table 3). This Na+ reduction directly decreased the SAR value by 13.7% (from 182 to 157) but the SAR was still higher than the acceptable level for irrigation application, i.e., 12.5 Nevertheless, it should be quoted that since reducing SAR is among the main challenges faced in biological wastewater treatment, any extents of reduction rate would be of great importance. This could be easily comprehended from the findings of Drewes et al.6 who stated that the wetland system under investigation failed to effectively lead to any changes in SAR parameter after one year of operation.

The positive attributes of the present system in reducing Na concentration could be related to the unique features of Dunaliella spp. to osmotic variations in the culture media.22 On the other hand, K concentration was not significantly affected by the algal cells growth during the treatment (Table 3). This ability to keep intracellular concentration of K+ out of fluctuations has been developed during the course of evolution as a defense mechanism against hazardous effects of excess Na+.23 In our previous study, D. salina cells was shown to effectively maintain the intracellular K+ concentration when faced with increasing salinity in the culture media compared with the other microalgal strains. In more details, even by varying salinity levels in the culture medium, the amount of K+ ion in Dunaliella cells is kept constant in order to continue its metabolic activities.24 The results achieved herein also confirmed the previous finding, i.e., the stability of K+ ion concentration in the PW after the inoculation.

Moreover, D. salina cells were revealed to have efficient mechanisms to keep intracellular Ca2+ level unchanged as well. Issa25 reported that during a salinity stress, Ca2+ concentration remained constant despite a sharp increase in intracellular Na+ content. Similar results were observed in the present experiment but a 22% decrease in Ca+ ion concentration in the treated PW was achieved due to the enhanced growth of the D. salina cells accumulating Ca2+ during their growth phase (Table 3). All other minor variations in ions concentrations are tabulated in Table 3.

Wetlands have also been proposed for treating PW. The biodegradation ability of halophyte plants along with their evapotranspiration could reduce PW volume and the pollutants contained.6 However, several constraints restrict the application of such plants such as: (a) slow operation rate, (b) large deal of land and fresh water requirements per unit volume of PW, (c) pretreatment processes requirements, and (d) periodic release of captured contaminants.26 Hence, and having considered the results of the present investigation, algal-based treatment systems such HRAPs seems comparatively more promising for PW than wetland-based treatment systems. The HRAP system in comparison with the conventional wastewater treatment methods, has lower capital and operating costs and needs no intensive high technology to operate.19,27 For example, activated sludge systems, one of the most common wastewater treatment technologies for COD/BOD removal, requires two folds capital costs for construction and five folds operational costs more than those required by advanced pond systems such as HRAP.27 In conclusion, algal-based removal of residual nutrients from the PW could be regarded as a promising method in terms of both efficiency and capital/operational costs.

3.5. Analysis of heavy metal bioaccumulation using AAS

As mentioned earlier, treating wastewaters such as PW containing heavy metals has become a major challenge due to the costly treatment methods.28 Under the culture conditions developed in this study, the bioavailability and toxicity of the heavy metals (Zn and Ni free ions) decreased. This must have been achieved through binding of these metals to the organic ligands present in algal biomass29 revealing the adsorption capacity of the culture.

According to the data presented in Table 3, only 6 h was sufficient for the D. salina algal cells to uptake more than 84% of the Ni ions (5–100 ppm). Increasing the concentration (above the optimum concentration of 100 ppm) led to a decreased bioremediation capacity of the algal cells. More specifically, the active cells vigorously started to absorb free ions using their free binding sites but this phenomena has its highest efficiency at low concentrations and within a short period of time and by increasing the ions concentration, the binding site became saturated. On such basis, in the present study by doubling the concentration of the Ni ions from 100 mg L−1 to 200 mg L−1, the Ni ion reduction efficiency was decreased from 94 to 72%.

It has been proved that zinc deficiency could negatively affect algae's growth through inhibiting chlorophyll synthesis.30 The findings of the present study revealed that D. salina could remove 78 and 91% of free Zn ions at 2 to 5 mg L−1 during the 6 h of cultivation, respectively. However, higher initial Zn concentrations, i.e., 10 and 20 mg L−1 adversely affected the bioremoval capability of the algal cells (60 and 55%, respectively) (Table 6); since it could adversely affect the photosynthetic apparatus.31

Table 6 Reduction (%) of Zn and Ni free ions through D. salina cultivation
Heavy metals Concentration (mg L−1)
Before culture After culture Reduction (%)
Ni 5 0.57 89
20 3.20 84
100 6.20 94
200 54.78 72
Zn 2 0.44 78
5 0.44 91
10 3.96 60
20 8.92 55


Based on the present observation, the initial concentration of metal ions in the aquatic phase determine the final algal biosorption ability. In fact, metal biosorption initially increases with increasing metal concentration up to a certain level but by further increasing the concentration, the metal absorption deteriorates.32 It is worth quoting that the potential of metal removal from the aquatic phase by algal cells is also directly related to the biomass concentration, i.e., by increasing biomass concentration, higher absorption capacities could be achieved.33 This could be ascribed to the fact that more algal cells is translated into more free-binding sites to absorb more metal ions. Different types of binding groups on the cell surface i.e. hydroxyl, phosphoryl, amino, carboxyl, sulphuryl, amine, imidazole, sulphate, phosphate, carbohydrate act as determining factors in the final metal ions biosorption capacity. Overall, the number of sites on the algal cells, the accessibility of binding groups for metal ions adsorption and finally the chemical state of these sites (affecting their pKa) determine the final volume of absorbed heavy metals.3

Metal ions such as Zn and Ni tend to establish links with the following binding sites.29 Cl, Br, N3, NO2, SO32−, NH3, N2, RNH2, R2NH, R3N, [double bond, length as m-dash]N–, –CO–N–R, O2, O2, O22−.

The accumulation procedure of heavy metals by algal cells generally occurs in two phases: (a) inactive biosorption, and (b) active biosorption. Inactive biosorption as the first phase is carried out quickly and is completely independent of the cellular metabolism. The cellular location of non-active metal biosorption is limited to the cell surface and the tendency of metal binding sites is the determining parameter in this phase. It is worth quoting that the abundance of carboxyl and phosphate groups on the cell surface causing a negative charge on the cell surface34 also plays an important role in up-taking metal ions (cations). In the next phase called as intracellular ion uptake, metal ions are actively absorbed into the cytoplasm of the microalgal cells. This phase is heavily dependent on the cell metabolism.2 Moreover, given the complexity of the composition of the algal cell surface, diverse mechanisms may be simultaneously involved in active metal uptake. Ion exchange, complex formation, and electrostatic interaction are among the mechanisms used to regulate the heavy metal biosorption.35

Among the processes listed, ion exchange is the most important mechanism in the biosorption of metal ions by algal biomass.36 The green algae D. salina used in the preset study showed a suitable adsorption capacity of heavy metals, but the best presentation of metal biosorption reported in the literature is related to brown algae.37

3.6. Multi-purpose microalgal bioprocess engineering

Overall, to achieve the desirable characteristic of heavy metals biosorption using algal systems i.e., low cost and low energy input, maximizing auto/heterotrophic biomass production is also of primary importance. It has been reported that coupled microalgae cultivation and wastewater bioremediation could potentially reduce unit cost energy by 20–25% in addition to eliminating the cost of nutrient and freshwater implementation.27,38 Park and coworkers also reported that wastewater treatment coupled with biomass production could address capital costs, operation and maintenance costs in microalgal biofuel production.39 Since both the LC and BP were increased in the present study as a result of the PW supplementation into the cultivation media, it could be concluded that combining the algal-based treatment of PW (for heavy metal and nutrients removal) with biofuel production could be regarded as a promising platform with enhanced economic aspects.40 In better words, algae biofuel should be considered as a by-product of algal-based wastewater treatment systems and not the mainstream product. For instance, given the huge amount of PW generated in an oil-producing country such as Iran, long coastal line, numerous sunny days and available technology/experts, by using algal-based PW treatment, 794.75 × 10³ tonnes of biodiesel could be produced on a monthly basis which could address approximately 26.5% of the country's diesel requirements.

4. Conclusion

Algal-based treatment of PW was successfully achieved. Concurrently, the inclusion of PW in sea water as the algal cultivation medium (1[thin space (1/6-em)]:[thin space (1/6-em)]1) led to enhanced biomass and lipid production. Moreover, the properties of the resultant biodiesel were significantly improved. These findings could open a new window to algal biofuels which have been highly criticized recently due to their commercial viability caused by falling oil prices. In better words, algal biofuel outlook could be to some extent economically promising if one would incorporate it into an integrated algal-based PW treatment system. Therefore, the mainstream product of the proposed integrated (or coupled) system would be PW treatment while the by-product would be algal fuel i.e., biodiesel. It is worth mentioning that the present experiments were conducted under controlled indoor conditions and it is recommended that the critical impacts of light and temperature variations on the properties of algae biomass cultivated outdoors be surveyed by future investigations.

Acknowledgements

The authors would like to thank Biofuel Research Team (BRTeam), Agricultural Biotechnology Research Institute of Iran (ABRII), and Iranian Biofuel Society (IBS) for funding this study.

References

  1. J. A. Veil, M. G. Puder, D. Elcock and R. J. Redweik, Technical Report, Argonne National Laboratory, 2004.
  2. C. Monteiro, P. L. Castro and F. X. Malcata, Biomanagement of Metal-Contaminated Soils, ed. M. S. Khan, A. Zaidi and R. Goel, Springer, Netherlands, 2011, pp. 365–385 Search PubMed.
  3. B. Volesky, Water Res., 2007, 41, 4017–4029 CrossRef CAS PubMed.
  4. L. E. de-Bashan and Y. Bashan, Bioresour. Technol., 2010, 101, 1611–1627 CrossRef CAS PubMed.
  5. T. Hayes and D. Arthur, 11th Annual International Petroleum Environmental Conference Albuquerque, 2004, pp. 12–15 Search PubMed.
  6. J. E. Drewes, T. Y. Cath, P. Xu, J. Graydon, J. Veil and S. Snyder, Technical assessment of produced water treatment technologies research partnership to secure energy for America, 2009, p. 158 Search PubMed.
  7. L. L. Landkamer and G. Thyne, Final Report: Produced Water Management and Beneficial Use, United States Department of Energy, National Energy Technology Laboratory, 2009 Search PubMed.
  8. Y. N. Mata, M. L. Blazquez, A. Ballester, F. Gonzalez and J. A. Munoz, J. Hazard. Mater., 2009, 163, 555–562 CrossRef CAS PubMed.
  9. A. F. Talebi, M. Tohidfar, S. M. Mousavi Derazmahalleh, A. Sulaiman, A. S. Baharuddin and M. Tabatabaei, BioMed Res. Int., 2015, 597198 Search PubMed.
  10. E. G. Bligh and W. J. Dyer, Can. J. Biochem. Physiol., 1995, 37, 911–917 CrossRef PubMed.
  11. A. F. Talebi, S. K. Mohtashami, M. Tabatabaei, M. Tohidfar, M. Zeinalabedini, H. Hadavand, A. Bagheri and S. Bakhtiari, Algal Res., 2013, 2, 258–267 CrossRef.
  12. A. F. Talebi, M. Tabatabaei and Y. Chisti, Biofuel Res. J., 2014, 1, 55–57 CrossRef.
  13. APHA, AWWA, WEF (American Public Health Association, American Water Works Association, Water Environment Federation), Standard Methods for the Examination of Water and Wastewater, APHA, 19th edn, Washington DC, 1995 Search PubMed.
  14. D. Tran, T. Vo, S. Portilla, C. Louime, N. Doan, T. Mai, D. Tran and T. Ho, Am. J. Environ. Sci., 2013, 9, 317–321 CrossRef.
  15. S. Elumalai, V. Prakasam and R. Selvarajan, Indian J. Sci. Technol., 2011, 4, 91–97 CAS.
  16. I. D. Termini, A. Prassone, C. Cattaneo and M. Rovatti, Ecol. Eng., 2011, 37, 976–980 CrossRef.
  17. A. F. Talebi, M. Tabatabaei, M. Tohidfar and A. Bagheri, Biofuel Res. J., 2014, 2, 70–76 Search PubMed.
  18. T. I. R. Utvik, Chemosphere, 1999, 39, 2593–2606 CrossRef CAS.
  19. Y. Chisti, J. Biotechnol., 2013, 167, 201–214 CrossRef CAS PubMed.
  20. R. Craggs, D. Sutherland and H. Campbell, J. Appl. Phycol., 2012, 24, 329–337 CrossRef CAS.
  21. S. Rasoul-Amini, N. Montazeri-Najafabady, S. Shaker, A. Safari, A. Kazemi, P. Mousavi, M. A. Mobasher and Y. Ghasemi, Biocatal. Agric. Biotechnol., 2014, 3, 126–131 Search PubMed.
  22. H. Chen and J. G. Jiang, J. Cell. Physiol., 2009, 219, 251–258 CrossRef CAS PubMed.
  23. U. Pick, A. Ben-Amotz, L. Karni, C. J. Seebergts and M. Avron, Plant Physiol., 1986, 81, 875–881 CrossRef CAS PubMed.
  24. A. F. Talebi, M. Tabatabaei, S. K. Mohtashami, M. Tohidfar and F. Moradi, Not. Sci. Biol., 2013, 5, 309 CAS.
  25. A. A. Issa, Phyton, 1996, 36, 295–302 CAS.
  26. A. Kirkpatrick, K. Pearson and J. Bauder, The Use of Coal Bed Methane Product Water to Enhance Wetland Function, 2003 Search PubMed.
  27. R. J. Craggs, S. Heubeck, T. J. Lundquist and J. R. Benemann, Water Sci. Technol., 2011, 63, 660–665 CrossRef CAS PubMed.
  28. D. W. O'Connell, C. Birkinshaw and T. F. O'Dwyer, Bioresour. Technol., 2008, 99, 6709–6724 CrossRef PubMed.
  29. J. Wang and C. Chen, Biotechnol. Adv., 2009, 27, 195–226 CrossRef CAS PubMed.
  30. D. Ojeda-Barrios, J. Abadía, L. Lombardini, A. Abadía and S. Vázquez, J. Sci. Food Agric., 2012, 92, 1672–1678 CrossRef CAS PubMed.
  31. I. Öncel, Y. Keleş and A. S. Üstün, Environ. Pollut., 2000, 107, 315–320 CrossRef.
  32. L. S. Ferreira, M. S. Rodrigues, J. C. M. de Carvalho, A. Lodi, E. Finocchio, P. Perego and A. Converti, Chem. Eng. J., 2011, 173, 326–333 CrossRef CAS.
  33. E. Finocchio, A. Lodi, C. Solisio and A. Converti, Chem. Eng. J., 2010, 156, 264–269 CrossRef CAS.
  34. S. K. Mehta and J. P. Gaur, Crit. Rev. Biotechnol., 2005, 25, 113–152 CrossRef CAS PubMed.
  35. A. Demirbas, J. Hazard. Mater., 2008, 157, 220–229 CrossRef CAS PubMed.
  36. I. Michalak and K. Chojnacka, Eng. Life Sci., 2010, 10, 209–217 CrossRef CAS.
  37. E. Romera, F. Gonzalez, A. Ballester, M. L. Blazquez and J. A. Munoz, Crit. Rev. Biotechnol., 2006, 26, 223–235 CrossRef CAS PubMed.
  38. S. Vendramel, J. P. Bassin, M. Dezottim and G. L. Sant'Anna Jr, Environ. Technol., 2015, 36, 2052–2059 CrossRef CAS PubMed.
  39. J. B. K. Park, J. Craggs and N. Shilton, Bioresour. Technol., 2011, 102, 35–42 CrossRef CAS PubMed.
  40. X. Zeng, X. Guo, G. Su, M. Danquah, S. Zhang, Y. Lu, Y. Sun and L. Lin, Renewable Sustainable Energy Rev., 2015, 42, 1385–1392 CrossRef CAS.

This journal is © The Royal Society of Chemistry 2016
Click here to see how this site uses Cookies. View our privacy policy here.