 Open Access Article
Creative Commons Attribution 3.0 Unported Licence
Phosphorus-containing polyimide fibers and their thermal properties
Diana
Serbezeanu
a,
Irina
Butnaru
ab,
Cristian-Dragos
Varganici
a,
Maria
Bruma
a,
Giuseppino
Fortunato
b and
Sabyasachi
Gaan
*b
a“Petru Poni” Institute of Macromolecular Chemistry, Aleea Gr. Ghica Voda 41A, 700487 Iasi, Romania
bEmpa, Swiss Federal Laboratories for Materials Science and Technology, Lerchenfeldstrasse 5, St. Gallen 9014, Switzerland. E-mail: sabyasachi.gaan@empa.ch
First published on 11th April 2016
Abstract
Phosphorus-containing polyimide was synthesized by solution polycondensation reaction of bis(3-aminophenyl) methyl phosphine oxide with 4,4′-(4,4′-isopropylidenediphenoxy)bis(phthalic anhydride). The chemical characterization of polyimide was done using FTIR and NMR spectroscopy. Also, the influence of different parameters on the rheological and thermal behavior of the polyimide was investigated. We were able to prepare uniform submicron- or nano-sized fibers by electrospinning highly viscous polyimide solutions. The diameters of the electrospun fibers increased from 58 nm to 347 nm as the concentration of the polyimide solution was raised from 10 to 24 wt%. Isoconversional kinetic analysis of the thermal decomposition of the polyimide was performed using Friedman and Ozawa–Flynn–Wall methods. The thermal decomposition mechanism of polyimide was evaluated and proposed using thermogravimetric analyzer-Fourier transform infrared spectroscopy (TGA-FTIR) and pyrolysis gas chromatography mass spectroscopy (Py-GC-MS). The results showed a complex degradation process of the main chain, which started with the scission of weaker bonds such as ether, alkyl, imide and some aromatic groups. The char residue of the polyimide fibers from TGA experiments were analyzed using scanning electron microscopy (SEM). It exhibited a dense structure, with a homogeneous dispersion of phosphorus atoms.
Introduction
Since the successful introduction of Kapton by Dupont in the early 1960s, newer aromatic polyimides are increasingly researched due to their desirable properties, such as high thermo-oxidative stability, unique electrical properties, high radiation and solvent resistance combined with good mechanical properties.1 However, the applications of fully aromatic polyimides are limited due their insolubility in common organic solvents and infusibility under conventional processing conditions. Due to their rigid structure, aromatic polyimides exhibit high glass transition temperatures and/or high crystalline melting points which also results in poor solubility and processability. The increasing need to improve the processability of polyimides stimulated the researchers to develop new structures which should be able to be processed using the imide form and not the intermediary precursor (polyamidic acids). The major drawbacks of polyamidic acids are their instability at room temperature and possible formation of voids as a result of water evaporation in the subsequent cyclodehydration stage. Therefore, by the introduction of various short flexible linkages, bulky substituents, alicyclic units or non-coplanar structures, a variety of properties were tailored to meet the requirements of the industry.1–10 Polyimides possess an inherent flame retardant (FR) behavior which may be enhanced by incorporating different phosphorus groups.1,6,7,11–14 Phosphorus-based FR compounds are non-toxic,15 and efficient, and do not represent issues associated with halogen-based FRs which are known to release heavy smoke and toxic gases during their thermal decomposition.16 Thus, by incorporating monomers containing phosphorus into macromolecular chains, several issues associated with the use of conventional FR additives, such as leaching and depletion over time, may be avoided. As compared to other phosphorus groups, phosphine oxide has some advantages, due to the hydrolytically stable P–C bonds (compared to phosphate) and the oxidatively stable P![[double bond, length as m-dash]](https://www.rsc.org/images/entities/char_e001.gif) O bonds (compared to phosphine).17
O bonds (compared to phosphine).17
Electrospinning is a versatile and a simple technique used to obtain ultrafine fibers with large surface to volume ratios, high porosity and uniform morphology.18 Two main directions for obtaining polyimide fibers were developed: (i) spinning of the polyamidic acid precursor solution followed by the imidization reaction, and (ii) spinning of polyimide solution, which represents a more convenient method. The obtained fibers may be used in the fabrication of a variety of materials with possible applications as conductive fibers, filtration membranes, water purification, protective clothing or tissue engineering scaffolds.19–23 In the polymer solution based electrospinning process a series of parameters may affect the morphology of the resulting fibers, such as: solution viscosity, polymer molecular weight, surface tension, flow rate, applied voltage, spinneret-collector distance and dielectric constants of solvent and polymer.24–26 Therefore, the synthesis of halogen-free polyimide nanofibers with high thermal stability and good flame resistant properties may be beneficial in applications which need thermostable and environmental friendly materials.
In this study we have evaluated the rheological properties of a phosphorus-containing polyimide with respect to their fiber forming properties including investigation of the thermal stability of the fibers for potential high temperature applications. Moreover, TGA-FTIR and Py-GC-MS were used to study the composition of the volatile products obtained after pyrolysis and elucidate the thermal degradation mechanism of the phosphorus-containing polyimide (P-PI).
Experimental
Materials
Diphenyl methyl phosphine oxide, sulfuric acid (96%), nitric acid (25%), hydrochloric acid (36%), dehydrated tin(II) chloride, ethanol, sodium hydroxide and chloroform were purchased from VWR International and used as received. N-Methyl pyrrolidone (NMP) (HPLC, 99.9% purity) and 4,4′-(4,4′-isopropylidenediphenoxy)bis(phthalic anhydride) were purchased from Aldrich and used without further purification. Bis(3-aminophenyl) methyl phosphine oxide was prepared by a two-step reaction according to published procedures.11,27 Thus, in the first step, diphenyl methyl phosphine oxide was nitrated using a mixture of concentrated sulfuric acid and nitric acid (ratio 8![[thin space (1/6-em)]](https://www.rsc.org/images/entities/char_2009.gif) :
:![[thin space (1/6-em)]](https://www.rsc.org/images/entities/char_2009.gif) 1) at low temperature. The resulting bis(3-nitrophenyl) methyl phosphine oxide was reduced by using a solution of dehydrated tin(II) chloride in ethanol and fuming hydrochloric acid at room temperature. The resulting salt was neutralized by using a NaOH solution and the product was extracted with chloroform. The solid product was recrystallized from dichloromethane to give bis(3-aminophenyl) methyl phosphine oxide with the melting point of 148 °C and an yield of 85%.
1) at low temperature. The resulting bis(3-nitrophenyl) methyl phosphine oxide was reduced by using a solution of dehydrated tin(II) chloride in ethanol and fuming hydrochloric acid at room temperature. The resulting salt was neutralized by using a NaOH solution and the product was extracted with chloroform. The solid product was recrystallized from dichloromethane to give bis(3-aminophenyl) methyl phosphine oxide with the melting point of 148 °C and an yield of 85%.
Synthesis of phosphorus-containing polyimide (P-PI)
The polyimide (Fig. 1) was prepared by solution polycondensation reaction of equimolar amounts of bis(3-aminophenyl) methyl phosphine oxide and 4,4′-(4,4′-isopropylidenediphenoxy)bis(phthalic anhydride) in NMP, as solvent, followed by thermal imidization in solution. In the first step the solid dianhydride was added to the solution of diamine in NMP at room temperature and the reaction was run for 20 h, yielding the corresponding polyamidic acid. The second step was performed by heating the polyamidic acid solution at 200 °C for 10 h. The resulted polyimide was isolated by precipitation in ethanol. The solid P-PI product was filtered, washed with ethanol and dried at 120 °C for 12 h.Electrostatic spinning
The spinning solutions P-PI were prepared by dissolving P-PI powder in DMF at room temperature for 8 h with stirring to obtain 2, 4, 8, 10, 14, 16, 18, 20, 22, 24 wt%. The electrospinning process was performed in horizontal mode and the equipment consisted of a medical infusion pump (KD scientific, USA), a static plate and two high voltage generators. A positive (needle) and a negative (collector) voltage supply source (AIP Wild AG, Switzerland) provided the electrostatic field. The whole equipment was placed in a grounded Faraday cage in a chemical hood. Polyimide solution was fed from a 1 mL plastic syringe equipped with a 21 gauge, stainless steel needle (diameter = 0.8 mm) at the nozzle. The electric potential was fixed between +10 ÷ 15 kV/−2 kV. The nanofibers were collected on an aluminum foil that was fixed on the plate collector. The solution was electrospun at room temperature (22 ± 1 °C) and the collection distance was 10 cm. The solution feed rate was set to 5 μL min−1 and 10 μL min−1.Measurements
The infrared spectra of fibers were obtained by using KBr pellets on a FTIR Bruker Vertex 70 analyzer. Scans were recorded between 4000 and 500 cm−1 at a resolution of 4 cm−1.NMR (400 MHz) spectra were performed at room temperature on a Bruker Avance-400 MHz spectrometer with automation and CP-MAS by using polymer solution in DMSO.
The solution viscosity was measured by using a rheometer (Anton Paar Physica MCR 301, Austria) equipped with a cone-plate geometry. The system was applied in controlled shear rate mode to assess the shear viscosities in function of the shear rate. Flow curves with shear rates varying from 0.01 to 500 s−1 were recorded at 20 °C.
The morphology and diameter of nanofibers were determined by using scanning electron microscopy (SEM, Hitachi S-4800 at Vacc = 2 kV, Ie = 10 mA). For this process, a small section of the electrospun nanofiber patch was sputtered with a thin layer of gold for 8 min at 2 × 10⁻² mbar (5 nm coating thickness) prior to SEM observation. For each sample, the average nanofiber diameter and standard deviation were calculated from the diameter measured for 50 fibers in three randomly selected areas using Image J software. Electrospinning of the P-PI solutions was performed in triplicate in order to assess repeatability of the process.
Differential scanning calorimetry (DSC) measurements were carried out on a Mettler T28E calorimeter. Samples (3–5 mg) were heated from 25 to 250 °C with a heating rate of 20 °C min−1 under nitrogen atmosphere.
Thermogravimetric analysis (TGA) (STA 449 F1 Jupiter, Netzsch) was performed to estimate the thermal stability of dry fibers. The fibers were heated up to 700 °C at a rate of 10 °C min−1 under nitrogen environment. The weight of sample was about 8 mg. Non-isothermal kinetic data were processed by using the software module “Thermokinetics 3” from Netzsch.
The P-PI powder was investigated by TGA-FTIR technique using the Netzsch TG 209 F1 Iris® instrument coupled with the Bruker TENSOR-27 FTIR instrument. For these experiments, 10 mg of samples were heated from 50 to 800 °C at a rate of 10 °C min−1 under a nitrogen flow (50 mL min−1). IR spectra were recorded in the spectral range from 4000 to 600 cm−1 with a resolution of 4 cm−1.
Py-GC-MS measurements were performed by placing 30–100 μg of polyimide in a quartz tube (1 mm internal diameter × 25 mm length). The polymer was then loaded in the pyrolysis probe (5200 (CDS Analytical, Inc., Oxford, PA)) and placed in the special inlet at the interface. The P-PI powder was pyrolyzed at 600 °C under helium atmosphere for 30 s. The volatiles were separated by a Hewlett-Packard 5890 Series II gas chromatograph and analyzed by a Hewlett-Packard 5989 Series mass spectrometer. GC column filled with cross-linked 5% PH-ME siloxane, 0.53 mm diameter and 30 m length, was employed. The GC oven was programmed to hold at 50 °C for 1 min. The oven was then heated from 50 to 250 °C at a heating rate of 10 °C min−1 and held at 250 °C for 5 min. Masses were scanned from m/z.
The distributions of P atoms on the surface of P-PI char residue were measured by using scanning electron microscope SEM type Quanta 200 operating at 30 kV with secondary and backscattering electrons in high vacuum mode. The elemental analysis on the char residue surface was obtained using coupled dispersive X-ray spectroscope (EDX) was used.
Results and discussion
Structural identification
The soluble phosphorus-containing polyimide (P-PI) (Fig. 1), was synthesized from an aromatic diamine, bis(3-aminophenyl) methyl phosphine oxide, and an aromatic dianhydride, 4,4′-(4,4′-isopropylidenediphenoxy)bis(phthalic anhydride), in NMP as solvent, followed by thermal imidization in solution.The chemical structure of the polyimide P-PI was confirmed by FTIR, 1H NMR and 31P NMR spectroscopy. In the FTIR spectrum strong absorption bands appeared at 1779 cm−1 due to the asymmetric vibration of the carbonyl imide ring, at 1719 cm−1 attributed to the symmetric vibration of carbonyl imide ring, at 1370 cm−1 characteristic for C–N stretching and at 720 cm−1 corresponding to the imide ring deformation. These absorption bands confirmed the formation of the imide ring. Also, the polymer showed characteristic absorption bands at 2970 cm−1 and 2870 cm−1 due to methyl group and at 1230 cm−1 due to the aromatic ether linkage Ar–O–Ar. The FTIR spectrum also showed absorption bands centered at 1479 and 1205 cm−1, which are characteristic to P–Ar and P![[double bond, length as m-dash]](https://www.rsc.org/images/entities/char_e001.gif) O units, respectively. Absorption bands between 3400–3600 cm−1 (–OH stretching vibration), 1700 cm−1 (C
O units, respectively. Absorption bands between 3400–3600 cm−1 (–OH stretching vibration), 1700 cm−1 (C![[double bond, length as m-dash]](https://www.rsc.org/images/entities/char_e001.gif) O stretching of carboxylic acid) and 1660 cm−1 (C
O stretching of carboxylic acid) and 1660 cm−1 (C![[double bond, length as m-dash]](https://www.rsc.org/images/entities/char_e001.gif) O amide stretching vibration) did not appear in FTIR spectrum of P-PI powder, indicating complete conversion of polyamidic acid to polyimide.
O amide stretching vibration) did not appear in FTIR spectrum of P-PI powder, indicating complete conversion of polyamidic acid to polyimide.
1H NMR spectrum evidenced no residual peak characteristic to amide protons, which further confirms the complete imidization process of P-PI. The peak at 1.66 ppm (s, 6H) was attributed to the protons from the isopropylidene unit (–C(C![[H with combining low line]](https://www.rsc.org/images/entities/i_char_0048_0332.gif)
![[3 with combining low line]](https://www.rsc.org/images/entities/i_char_0033_0332.gif) )2), while the peak at 2.05 ppm (d, 3H) was characteristic for aliphatic protons from phosphine oxide unit (–P(O)–C
)2), while the peak at 2.05 ppm (d, 3H) was characteristic for aliphatic protons from phosphine oxide unit (–P(O)–C![[H with combining low line]](https://www.rsc.org/images/entities/i_char_0048_0332.gif)
![[3 with combining low line]](https://www.rsc.org/images/entities/i_char_0033_0332.gif) ). The aromatic protons from the main chain were identified in the 7.06–7.91 ppm region (m, 22Har). 31P NMR spectrum showed a single peak at 27.36 ppm proving the existence of a single phosphorus species.
). The aromatic protons from the main chain were identified in the 7.06–7.91 ppm region (m, 22Har). 31P NMR spectrum showed a single peak at 27.36 ppm proving the existence of a single phosphorus species.
Solution properties
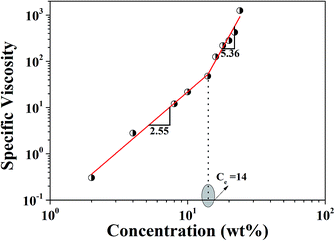
The synthesized P-PI was soluble in NMP, N,N-dimethylformamide (DMF), N,N-dimethyl acetamide (DMAc) and dimethyl sulfoxide (DMSO). Rheological properties of P-PI solutions were studied in order to obtain their flow characteristics and to understand the influence of polymer concentrations and viscosity on the fiber formation process. The apparent viscosity of the initial polymer solution measured at a shear rate of 100 s−1 increased from 0.001 to 1.1 Pa s as the concentration of P-PI was increased from 2 to 24 wt%. Changes in viscosity could be attributed to increased polymer chain entanglement and to the molecular interaction of P-PI at higher concentration.Fig. 2 presents the zero shear viscosity plotted as a function of polymer concentration. The change in slope indicates the existence of two distinct regimes corresponding to the semidilute unentangled and semidilute entangled regimes. In the semidilute unentangled domain, viscosity (η) varies with concentration (C) as η ≈ C2.55, while the viscosity in semidilute entanglement regime is much higher (η ≈ C5.36). The entanglement concentration (Ce) was determined as the concentration corresponding to the slope change of the respective linear regressions for the two regimes. The crossover between these two regions is at C ≈ 14, which corresponds to the critical chain entanglement concentration. Starting at this concentration, significant chain entanglement interactions take place in solution. At C ≤ 14, fiber formation was observed, with increasing uniformity as a function of polymer solution concentration being attributed to sufficient chain entanglements.
Fiber morphology
Electrospinning processing parameters such as solution concentration, spinning voltage and feeding rate were investigated in order to assess optimal conditions of the electrospinning of P-PI solutions. In the electrospinning process, polymer solution viscosity is considered to be the most critical factor regarding morphology, particularly the average fiber diameter of electrospun fibers.28 This parameter is correlated with polymer molecular properties (chemical structure, molecular weight distribution)29–31 and with the entanglements within the spinning solutions (polymer concentration, polymer–solvent interaction).29,30,32 Different concentrations of P-PI solutions in DMF at 22 °C and at 27% RH were tested. The morphologies of the obtained electrospun fibers are presented in Fig. 3. In these cases all other spinning parameters (spinning voltage, working distance and feeding rate) were kept constant. Significant modifications in the morphology of the fibers were observed with increase in the concentration and thus viscosity of P-PI solution. At low viscosity values, the viscoelastic force in a given jet segment cannot counter the coulombic force, and consequently the charged jet is broken-up in smaller jets, leading to the formation of beaded fibers and beads. At higher viscosity values, the viscoelastic force counters the coulombic force and even more, it is high enough to allow the coulombic stress to further elongate the charged jet in order to give thinner, smooth fibers.33 Indeed, SEM micrographs (Fig. 3) clearly show that the fiber morphology is affected by polymer solution concentration/viscosity. As P-PI solution concentration increases, the morphology changes from beads (Fig. 3a) to fibers with beads (Fig. 3b and c) or uniform fibers only (Fig. 3d). Table 1 presents the average diameter of P-PI fibers electrospun from various concentrations of P-PI in DMF. It can be observed that the average fiber diameter increased with increasing polymer concentration. Thus, with increase in P-PI concentration the morphology gradually changed from beaded fibers to smoother fibers. The average fiber diameters of the phosphorus-containing polyimide increased from 58 ± 15 to 347 ± 94 nm, as the concentration of P-PI solutions increased from 10 wt% to 24 wt%.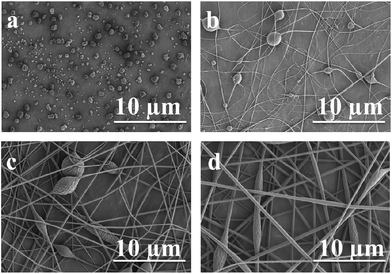 | ||
| Fig. 3 Scanning electron micrographs of electrospun P-PI solutions with concentrations of (a) 4 wt%, (b) 14 wt%, (c) 20 wt% and (d) 24 wt%. | ||
| Sample | Concentration [wt%] | Viscositya [Pa s] | Fiber diameter [nm] | |
|---|---|---|---|---|
| 10 kV | 15 kV | |||
| a Determined at a shear rate of 100 s−1. | ||||
| P-PI-2 | 2 | 0.001 | — | — |
| P-PI-4 | 4 | 0.004 | — | — |
| P-PI-8 | 8 | 0.012 | — | — |
| P-PI-10 | 10 | 0.021 | — | 58 ± 15 |
| P-PI-14 | 14 | 0.045 | 53 ± 23 | 65 ± 25 |
| P-PI-16 | 16 | 0.116 | 146 ± 53 | 169 ± 45 |
| P-PI-18 | 18 | 0.202 | 160 ± 66 | 177 ± 49 |
| P-PI-20 | 20 | 0.265 | 175 ± 58 | 194 ± 72 |
| P-PI-22 | 22 | 0.390 | 162 ± 66 | 217 ± 53 |
| P-PI-24 | 24 | 1.100 | 277 ± 69 | 347 ± 99 |
Another parameter which may influence the morphology of fibers is the applied voltage. From Table 1 it can be observed that the average fiber diameter increased with increasing spinning voltage. As reported previously at a higher applied voltage, Taylor cone formation becomes stable and the repulsion between coulombic force within the electrospun solution jet determines an insufficient time for the spinning solution to be developed, leading to an increase in the average fiber diameter.34 As can be seen in Fig. 4b and d and Table 1 the average fiber diameter increases when the applied voltage was raised from 10 kV to 15 kV. Feed rate did not have a significant effect on the average fiber diameter. Once the feed rate is sufficient to obtain fibers, higher feed rate only provides more polymer solution than needed. Indeed, it was observed that the amount of excess polymer solution formed at the needle tip increases with increasing feeding rate.
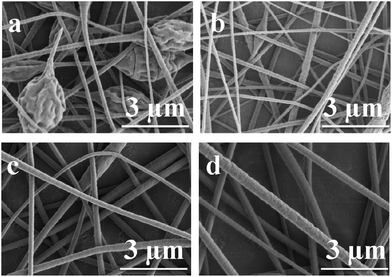 | ||
| Fig. 4 Scanning electron micrographs of electrospun P-PI solution with (a) 22 wt%, voltage 10 kV; (b) 22 wt%, voltage 15 kV; (c) 24 wt%, voltage 10 kV and (d) 24 wt%, voltage 15 kV. | ||
The preliminary experiments showed that the optimum conditions to produce uniform fibers for the present study were: 24 wt% polyimide solution with a 0.8 mm gauge needle at a feed rate of 10 μL min−1, the collecting distance of 10 cm, and the voltage of 15 kV. The average fiber diameter was around 347 nm.
Thermal stability and thermal degradation kinetics
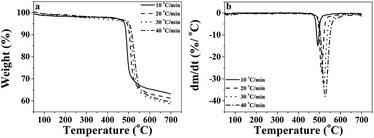
The thermal stability of the P-PI powder and P-PI fibers was evaluated by DSC and TGA. From the DSC measurement it was observed that the Tg for these two samples was 215 °C. The polyimide P-PI has a relatively high Tg in comparison with that of most conventional aromatic PI containing flexible linkages.35 Polyimide powder and polyimide fibers showed amorphous morphology without any melting or crystallization transitions.In order to evaluate the potential applications of phosphorus containing polyimide at elevated temperatures, the thermal degradation behavior of P-PI fibers was analyzed. Fig. 5a shows the thermogravimetric (TG) curves and Fig. 5b presents the derivative thermogravimetric (DTG) curves at different heating rates for the electrospun P-PI fibers. The temperature of 5 wt% loss of PI fibers was 479 °C. P-PI fibers showed one step degradation which is attributed to macromolecular chain scission. On the DTG curves of P-PI fibers at different heating rates (Fig. 5b), one may observe that the peak temperature (Tmax = 490 °C) shifted to higher values with the increase of heating rate. The char measured at 700 °C was approximately 63%. The high amount of char formation compared to classical aromatic polyimides may be attributed to the formation of char residue which acts in the condensed phase as a flame retardant;36 also indicating that carbonization of polymer at elevated temperature plays an important role in the solid-phase pyrolytic mechanism.
In order to determine the global kinetic parameters of P-PI fibers, two isoconversional thermal decomposition processes were used. These methods use the shifts in thermogravimetric curves with the increase of the heating rate.33–36
The Friedman method37 applies the differential form of the rate equation (eqn (1)), where t is time (min), T is temperature (K), E is the activation energy of thermal decomposition (kJ mol−1), A is the pre-exponential factor (s−1), R is the gas constant (8.314 kJ mol−1), f(α) is the conversion function and β is the heating rate:
 | (1) |
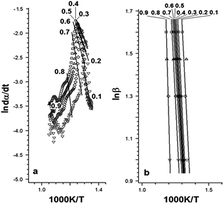
The plot of ln![[thin space (1/6-em)]](https://www.rsc.org/images/entities/char_2009.gif) dα/dt versus 1/T, for α = constant extracted from the thermograms recorded at different heating rates was a straight line. The activation energy was evaluated based on the slope of this line.
dα/dt versus 1/T, for α = constant extracted from the thermograms recorded at different heating rates was a straight line. The activation energy was evaluated based on the slope of this line.
The Ozawa–Flynn–Wall method uses the integral form of the rate equation, in which, by integrating between limits T0 and Tp, the integral function of conversion in eqn (2), noted G(α), is obtained.
 | (2) |
![[thin space (1/6-em)]](https://www.rsc.org/images/entities/char_2009.gif) β as a function of 1/T plot.
β as a function of 1/T plot.
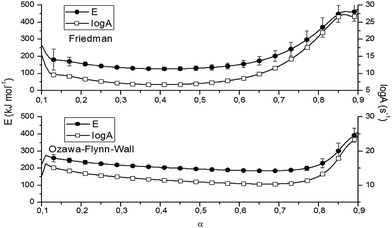
Fig. 6 and Table 2 present the Ozawa–Flynn–Wall and Friedman plots and the global kinetic parameters values, ranging between 0.1 and 0.9. Fig. 7 shows the variation of kinetic parameters values with conversion degree.
| α | Kinetic parameters | |||
|---|---|---|---|---|
| Friedman | Ozawa–Flynn–Wall | |||
| E (kJ mol−1) | log![[thin space (1/6-em)]](https://www.rsc.org/images/entities/char_2009.gif) A (s−1) A (s−1) |
E (kJ mol−1) | log![[thin space (1/6-em)]](https://www.rsc.org/images/entities/char_2009.gif) A (s−1) A (s−1) |
|
| 0.1 | 266 | 15.3 | 224 | 12.8 |
| 0.2 | 159 | 8.6 | 237 | 13.6 |
| 0.3 | 135 | 7.2 | 218 | 12.4 |
| 0.4 | 128 | 6.8 | 205 | 12 |
| 0.5 | 132 | 7.1 | 195 | 11 |
| 0.6 | 152 | 8.4 | 196 | 11.1 |
| 0.7 | 211 | 12.2 | 197 | 11.2 |
| 0.8 | 350 | 21 | 219 | 12.6 |
| 0.9 | 479 | 27.6 | 415 | 24.7 |
By analyzing Fig. 7 and Table 2, one may observe an initial slight decrease in kinetic parameters values at the beginning of the decomposition process (0 < α < 0.12), associated with cleavage initiation of some weak linkages. They may be attributed to dehydration and initiation of depolymerization (low α).33 For 0.1 < α < 0.5, the values of E for P-PI fibers slowly decreased; then an increase in the range 0.6 < α < 0.9 may be observed. The increase of E values is correlated with the consumption of the weak linkage, polymer backbone decomposition and probably some unstable reaction products formed during thermal degradation.33,38 The variation of E versus α is an evidence of the complex degradation mechanism of P-PI fibers.37 Probably, the decomposition in polyimide started with the scission of the weaker isopropylidene and P–C bonds and continued with the degradation of the macromolecular chain, e.g. formation of volatile compounds (at moderate α) and char residue (at higher α). This assumption is based on previous thermal studies that is focused on various phosphorus-containing polymers.38–40
TGA-FTIR was used to analyze the formation of volatile products formed during the thermal degradation of P-PI fibers. The FTIR spectra of volatile products at different temperatures from 147 to 700 °C are presented in Fig. 8a while the FTIR spectra at 477, 491 and 700 °C are presented in Fig. 8b. As previously shown, at lower temperatures the most important absorption bands in the FTIR spectrum of P-PI are associated with aromatic C–H (3065 cm−1, stretching vibration), aliphatic C–H (2970 cm−1 and 2870 cm−1, asymmetric and symmetric stretching vibrations), C![[double bond, length as m-dash]](https://www.rsc.org/images/entities/char_e001.gif) O (1779 cm−1 and 1719 cm−1, asymmetric and symmetric stretching vibrations), ether C–O–C (1230 cm−1, stretching vibration), P–CH3 (1308 cm−1, stretching vibrations), P–Ar (1479 cm−1, stretching vibrations) and P
O (1779 cm−1 and 1719 cm−1, asymmetric and symmetric stretching vibrations), ether C–O–C (1230 cm−1, stretching vibration), P–CH3 (1308 cm−1, stretching vibrations), P–Ar (1479 cm−1, stretching vibrations) and P![[double bond, length as m-dash]](https://www.rsc.org/images/entities/char_e001.gif) O (1205 cm−1, stretching vibrations). Additional characteristic peak of CH4 (3015 cm−1) can also be seen in the gases evolved at 477 and 491 °C. The peak at about 2369 cm−1 which was evidenced at 400 °C indicates the appearance of CO2. The gases CO2, CO, CH4 and water vapour are predominant in the FTIR spectra from 400 to 700 °C (Fig. 8a). The presence of traces of water that always exist in the polymer sample can promote a hydrolysis reaction of the imide groups.41 The decarboxylation reaction and the cleavage of carbonyl groups from imide ring, lead to the formation of CO2, while CO was formed by the scission of ether and C
O (1205 cm−1, stretching vibrations). Additional characteristic peak of CH4 (3015 cm−1) can also be seen in the gases evolved at 477 and 491 °C. The peak at about 2369 cm−1 which was evidenced at 400 °C indicates the appearance of CO2. The gases CO2, CO, CH4 and water vapour are predominant in the FTIR spectra from 400 to 700 °C (Fig. 8a). The presence of traces of water that always exist in the polymer sample can promote a hydrolysis reaction of the imide groups.41 The decarboxylation reaction and the cleavage of carbonyl groups from imide ring, lead to the formation of CO2, while CO was formed by the scission of ether and C![[double bond, length as m-dash]](https://www.rsc.org/images/entities/char_e001.gif) O bonds. The primary occurrence of the CH4 is connected with the decomposition of methyl (–CH3) groups in the isopropylidene linkage of bisphenol A units which takes place under high temperatures. In Fig. 8b the more significant spectra of evolved volatile compounds obtained during the thermal degradation process are shown. At 477 and 491 °C the noise-like bands at 3500–3900 cm−1 correspond to the volatilization of water. In the FTIR spectrum registered at 491 °C the bands at 1605 and 1511 cm−1 were attributed to C
O bonds. The primary occurrence of the CH4 is connected with the decomposition of methyl (–CH3) groups in the isopropylidene linkage of bisphenol A units which takes place under high temperatures. In Fig. 8b the more significant spectra of evolved volatile compounds obtained during the thermal degradation process are shown. At 477 and 491 °C the noise-like bands at 3500–3900 cm−1 correspond to the volatilization of water. In the FTIR spectrum registered at 491 °C the bands at 1605 and 1511 cm−1 were attributed to C![[double bond, length as m-dash]](https://www.rsc.org/images/entities/char_e001.gif) C stretching vibrations of aromatic rings. The absorption bands above and below 3000 cm−1 are related to sp2 and sp3 C–H stretching vibrations attributed to compounds containing aromatic and aliphatic groups. The spectrum also showed absorption bands characteristics to the vibrations of carbonyl imide ring at 1791, 1721 cm−1 and of ether linkage at, 1255 and 1180 cm−1. Furthermore, this spectrum exhibited a peak at 750 cm−1, representative of phenolic derivatives. Also a number of phosphorus compounds were detected at 1479 cm−1 (P–Ar), 1308 cm−1 (P–CH3) and 1205 cm−1 (P
C stretching vibrations of aromatic rings. The absorption bands above and below 3000 cm−1 are related to sp2 and sp3 C–H stretching vibrations attributed to compounds containing aromatic and aliphatic groups. The spectrum also showed absorption bands characteristics to the vibrations of carbonyl imide ring at 1791, 1721 cm−1 and of ether linkage at, 1255 and 1180 cm−1. Furthermore, this spectrum exhibited a peak at 750 cm−1, representative of phenolic derivatives. Also a number of phosphorus compounds were detected at 1479 cm−1 (P–Ar), 1308 cm−1 (P–CH3) and 1205 cm−1 (P![[double bond, length as m-dash]](https://www.rsc.org/images/entities/char_e001.gif) O).
O).
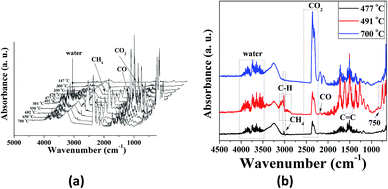 | ||
| Fig. 8 FTIR spectra of volatile products for P-PI fibers at different temperatures (a) and at 477, 491 and 700 °C (b). | ||
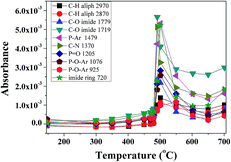
The evolution of absorbance intensity of volatile compounds with increasing temperature is shown in Fig. 9. In accordance with DTG curve, each component has just one peak.
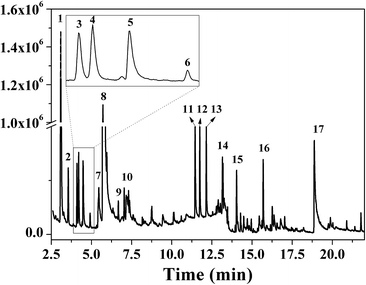
FTIR spectra provide only information about the functional groups present in the volatile species evolved during materials decomposition. Thus, mass spectroscopy was used to establish the exact composition of the pyrolysis products. Fig. 10 shows the Py-GC-MS total ion chromatogram and Table 3 presents the identified evolved gaseous products of the P-PI pyrolyzed at 600 °C. The decomposition of P-PI leads to the formation of toluene (retention time: Rt = 3.088 min), phenol (Rt = 5.712 min), benzonitrile (Rt = 5.784 min), 4-(1-methylvinyl)-1-phenoxybenzene (Rt = 15.696 min) and isoindole-1,3-dione-2-phenyl (Rt = 18.874 min) (Table 3 and Fig. 10). These products correspond to the degradation of alkyl chain and some aromatic molecules from P-PI.
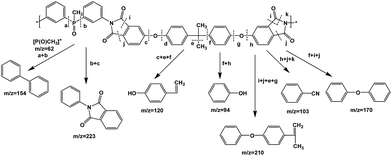
A proposed mechanism of the decomposition of P-PI during pyrolysis is presented in Fig. 11. The P-PI cleavage formulates new lower molecular weight molecules as a result of the scission of ether, isopropylidene and imide groups.
Morphological and spectral characterization of char residue
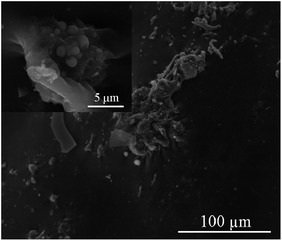
SEM was used to evaluate the morphology of the residual char after pyrolysis (TGA experiments). Fig. 12 shows the morphology of residual char surface at different magnifications. A continuous and dense structure without any cracks was observed. Furthermore, no pores can be observed on the surface of the residues. All these informations indicate that P-PI can promote the formation of dense char layer, enhancing char stability, which is in accordance with results obtained from TGA data. Indeed, in Fig. 5a it can be observed that the char residue showed a slight weight loss above 600 °C (below 5 wt%). This can be attributed to the advanced pyrolysis of the protective phosphorus-rich carbonaceous layer.42Fig. 13 presents the atoms distribution onto the residual char surface of P-PI fibers, as shown by electron X-ray diffraction (EDX). As it may be observed, the phosphorus atoms were uniformly dispersed onto the residual char surface.
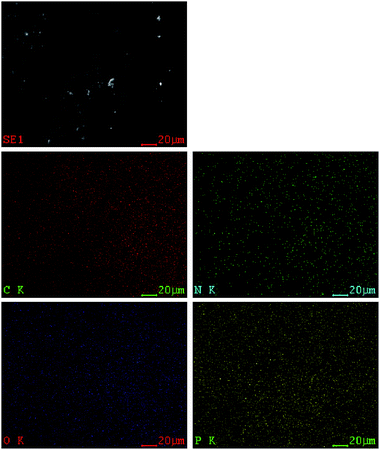 | ||
| Fig. 13 EDX mapping of the char residue of P-PI (SE mode, 20 kV, C: carbon; O: oxygen; N: nitrogen; P: phosphorus). | ||
Furthermore, in the FTIR spectrum of the char residue obtained after heating P-PI fibers at 700 °C, characteristic absorption bands for functional groups of phosphorus-containing polyimide were observed at 1118 cm−1, attributed to P![[double bond, length as m-dash]](https://www.rsc.org/images/entities/char_e001.gif) O stretching vibrations and at 879 cm−1, associated to P–O–Ar linkages.
O stretching vibrations and at 879 cm−1, associated to P–O–Ar linkages.
Conclusions
Phosphorus-containing polyimide (P-PI) fibers were successfully prepared by electrospinning solutions of different concentrations. The influence of electrospinning parameters such as viscosity or concentration of polymer, applied voltage and feed rate, on the morphology of the resulting fibers, were investigated. It was shown that the morphology of electrospun fibers strongly depended on the viscosity of P-PI solution. High concentrations of P-PI in DMF were beneficial to form more uniform nanofibers. The global kinetic parameters were studied using two isoconversional methods. The results showed a complex degradation process of the main chain which started with the scission of weaker bonds. The thermal decomposition was further investigated by using TGA-FTIR and Py-GC-MS analyses. TGA-FTIR provided information regarding the presence of polyimide characteristic functional groups and at higher temperatures additional CO, CO2, CH4 and water resulted from the cleavage of ether, carbonyl and isopropylidene groups.The products identified with the Py-GC-MS analyses enabled the formulation of a possible degradation mechanism which corresponds, according with TGA-FTIR, to a thermal decomposition of ether, alkyl, imide and some aromatic chains. The morphological characterization of the solid residue evidenced a dense structure with the phosphorus atom homogenously dispersed in the solid residue.
Acknowledgements
The authors thank for the financial support provided by SCIEX Program, no. 12357; one author (CDV) acknowledges the financial support of CNCSIS–UEFISCDI, Project Numbers PN-II-RU-TE-0123 nr. 28/29.04.2013 and PN-II-ID-PCE-2011-3-0187.Notes and references
- D.-J. Liaw, K.-L. Wang, Y.-C. Huang, K.-R. Lee, J.-Y. Lai and C.-S. Ha, Prog. Polym. Sci., 2012, 37, 907–974 CrossRef CAS.
- L. Christiani, S. Hilaire, K. Sasaki and M. Nishihara, J. Polym. Sci., Part A: Polym. Chem., 2014, 52, 2991–2997 CrossRef CAS.
- I. Butnaru, M. Bruma, T. Kopnick and J. Stumpe, Macromol. Chem. Phys., 2013, 214, 2454–2464 CrossRef CAS.
- C.-H. Chang, K.-L. Wang, J.-C. Jiang, D.-J. Liaw, K.-R. Lee, J.-Y. Lai and K.-H. Lai, Polymer, 2010, 51, 4493–4502 CrossRef CAS.
- G.-S. Liou, Y.-L. Yang and Y. O. Su, J. Polym. Sci., Part A: Polym. Chem., 2006, 44, 2587–2603 CrossRef CAS.
- C. Hamciuc, E. Hamciuc, D. Serbezeanu and T. Vlad-Bubulac, Polym. Adv. Technol., 2011, 22, 2458–2468 CrossRef CAS.
- C. Hamciuc, E. Hamciuc, D. Serbezeanu, T. Vlad-Bubulac and M. Cazacu, Polym. Int., 2011, 60, 312–321 CrossRef CAS.
- C.-M. Chung, J.-H. Lee, S.-Y. Cho, J.-G. Kim and S.-Y. Moon, J. Appl. Polym. Sci., 2006, 101, 532–538 CrossRef CAS.
- Y.-H. Kim, H.-S. Kim and S.-K. Kwon, Macromolecules, 2005, 38, 7950–7956 CrossRef CAS.
- K. Kudo, D. Nonokawa, J. Li and S. Shiraishi, J. Polym. Sci., Part A: Polym. Chem., 2002, 40, 4038–4044 CrossRef CAS.
- B. Tan, C. N. Tchatachoua, L. Dong and J. E. McGrath, Polym. Adv. Technol., 1998, 9, 84–93 CrossRef CAS.
- Y. Zhu, P. Zhao, X. Cai, W.-D. Meng and F.-L. Qing, Polymer, 2007, 48, 3116–3124 CrossRef CAS.
- C. H. Lin, S. L. Chang and P. W. Cheng, J. Polym. Sci., Part A: Polym. Chem., 2011, 49, 1331–1340 CrossRef CAS.
- E. Çakmakçı and A. Güngör, Polym. Degrad. Stab., 2013, 98, 927–933 CrossRef.
- C. Hirsch, B. Striegl, S. Mathes, C. Adlhart, M. Edelmann, E. Bono and S. Gaan, et al. , Arch. Toxicol., 2016, 1–19 Search PubMed.
- E. D. Weil, in Handbook of Organophosphorus Chemistry, Marcel Dekker, New York, 1992 Search PubMed.
- S. Maiti, S. Banerjee and S. K. Palit, Prog. Polym. Sci., 1993, 18, 227–261 CrossRef CAS.
- T. Subbiah, G. S. Bhat, R. W. Tock, S. Parameswaran and S. S. Ramkumar, J. Appl. Polym. Sci., 2005, 96, 557–569 CrossRef CAS.
- I. Shabani, M. M. Hasani-Sadrabadi, V. Haddadi-Asl and M. Soleimani, J. Membr. Sci., 2011, 368, 233–240 CrossRef CAS.
- N. Seki, T. Arai, Y. Suzuki and H. Kawakami, Polymer, 2012, 53, 2062–2067 CrossRef CAS.
- Y. Yang, X. Li, L. Cheng, S. He, J. Zou, F. Chen and Z. Zhang, Acta Biomater., 2011, 7, 2533–2543 CrossRef CAS PubMed.
- Z. Ma, H. Ji, Y. Teng, G. Dong, J. Zhou, D. Tan and J. Qiu, J. Colloid Interface Sci., 2011, 358, 547–553 CrossRef CAS PubMed.
- R. Gopal, S. Kaur, Z. Ma, C. Chan, S. Ramakrishna and T. Matsuura, J. Membr. Sci., 2006, 281, 581–586 CrossRef CAS.
- P. Gupta, C. Elkins, T. E. Long and G. L. Wilkes, Polymer, 2005, 46, 4799–4810 CrossRef CAS.
- W. Zuo, M. Zhu, W. Yang, H. Yu, Y. Chen and Y. Zhang, Polym. Eng. Sci., 2005, 45, 704–709 CAS.
- J. M. Deitzel, J. Kleinmeyer, D. Harris and N. C. Beck Tan, Polymer, 2001, 42, 261–272 CrossRef CAS.
- W.-K. Chin, M.-D. Shau and W.-C. Tsai, J. Polym. Sci., Part A: Polym. Chem., 1995, 33, 373–379 CrossRef CAS.
- D. Serbezeanu, A. M. Popa, I. Sava, I.-D. Carja, M. Amberg, R. M. Rossi and G. Fortunato, Eur. Polym. J., 2015, 64, 10–20 CrossRef CAS.
- J. Lin, B. Ding, J. Yang, J. Yu and G. Sun, Nanoscale, 2012, 4, 176–182 RSC.
- S. A. Theron, E. Zussman and A. L. Yarin, Polymer, 2004, 45, 2017–2030 CrossRef CAS.
- C. L. Casper, J. S. Stephens, N. G. Tassi, D. B. Chase and J. F. Rabolt, Macromolecules, 2003, 37, 573–578 CrossRef.
- S. L. Shenoy, W. D. Bates, H. L. Frisch and G. E. Wnek, Polymer, 2005, 46, 3372–3384 CrossRef CAS.
- C. J. Buchko, L. C. Chen, Y. Shen and D. C. Martin, Polymer, 1999, 40, 7397–7407 CrossRef CAS.
- T. Mazoochi, M. Hamadanian, M. Ahmadi and V. Jabbari, International Journal of Industrial Chemistry, 2012, 3, 2 CrossRef.
- W. Liu, Polym. Eng. Sci., 2010, 50, 1547–1557 CAS.
- B. Schartel, Materials, 2010, 3, 4710–4745 CrossRef CAS.
- P. Budrugeac, Polym. Degrad. Stab., 2005, 89, 265–273 CrossRef CAS.
- Y.-L. Liu, C.-S. Wu, Y.-S. Chiu and W.-H. Ho, J. Polym. Sci., Part A: Polym. Chem., 2003, 41, 2354–2367 CrossRef CAS.
- I. D. Carja, C. Hamciuc, E. Hamciuc, T. Vlad-Bubulac, D. Serbezeanu and G. Lisa, Rev. Roum. Chim., 2012, 57, 623–628 CAS.
- I.-D. Carja, D. Serbezeanu, G. Lisa, T. Vlad-Bubulac and C. Hamciuc, Int. J. Polym. Anal. Charact., 2014, 19, 372–382 CrossRef CAS.
- H. Farong, W. Xueqiu and L. Shijin, Polym. Degrad. Stab., 1987, 18, 247–259 CrossRef.
- I.-D. Carja, D. Serbezeanu, T. Vlad-Bubulac, C. Hamciuc, A. Coroaba, G. Lisa and C. G. Lopez, et al. , J. Mater. Chem. A, 2014, 2, 16230–16241 CAS.
| This journal is © The Royal Society of Chemistry 2016 |


