Influence of support on the performance of copper catalysts for the effective hydrogenation of ethylene carbonate to synthesize ethylene glycol and methanol

Fengjiao Liab, Liguo Wang*a, Xiao Hana, Peng Hea, Yan Caoa and Huiquan Li*a
aKey Laboratory of Green Process and Engineering, National Engineering Laboratory for Hydrometallurgical Cleaner Production Technology, Institute of Process and Engineering, Chinese Academy of Sciences, Beijing, 100190, P. R. China. E-mail: lgwang@ipe.ac.cn; hqli@ipe.ac.cn; Fax: +86 10 62621355; Tel: +86 10 82544825
bUniversity of Chinese Academy of Sciences, Beijing, 100049, P. R. China

Received 11th March 2016 , Accepted 4th May 2016

First published on 5th May 2016


Abstract

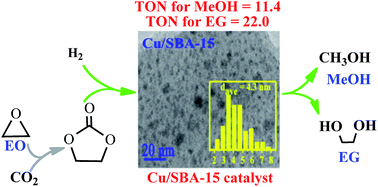
Hydrogenation of ethylene carbonate (EC) is an attractive and promising approach for indirect hydrogenation of CO2 to co-produce ethylene glycol (EG) and methanol (MeOH). In this work, thermodynamics of EC hydrogenation was firstly calculated, and the results disclosed that EC hydrogenation is exothermic (ΔrHθm = −71.59 kJ mol−1) and thermodynamically favorable (ΔrGθm = −25.62 kJ mol−1). The mesoporous silica supported copper catalysts were successfully prepared by facile ammonia evaporation method using KIT-6, MCM-41 and SBA-15 as support materials. The as-prepared Cu/KIT-6, Cu/MCM-41 and Cu/SBA-15 were thoroughly characterized by N2 physisorption, ICP-AES, N2O titration, FT-IR, XRD, H2-TPR, TEM, XPS and XAES. It was found that copper nanoparticles were well dispersed on these supports. Interestingly, a larger metallic Cu surface area with higher dispersion was obtained on SBA-15 when compared with KIT-6 and MCM-41. Furthermore, Cu0 and Cu+ species in various ratios were verified to co-exist on the surfaces of the three catalysts, which originated from CuO and copper phyllosilicate, respectively. The catalytic performances showed that Cu/SBA-15 exhibited a superior catalytic activity with a TON of 22.0 and 11.4 (mol mol−1) towards EG and MeOH, respectively. Importantly, 100% of EC conversion, 94.7% of EG yield and 62.3% of MeOH yield were achieved within a short reaction time of 4 h over Cu/SBA-15 under optimized conditions. The synergetic effect between Cu0 and Cu+ species, in which it was proposed that Cu0 species dissociated H2, while Cu+ species absorbed the carbonyl group of EC, was responsible for the higher catalytic activity of Cu/SBA-15.


1. Introduction

As an abundant, nontoxic and renewable carbon source, CO2 has been widely used as a C1 feedstock for manufacturing chemicals and fuels in terms of environmental concerns and sustainable society.1–5 Particularly, significant efforts have been made to transform CO2 with renewable hydrogen to methanol, which is considered to be a vital step for building up a methanol economy,6 as methanol is an excellent hydrogen carrier,7 an alternative transportable liquid fuel and additive for fuel cells,8,9 and a useful feedstock for producing various valuable chemicals such as olefins and aromatics.10,11 Very recently, several approaches for indirect hydrogenation of CO2 via organic carbonates, carbamates and formates to methanol are drawing growing interest from the viewpoint of both concept and industrialization.12–14 Among these approaches, indirect hydrogenation of CO2 via ethylene carbonate (EC) intermediate to co-produce ethylene glycol (EG) and methanol (MeOH) was proposed and realized over a homogeneous pincer-type RuII complex catalyst by Ding et al.,15 which has been considered as a very attractive and promising approach to co-produce valuable methanol and ethylene glycol indirectly from CO2. Because EC can be largely and industrially available from ethylene oxide (EO) and CO2, more attention should be focused on developing effective catalyst systems especially recyclable heterogeneous catalysts for EC hydrogenation. Up to now, merely a few heterogeneous Cu-based catalysts such as CuCr2O4,8 Cu–SiO2-PG16 and Cu/HMS17 have been reported to catalyze the hydrogenation of EC to synthesize EG and methanol. However, there has been no clear awareness of thermodynamic of EC hydrogenation to co-produce EG and methanol. Moreover, it is often controversial with respect to the roles of copper species such as Cu0 and Cu+ on copper-based catalysts, which are required to explain the high catalytic activity of copper-based catalysts. Hence, it is still highly desirable to develop more effective catalysts and give insight into the catalytic mechanism for EC hydrogenation.

Copper-based catalysts have been extensively used in the hydrogenation of esters due to the merits of the selective hydrogenation of C–O bonds and the lower ability to cleave the C–C bonds, thus resulting in less undesired degradation products.18–21 Moreover, the catalytic activity and properties of copper-based catalysts are significantly influenced by supports. In order to obtain high catalytic activity, a variety of supports have been employed for preparing highly dispersed copper-based catalysts. As is known, mesoporous silicas are extensively utilized as suitable supports for various highly dispersed metal and metal-oxide nanoparticles due to their properties of interesting framework topologies, high surface area, tunable pore size and pore volume, and high thermal stability.22–26 Therefore, it will be helpful and useful to prepare highly dispersed copper-based catalysts using mesoporous silicas as supports. Furthermore, the catalyst activity and properties will be greatly influenced by different mesoporous silica supports, helping to have a better understanding of the key influencing factors for the high catalytic activity of copper-based catalysts in EC hydrogenation.

In the present work, thermodynamic calculation of EC hydrogenation to co-produce EG and methanol was employed for the first time to predict the reaction spontaneity as a function of temperature. The influences of three ordered mesoporous silicas including KIT-6, MCM-41 and SBA-15 as the supports for copper-based catalysts were investigated on the hydrogenation of EC to synthesize EG and methanol. Three different catalysts Cu/KIT-6, Cu/MCM-41 and Cu/SBA-15 were prepared by facile ammonia evaporation method, keeping the same theoretical copper loading of 10 wt%. To our best knowledge, such support influence investigation using facile ammonia evaporation method has not yet been reported for EC hydrogenation in literatures. The catalyst properties were systematically characterized by different techniques such as N2 physisorption, ICP-AES, N2O titration, FT-IR, XRD, H2-TPR, TEM, XPS and XAES. The catalytic performances of catalysts, effects of reaction conditions and catalyst reusability were studied. Moreover, the correlation between the catalytic activities of catalysts and the Cu0 and Cu+ sites was also investigated to disclose the roles of different copper species.

2. Experimental

2.1 Materials

Ethylene carbonate (EC, 99%) was purchased from Alfa Aesar. Tetrahydrofuran (THF, 99.8%), p-xylene (98.85%) and Cu(NO3)2·3H2O (>99%) were purchased from Sinopharm Chemical Reagent Co., Ltd., China. Ammonia (25 wt%) was purchased from Xilong Chemical Co., Ltd., China. Hydrogen (99.999%) was purchased from Beijing Haikeyuanchang Practical Gas Co., Ltd., China. SBA-15 and MCM-41 were commercially available from Nanjing Xianfeng Nano Co., Ltd., China. KIT-6 was prepared according to the method reported by Kleitz et al.23 Other reagents were of analytical grade and used as received.

2.2 Thermodynamic evaluation

Calculation of thermodynamic evaluation for the processes associated with EC hydrogenation was carried out according to density-functional theory (DFT) implemented with 6-31G(d,p) Gaussian type basis set.27

2.3 Catalyst preparation

Copper-based catalysts using different mesoporous silicas including KIT-6, MCM-41 and SBA-15 as supports were prepared by facile ammonia evaporation method, briefly described as follows. First, the desired amount of Cu(NO3)2·3H2O was dissolved in distilled water. Then, the required amount of 25 wt% ammonia aqueous solution was added into the above copper nitrate solution and vigorously stirred for 10 min. Subsequently, 10.0 g mesoporous silica support was added into the above copper ammonia complex solution under vigorous stirring. After the initial pH was adjusted to 11–12 by ammonia, the resulting suspension was continuously stirred for 4 h. All the above operations were performed at ambient temperature. After that, the suspension was transferred into an oil bath to evaporate ammonia and finally to deposit copper species on the support at 353 K until the pH of the suspension decreased to 6–7. The resulting solid was filtered, washed with deionized water and ethanol, dried in a vacuum oven at 353 K overnight, calcined at 673 K in air atmosphere for 4 h, and finally reduced in 10 vol% H2/N2 at 623 K for 4 h. The theoretical copper loading based on the weight of the total catalyst was set as 10 wt%. Hereinafter, for clarity, the dried precursors were denoted as Cu/KIT-6-D, Cu/MCM-41-D and Cu/SBA-15-D, the calcined samples were denoted as Cu/KIT-6-C, Cu/MCM-41-C and Cu/SBA-15-C, and the finally reduced catalysts were denoted as Cu/KIT-6, Cu/MCM-41 and Cu/SBA-15.

2.4 Catalyst characterization

N2 physisorption measurements were conducted on Quantachrome Autosorb-1 at liquid nitrogen temperature (77 K) after the samples were outgassed at 573 K in vacuum for 3 h to remove physically adsorbed species. The special surface areas (SBET) were calculated by the Brunauer–Emmett–Teller (BET) equation. Total pore volumes (Vpore) were evaluated at relative pressures (P/P0) close to unity. Pore size distributions were estimated by the Barrett, Joyner and Halenda (BJH) method according to the desorption branch of the isotherms.

Copper content of the catalysts was measured with inductively coupled plasma-atomic emission spectroscopy (ICP-AES) on PerkinElmer Optima 5300DV.

Fourier-transform infrared spectra (FT-IR) were recorded on a Bruker Tensor 27 spectrometer at room temperature. For the FT-IR characterizations, the samples were finely ground and dispersed in KBr to make pellets. The spectral resolution was 4 cm−1. All spectra were recorded over 4000–400 cm−1 for 16 scans.

X-ray diffraction (XRD) patterns of the samples were obtained with a PANalytical Empyrean diffractometer using Cu Kα radiation. Small-angle XRD patterns were acquired in the 2θ range of 0.6° to 10°. Wide-angle XRD patterns were recorded in the 2θ range of 10° to 90°.

Temperature-programmed reduction of hydrogen (H2-TPR) studies of the catalysts were performed on a Micromeritics Autochem 2920 instrument. Before tests, about 50 mg catalyst was outgassed under flowing Ar at 473 K for 0.5 h and then cooled to ambient temperature. The reduction was carried out from 323 K to 773 K at a heating rate of 10 K min−1 in 10 vol% H2/Ar (50 mL min−1). The amount of hydrogen consumption was determined using a thermal conductivity detector (TCD).

N2O titration was performed on Micromeritics Autochem 2920 with a TCD to determine the Cu dispersion and the metallic Cu specific surface area of catalysts. About 100 mg catalyst was first outgassed at 473 K under He for 1 h. After cooling to ambient temperature under He, the gas was switched to the 10 vol% H2/Ar mixture stream (30 mL min−1). Then, the sample was heated to 623 K at a ramping rate of 10 K min−1 and retained 623 K for 2 h. The reduced sample was cooled to 363 K and isothermally purged with He for 1 h, and then exposed to pure N2O (30 mL min−1) for 1 h to ensure complete oxidation of naked metallic copper. The sample was then flushed with He to remove N2O and cooled to room temperature. Finally, the gas was switched to the 10 vol% H2/Ar mixture stream (30 mL min−1) and the sample was heated to 623 K at a ramping rate of 10 K min−1. The amount of consumed H2 during the reduction steps was monitored by TCD. The Cu dispersion (DCu) and the metallic Cu specific surface area (SCu) were calculated by the equations described by Liu et al.16

Transmission electron microscopy (TEM) and high resolution transmission electron microscopy (HRTEM) images were obtained by field-emission transmission electron microscopy (JEOL, JEM-2100F) operating at 200 kV. The samples were dispersed in ethanol. Drops of the suspension were deposited on copper grids coated with transparent carbon foil and dried prior to measurement.

Surface chemistry of samples was examined by X-ray photoelectron spectroscopy (XPS) and X-ray Auger electron spectroscopy (XAES) analyses. XPS and XAES were performed under an ultrahigh vacuum using an ESCALAB 250Xi spectrometer with Al Kα radiation (1486.6 eV) and a multichannel detector. The collected binding energies were calibrated using the C 1s peak at 284.6 eV as the reference. The experimental error was within ±0.2 eV.

2.5 Catalytic performance

Hydrogenation of ethylene carbonate (EC) was carried out in a 50 mL stainless steel autoclave. In a typical run, the autoclave was charged with 10 mmol EC, 0.176 g catalyst and 20 mL THF. p-Xylene (100 μL) was also added to the reaction mixture as the internal standard. After being sealed and flushed with H2 five times, the autoclave was pressurized with H2 to 5.0 MPa at room temperature, and then heated up to 453 K for 4 h under vigorous magnetic agitation. After the hydrogenation reaction was finished, the autoclave was cooled in an ice-water bath. The residual H2 was released carefully in a hood. The reaction mixture with p-xylene as the internal standard was analyzed by gas chromatography (Shimadzu GC-2014) with a GsBP-1 column (30 m × 0.32 mm × 1.0 μm) and a flame ionization detector (FID). The injection and detector temperature were 523 K and 553 K, respectively. The temperature program for GC analysis was first held at 313 K for 5 min, then from 313 K to 503 K at a rate of 15 K min−1, and finally held at 503 K for 4 min. Relative standard deviation (RSD) for GC analysis in the measurement was less than 0.2%.

3. Results and discussion

3.1 Thermodynamic evaluation

Up to now, no open literature have been reported on thermodynamic of EC hydrogenation to co-produce EG and methanol. Therefore, the thermodynamic data of EC hydrogenation (reaction (3) in Scheme 2) were calculated by DFT for the first time. In addition, thermodynamic data of other related reactions (shown in Schemes 1–3) were also computed, in order to have a clear picture on EC hydrogenation. The results for thermodynamic calculation were summarized in Table 1. As can be seen, methanol synthesis via direct hydrogenation of CO2 (reaction (1)) is a moderately exothermic reaction (ΔrHθm = −46.98 kJ mol−1) and thermodynamically unfavorable (ΔrGθm = 6.01 kJ mol−1). In contrast, indirect hydrogenation of CO2 via EC intermediate to co-produce methanol and EG (reaction (4)) was exothermic (ΔrHθm = −131.9 kJ mol−1) and thermodynamically favorable (ΔrGθm = −36.32 kJ mol−1). Hence, it is easier to synthesize methanol and EG by indirect hydrogenation of CO2 via EC intermediate. It should be noting that EC hydrogenation is also exothermic (ΔrHθm = −71.59 kJ mol−1) and thermodynamically favorable (ΔrGθm = −25.62 kJ mol−1). Furthermore, EC hydrogenation is more favored at lower temperatures, while higher temperatures will facilitate the deep hydrogenation of EG to ethanol.
image file: c6ra06464g-s1.tif
Scheme 1 The direct hydrogenation of CO2 to produce MeOH.

image file: c6ra06464g-s2.tif
Scheme 2 Reactions involved in the indirect hydrogenation of CO2 via EC intermediate to co-produce MeOH and EG: (2) the cycloaddition reaction of EO and CO2 to produce EC, (3) the hydrogenation of EC to produce MeOH and EG, and (4) the sum of reaction (2) and reaction (3).

image file: c6ra06464g-s3.tif
Scheme 3 The deep hydrogenation of EG to form ethanol.
Table 1 Reaction enthalpy and Gibbs free energy for EC hydrogenation and other related reactions at different temperatures
Reaction ΔrH (kJ mol−1) ΔrG (kJ mol−1)
298 K 413 K 433 K 453 K 473 K 493 K 298 K 413 K 433 K 453 K 473 K 493 K
1 −46.98 −51.97 −52.77 −53.54 −54.28 −55.00 6.01 27.34 31.20 35.10 39.02 42.98
2 −60.31 −60.77 −60.79 −60.80 −60.80 −60.78 −10.70 8.56 11.92 15.28 18.63 21.99
3 −71.59 −75.87 −76.57 −77.23 −77.87 −78.51 −25.62 −7.13 −3.78 −0.41 3.00 6.43
4 −131.9 −136.6 −137.3 −138.0 −138.7 −139.3 −36.32 1.43 8.14 14.87 21.63 28.43
5 −94.81 −96.22 −96.49 −96.75 −97.02 −97.30 −105.1 −108.8 −109.4 −110.0 −110.6 −111.2


3.2 Characterization of catalysts

Pore structures of mesoporous silicas and the three copper-based catalysts were analyzed by N2 physisorption. The corresponding isotherms and pore size distribution curves were shown in Fig. 1, and the derived pore structure parameters were listed in Table 2. As shown in Fig. 1A, N2 physisorption isotherms for KIT-6, MCM-41 and SBA-15 supports distinctly exhibited typical type IV isotherms (IUPAC classification).23,24,28 In addition, KIT-6 presented a sharp capillary condensation at a relative pressure of 0.60–0.80 and an H1 type hysteresis loop, indicating that KIT-6 possessed large channel-like pores with a narrow pore size distribution.23 As shown in Table 2, a narrow pore size distribution with mean value of 5.88 nm was determined for KIT-6. SBA-15 displayed a sharp capillary condensation at a relative pressure of ∼0.65–0.80 and an H1 type hysteresis loop, suggesting that SBA-15 had a uniform mesoporous structure with a narrow pore size distribution. It could be seen in Table 2 that SBA-15 had an average pore size of 7.53 nm. Compared with KIT-6 and SBA-15, MCM-41 presented a capillary condensation in a wider P/P0 range of 0.30–0.95 and a smaller H1 type hysteresis loop, indicating that MCM-41 possessed smaller pores with a more narrow pore size distribution. As exhibited in Table 2, MCM-41 possessed the smallest average pore size of 3.79 nm. Based on the above analysis results, KIT-6, MCM-41 and SBA-15 supports employed in this work possessed obvious mesoporous structure. The total pore volumes of KIT-6, MCM-41 and SBA-15 supports were distributed in a very narrow range of 1.10–1.21 cm3 g−1. However, there were great differences in BET surface areas and average pore sizes for KIT-6, MCM-41 and SBA-15 supports. Specifically, the BET surface area followed the order of MCM-41 > KIT-6 > SBA-15, while the average pore size followed the order of SBA-15 > KIT-6 > MCM-41.
image file: c6ra06464g-f1.tif
Fig. 1 N2 physisorption isotherms (A) and pore distribution curves (B) of mesoporous silicas and the corresponding copper-based catalysts.
Table 2 Textural and structural properties of mesoporous silicas supports and copper-based catalysts
Sample Cu loadinga (%) SBETb (m2 g−1) Vporeb (cm3 g−1) Dporeb (nm) DCuc (%) SCuc (m2 g−1)
a Cu loading determined by ICP-AES.b Pore properties calculated from N2 physisorption.c Cu dispersion (DCu) and Cu0 surface area (SCu) obtained from N2O titration.
KIT-6 820 1.21 5.88
MCM-41 1163 1.10 3.79
SBA-15 628 1.18 7.53
Cu/KIT-6 10.0 438 1.06 9.69 8.2 53
Cu/MCM-41 9.7 312 0.73 9.41 6.8 44
Cu/SBA-15 10.0 446 1.02 9.13 26.2 170


After loading copper onto the three mesoporous silicas supports, the corresponding copper-based catalysts Cu/KIT-6, Cu/MCM-41 and Cu/SBA-15 still possessed typical type IV isotherms with H1 type hysteresis loops due to capillary condensation (Fig. 1A), characteristic of mesoporous materials. Upon loading copper onto SBA-15, the resulted Cu/SBA-15 exhibited a sharp capillary condensation in a slightly wider P/P0 range of ∼0.60–0.85 with an H1 type hysteresis loop similar to SBA-15, resulting in a slight increase on the average pore diameter of Cu/SBA-15 to 9.13 nm. Upon loading copper onto KIT-6 and MCM-41, the resulted Cu/KIT-6 and Cu/MCM-41 exhibited H1 type hysteresis loops which were greatly different from those of their supports. In contrast to KIT-6, Cu/KIT-6 clearly showed a much wider H1 type hysteresis loop with a capillary condensation at a relative pressure of 0.60–0.95, demonstrating that Cu/KIT-6 possessed wider pore size distribution. As shown in Table 2, the average pore diameter of Cu/KIT-6 was increased to 9.69 nm. Compared with MCM-41, Cu/MCM-41 displayed a more evident H1 type hysteresis loop with a capillary condensation at a relative pressure of 0.45–0.95. As for Cu/MCM-41, almost all the mesopores at ∼2.7 nm disappeared and a large number of mesopores at a wide range of ca. 6.5–12.3 nm emerged upon loading copper onto MCM-41 (Fig. 1B), indicating that agglomerated copper particles filled up the mesopore of ∼2.7 nm in MCM-41. Therefore, the average pore diameter of Cu/MCM-41 was greatly increased to 9.41 nm. The total pore volumes of Cu/KIT-6 and Cu/SBA-15 were slightly decreased to 1.06 cm3 g−1 and 1.02 cm3 g−1, respectively, while that of Cu/MCM-41 was remarkably decreased to 0.73 cm3 g−1. Notably, the BET surface area of Cu/KIT-6, Cu/MCM-41 and Cu/SBA-15 was 438 m2 g−1, 312 m2 g−1 and 446 m2 g−1, respectively, which showed a dramatic decrease compared with pure supports. It was worth noting that after loading copper, the decreasing degrees on BET surface areas of the three supports were very different, e.g., the decreasing degree for MCM-41 and KIT-6 was about 73% and 47%, respectively, while that for SBA-15 was only about 29%. Based on the remarkable decrease on total pore volume and the great increase on average pore diameter in Cu/MCM-41 in comparison with MCM-41, it could be deduced that copper particles blocked a large number of smaller mesopores, resulting in the drastic decrease on BET surface area of Cu/MCM-41. Cu/KIT-6 and Cu/SBA-15 possessed larger BET surface areas than Cu/MCM-41, mainly attributing to the less amount of smaller mesopores blocked by copper particles over Cu/KIT-6 and Cu/SBA-15. The Cu loadings, Cu dispersion and metallic Cu surface areas of the three copper-based catalysts were also summarized in Table 2. The actual Cu loadings of the three catalysts were nearly equal, but the metallic Cu surface areas of the three catalysts were very different. The metallic Cu surface area clearly followed the order of Cu/SBA-15 > Cu/KIT-6 > Cu/MCM-41. Specifically, the metallic Cu surface area of Cu/SBA-15 was 170 m2 g−1 with high Cu dispersion of 26.2%, while Cu/KIT-6 and Cu/MCM-41 possessed metallic Cu surface areas of 53 m2 g−1 and 44 m2 g−1, respectively.

FT-IR characterization was used to investigate the evolution of copper species. The FT-IR spectra of the three mesoporous silica supports, dried precursors, calcined samples and reduced copper-based catalysts were depicted in Fig. 2. The intensive absorption band at 1080 cm−1 and a large shoulder peak at 1250 cm−1 were presented in all samples, which aroused from asymmetric stretching vibrations of Si–O–Si bonds.28 Besides, similar phenomena were also observed in all samples for symmetric stretching vibration at 800 cm−1 and bending mode at 457 cm−1 of Si–O–Si bonds.28 In all the dried precursors (Fig. 2A), the presence of the characteristic δOH band at 670 cm−1 for copper phyllosilicate28 confirmed that copper phyllosilicate was produced by ammonia evaporation method in Cu/KIT-6-D, Cu/MCM-41-D and Cu/SBA-15-D precursors. In addition, the absence of representative bands of the δOH at 938 cm−1 and 694 cm−1 for copper hydroxide evidenced that copper hydroxide was not formed in the three dried precursors. The weaker δOH band at 670 cm−1 for copper phyllosilicate was also observed in calcined samples (Fig. 2B). Copper phyllosilicate could be partially decomposed to CuO when calcined at 723 K.29 Therefore, apart from copper phyllosilicate, CuO should also exist on the calcined samples, since the calcination temperature of 673 K applied in this work could only enable partial copper phyllosilicate to decompose to CuO. The characteristic bands of CuO at 575 cm−1, 500 cm−1 and 460 cm−1 were overlapped with the intensive adsorption band of Si–O–Si at 457 cm−1, and just exhibited a shoulder peak at ∼580 cm−1 in the calcined samples. From the above results, it was concluded that copper phyllosilicate existed in the three dried precursors, while copper phyllosilicate and CuO co-existed in the calcined samples. Furthermore, the characteristic δOH band at 670 cm−1 for copper phyllosilicate was absent in the three reduced copper-based catalysts (Fig. 2C), suggesting that copper phyllosilicate was entirely reduced after treatment of reduction.


image file: c6ra06464g-f2.tif
Fig. 2 FT-IR of (A) KIT-6, Cu/KIT-6-D, Cu/KIT-6-C and Cu/KIT-6, (B) MCM-41, Cu/MCM-41-D, Cu/MCM-41-C and Cu/MCM-41, and (C) SBA-15, Cu/SBA-15-D, Cu/SBA-15-C and Cu/SBA-15 samples.

The small-angle XRD patterns of mesoporous silica supports, calcined samples and reduced copper-based catalysts were displayed in Fig. 3. KIT-6 showed an intense diffraction peak at 2θ of 1.1° with two weak diffraction peaks at 2θ of 1.2° and 1.9° indexed to (211), (220) and (420) reflections (Fig. 3A), corresponding to the bi-continuous cubic three-dimensional pore structure of KIT-6.23,30 In comparison with KIT-6, the diffraction peaks at 2θ of 1.1°, 1.2° and 1.9° of Cu/KIT-6-C and Cu/KIT-6 became more intense due to the incorporation of copper species. A strong diffraction peak at 2θ of 2.3° and three weak diffraction peaks at 2θ of 4.0°, 4.6° and 6.0° were observed in MCM-41 (Fig. 3B), corresponding to (100), (110), (200) and (210) crystal planes of MCM-41, indicative of the typical hexagonal structure of MCM-41.31,32 After loading copper onto MCM-41, the intensity of (100) plane of Cu/MCM-41 slightly shifted toward higher angle and nearly disappeared, presumably resulting from the collapse of the structure of MCM-41. As presented in Fig. 3C, a strong diffraction peak at 2θ of 1.0° and two weak diffraction peaks at 2θ of 1.7° and 1.9° were observed in SBA-15, corresponding to the (100), (110) and (200) crystal planes of SBA-15 with two-dimensional of highly ordered mesoporous structure (p6mm).33–35 Compared with SBA-15, all the diffraction peaks of Cu/SBA-15 slightly shifted toward higher angle and became much weaker. It could be deemed that the two-dimensional ordered mesoporous structure of SBA-15 was almost retained after loading copper onto SBA-15.


image file: c6ra06464g-f3.tif
Fig. 3 Small-angle XRD patterns of (A) KIT-6, Cu/KIT-6-C and Cu/KIT-6, (B) MCM-41, Cu/MCM-41-C and Cu/MCM-41, and (C) SBA-15, Cu/SBA-15-C and Cu/SBA-15 samples.

The wide-angle XRD patterns of dried precursors, calcined samples and reduced copper-based catalysts were depicted in Fig. 4. There were no evident diffraction peaks of copper phyllosilicate in the three dried precursors (Fig. 4A). In combination with FT-IR characterization results, it could be considered that copper phyllosilicate was well dispersed on the three supports. As for the calcined samples Cu/KIT-6-C, Cu/MCM-41-C and Cu/SBA-15-C (Fig. 4B), no obvious diffraction peaks corresponding to crystalline CuO clusters or copper phyllosilicate could be detected, suggesting that both CuO and copper phyllosilicate in the calcined samples were highly dispersed on the three supports. After reduction of the calcined samples, great differences were observed in the three reduced copper-based catalysts (Fig. 4C). As for Cu/KIT-6, no metallic Cu or other copper species was obviously observed, indicating that metallic Cu or other copper species were highly dispersed on KIT-6. As for Cu/MCM-41, an obvious diffraction peak appeared at 2θ of around 36.5° indexed to the (111) crystal plane of Cu2O (JCPDS 05-0667). Besides, an evident diffraction peak at 2θ of 43.5° and two weak diffraction peaks at 2θ of 50.7° and 74.1° appeared in Cu/MCM-41, which were assigned to the (111), (220) and (220) crystal planes of fcc Cu (JCPDS 04-0836), suggesting that relatively large Cu2O and metallic Cu particles were dispersed on MCM-41. As for Cu/SBA-15, there was an extremely weak diffraction peak indexed to the (111) crystal plane of Cu2O, characteristic of extremely small Cu2O particles. Besides, no obvious diffraction peaks of metallic Cu were observed in Cu/SBA-15, implying that metallic Cu was highly dispersed on SBA-15.


image file: c6ra06464g-f4.tif
Fig. 4 Wide-angle XRD patterns of (A) dried precursors, (B) calcined samples and (C) reduced copper-based catalysts.

H2-TPR profiles of copper-based catalysts were depicted in Fig. 5. According to the previous work,21 reduction of well-dispersed CuO to Cu0 and reduction of copper phillosilicate to Cu2O occurred at the same temperature of ∼516 K, while the reduction of bulkier CuO particles to Cu0 occurred at a higher temperature of 540 K. Therefore, in combination with FT-IR and XRD results, the single reduction peak at 468 K for Cu/KIT-6 in this work was attributed to the collective contribution of the reduction of copper phillosilicate and well-dispersed CuO particles. As for Cu/MCM-41, the major sharp reduction peak at lower temperature of 466 K was attributed to the collective contribution of the reduction of both copper phillosilicate and well-dispersed CuO particles, while the very wide weak reduction peak at higher temperature of 559 K was ascribed to the reduction of larger CuO particles which was more difficult. As for Cu/SBA-15, the single sharp reduction peak at 467 K was also attributed to the collective contribution of the reduction of copper phillosilicate and well-dispersed CuO particles.


image file: c6ra06464g-f5.tif
Fig. 5 H2-TPR of Cu/KIT-6, Cu/MCM-41 and Cu/SBA-15 catalysts.

image file: c6ra06464g-f6.tif
Fig. 6 TEM of KIT-6, MCM-41 and SBA-15 supports (left) and Cu/KIT-6, Cu/MCM-41 and Cu/SBA-15 catalysts (right).

TEM images of the mesoporous silica supports and copper-based catalysts were exhibited in Fig. 6. Orderly mesoporous channel structure could be clearly seen in KIT-6, MCM-41 and SBA-15 supports. For the three copper-based catalysts Cu/KIT-6, Cu/MCM-41 and Cu/SBA-15, the corresponding lattice fringe spacings of 0.21 nm in HRTEM were clearly observed, which were assigned to the Cu (111) plane, confirming the presence of Cu nanoparticle. The size distribution histograms for the three copper-based catalysts were also obtained by manually measuring the particles from TEM images. As for Cu/KIT-6, copper particles were uniformly distributed on KIT-6 support with the average size of 3.5 nm. As for Cu/SBA-15, copper particles were uniformly distributed on SBA-15 support with the average size of 4.3 nm. Compared with Cu/KIT-6 and Cu/SBA-15, Cu/MCM-41 possessed larger copper particles with the average size of 6.3 nm which were also uniformly distributed on MCM-41. The tendency for the average sizes of copper particles followed the sequence of Cu/MCM-41 > Cu/SBA-15 > Cu/KIT-6, which was in accordance with wide-angle XRD results.

The surface chemical states and surface compositions were analyzed by XPS and XAES. XPS spectra of the calcined samples were shown in Fig. 7. Cu 2p3/2 binding energy of the three calcined samples Cu/KIT-6-C, Cu/MCM-41-C and Cu/SBA-15-C were located within a wide range of 933.7 eV to 936.0 eV, accompanying with 2p → 3d satellite peaks of Cu2+ within the range of 942–945 eV. According to the reported literatures,19,36–38 it was very difficult to distinguish CuO and copper phyllosilicate, because the Cu 2p3/2 binding energy of CuO was located at 933.5 eV, while that of copper phyllosilicate was located at 934.9 eV. In combination with FT-IR, XRD and H2-TPR results, both copper phyllosilicate and CuO co-existed in the form of Cu2+ on the surfaces of the calcined samples. XPS and XAES spectra of the three reduced copper-based catalysts were shown in Fig. 8. After reduction of the three calcined samples Cu/KIT-6-C, Cu/MCM-41-C and Cu/SBA-15-C, the corresponding reduced copper-based catalysts Cu/KIT-6, Cu/MCM-41 and Cu/SBA-15 possessed Cu 2p3/2 binding energy located around 933.2 eV with no satellite peaks of Cu2+ detected at 942–945 eV (Fig. 8A), demonstrating Cu2+ in the calcined samples were completely reduced to Cu0 and/or Cu+. Since the Cu 2p energies of Cu0 and Cu+ were almost identical from XPS spectra, XAES was employed to further distinguish between Cu0 and Cu+ species. As displayed in Fig. 8B, two overlapping Cu LMM Auger kinetic energy peaks at ca. 912 eV and 915 eV were detected in the three copper-based catalysts. The modified Auger parameter and Cu+/(Cu+ + Cu0) molar ratio were listed in Table 3. The Auger parameter value at ca. 1845 eV was attributed to Cu+, while that at ca. 1848 eV was attributed to Cu0, suggesting that Cu0 and Cu+ co-existed on the surfaces of the three copper-based catalysts. In addition, Cu+ was attributed to the reduction of copper phyllosilicate, and Cu0 was ascribed to the reduction of CuO. It was also found that Cu/SBA-15 catalyst possessed a higher Cu+/(Cu+ + Cu0) molar ratio of 0.65, while Cu/KIT-6 and Cu/MCM-41 possessed lower Cu+/(Cu+ + Cu0) molar ratio of 0.56 and 0.57, respectively.


image file: c6ra06464g-f7.tif
Fig. 7 XPS spectra of calcined Cu/KIT-6-C, Cu/MCM-41-C and Cu/SBA-15-C samples.

image file: c6ra06464g-f8.tif
Fig. 8 Cu 2p XPS spectra (A) and Cu LMM XAES spectra (B) of Cu/KIT-6, Cu/MCM-41 and Cu/SBA-15 catalysts.
Table 3 Assignments of copper species in copper-based catalysts derived from Cu LMM XAES spectra
Catalyst Binding energy (eV) Kinetic energy (eV) Auger parametera (eV) Cu+/(Cu+ + Cu0)b (mol ratio)
Cu 2p3/2 Si 2p Cu+ Cu0 Cu+ Cu0
a Obtained by sum of binding energy and kinetic energy.b Calculated from Cu LMM XAES spectra.
Cu/KIT-6 933.5 103.6 911.8 915.0 1845.3 1848.5 0.56
Cu/MCM-41 933.2 103.5 912.1 915.6 1845.3 1848.8 0.57
Cu/SBA-15 933.0 103.5 912.7 915.3 1845.7 1848.3 0.65


3.3 Catalytic performances

The catalytic performances of Cu/KIT-6, Cu/MCM-41 and Cu/SBA-15 employed as heterogeneous catalysts for EC hydrogenation were investigated, and the results were summarized in Table 4. When the reaction was conducted at 453 K for 4 h, the activity for EC hydrogenation clearly followed the sequence of Cu/SBA-15 > Cu/KIT-6 > Cu/MCM-41. It was worth noting that the TON towards EG and MeOH for Cu/SBA-15 were 22.0 and 11.4, respectively. In addition, TON of two reported CuCr2O4 (ref. 8) and Cu–SiO2-PG16 catalysts for EC hydrogenation under the optimized condition in the batch reactor were also calculated for comparison. It was found that compared with the TON towards EG and MeOH for Cu/SBA-15 used in this work, those for the two reported CuCr2O4 (ref. 8) and Cu–SiO2-PG16 catalysts were relatively lower. The TON towards EG and MeOH over CuCr2O4 were 4.1 and 2.7, respectively. As for Cu–SiO2-PG, the TON towards EG and MeOH were 8.8 and 8.7, respectively. The above results indicated that Cu/SBA-15 was a superior catalyst for EC hydrogenation. When further increasing the reaction temperature from 453 K to 473 K, EC was completely converted over Cu/SBA-15, while EC conversion over Cu/KIT-6 and Cu/MCM-41 were 81.6% and 65.0%, respectively. Moreover, the selectivities of EG and MeOH achieved over the three catalysts followed the order of Cu/SBA-15 > Cu/KIT-6 > Cu/MCM-41. Especially, the EG selectivity and MeOH selectivity achieved over Cu/MCM-41 were respectively less than 60% and 25%, while those over Cu/SBA-15 and Cu/KIT-6 were more than 90% and 48%. Therefore, SBA-15 is a better support for obtaining higher activity and selectivity of copper-based catalysts than the other two mesoporous KIT-6 and MCM-41 supports. Notably, the sequence for catalytic performances of the three catalysts accorded with the metallic Cu surface area of catalysts. Additionally, Cu+/(Cu+ + Cu0) molar ratio of Cu/KIT-6 and Cu/MCM-41 was almost identical (Table 3), but the TON towards EG and MeOH for Cu/KIT-6 which possessed larger metallic Cu surface area were higher than that of Cu/MCM-41. Therefore, Cu0 was considered to be the active site for the activity of catalysts. On the other hand, the metallic Cu surface area of Cu/SBA-15 was more than three times higher than that of Cu/KIT-6 and Cu/MCM-41, but the TON towards EG and MeOH for Cu/SBA-15 were less than three times of that of Cu/KIT-6 and Cu/MCM-41, implying that Cu+ also had great impact on EC hydrogenation. As shown in Table 3, Cu/SBA-15 possessed higher Cu+/(Cu+ + Cu0) molar ratio of 0.65, which could facilitate the faster conversion of intermediates during the process of EC hydrogenation. In order to have a deeper insight into the relation between the catalytic activity and the total amount of Cu0 and Cu+ species on the catalyst surface, the total amount of Cu0 and Cu+ species on the catalyst surface was also calculated. As shown in Table 4, the total amount of Cu0 species on the surface of Cu/SBA-15, Cu/KIT-6 and Cu/MCM-41 were 73, 23 and 18 μmol, respectively. The total amount of Cu+ species on the surface of Cu/SBA-15, Cu/KIT-6 and Cu/MCM-41 were 136, 29 and 24 μmol, respectively. As could be seen, the total amount of Cu0 and Cu+ species on the catalyst surface followed the order of Cu/SBA-15 > Cu/KIT-6 > Cu/MCM-41. It should be noted that the total amount of Cu0 species and Cu+ species on the surface of Cu/KIT-6 was 1.3 times and 1.2 times higher than that of Cu/MCM-41, respectively, but the TON towards EG and MeOH over Cu/KIT-6 were 1.7 times and 3.0 times higher than those over Cu/MCM-41, suggesting that the synergetic effect of Cu0 and Cu+ species had influenced the catalytic performances. It was suggested that in methyl acetate hydrogenation, Cu0 species activated H2 and Cu+ species adsorbed the carbonyl group.39 Cu+ could act as the stabilizer of the methoxy and acyl species. Besides, Cu+ could also function as electrophilic or Lewis acidic sites to polarize the C[double bond, length as m-dash]O bond via the electron lone pair in oxygen, thus improving the reactivity of the ester group.39 Therefore, based on the above results, the synergetic effect between Cu0 and Cu+ species was responsible for the higher activity of Cu/SBA-15. Moreover, the different roles that Cu0 species dissociated H2 and Cu+ species absorbed the carbonyl group of EC could be proposed in EC hydrogenation over Cu/SBA-15 catalyst.
Table 4 Catalytic performances of copper-based catalysts Cu/KIT-6, Cu/MCM-41 and Cu/SBA-15 in EC hydrogenationa
Catalyst Cu loadingb (%) SCuc (m2 g−1) Total amount on the catalyst surfaced (μmol) T (K) EC conv. (%) Yield (%) Sel. (%) TONe (mol mol−1)
Cu0 Cu+ Cu0 + Cu+ EG MeOH EG MeOH EG MeOH
a Reaction conditions: 10 mmol EC, 5 MPa H2, 20 mL THF, 20 wt% catalyst loading (based on the weight of EC), and 4 h.b Cu loading obtained by ICP-AES.c Cu0 surface area obtained from N2O titration.d Total amount of Cu0 species on the catalyst surface determined from N2O titration, while total amount of Cu+ species on the catalyst surface determined from Cu LMM XAES.e TON calculated from the products generating per total copper amount (mol mol−1).
Cu/KIT-6 10.0 53 23 29 52 453 43.8 39.4 21.1 90.0 48.2 14.2 7.6
473 81.6 75.7 41.1 92.8 50.4
Cu/MCM-41 9.7 44 18 24 42 453 41.4 22.8 7.7 55.1 18.6 8.5 2.5
473 65.0 29.6 15.2 45.5 23.4
Cu/SBA-15 10.0 170 73 136 209 453 62.1 60.9 31.5 98.1 50.7 22.0 11.4
473 100 94.7 62.3 94.7 62.3


3.4 Effects of reaction conditions

The effects of reaction conditions such as reaction temperature and reaction time on the activity and selectivity in EC hydrogenation were further investigated using Cu/SBA-15 as the catalyst, and the results were summarized in Table 5.
Table 5 Effects of reaction conditions on the activity and selectivity over Cu/SBA-15 in EC hydrogenationa
Entry T (K) t (h) EC conv. (%) Yield (%) Sel. (%)
EG MeOH EG MeOH
a Reaction conditions: 10 mmol EC, 5 MPa H2, 20 mL THF, 20 wt% catalyst loading (based on the weight of EC).
1 413 4 16.0 15.2 4.2 95.0 26.3
2 433 4 23.8 23.2 12.9 97.5 54.2
3 453 4 62.1 60.9 31.5 98.1 50.7
4 473 4 100 94.7 62.3 94.7 62.3
5 493 4 100 92.4 46.1 92.4 46.1
6 473 2 57.2 55.4 39.8 96.9 69.6
7 473 3 85.7 80.0 59.9 93.3 69.9
8 473 6 100 94.8 59.8 94.8 59.8


At first, the effect of reaction temperature was investigated in the range of 413–493 K. As expected, the higher reaction temperature accelerated the EC hydrogenation rate. Specifically, when the reaction temperature was increased from 413 K to 473 K (entries 1–4), EC conversion was remarkably enhanced from 16.0% to 100%, while EG yield was greatly improved from 15.2% to 94.7% and MeOH yield was dramatically increased from 4.2% to 62.3%. Further increasing the reaction temperature to 493 K (entry 5), EC was completely converted, EG yield was slightly decreased to 92.4%, and MeOH yield was also decreased to 46.1%, indicating that too high reaction temperature was not favorable to obtain high selectivities of EG and MeOH. Hence, from the viewpoints of activity and selectivity, 473 K was selected as the suitable reaction temperature.

Then, the effect of reaction time was further investigated in the range of 2–6 h at 473 K. When the reaction was conducted at 473 K for 2 h (entry 6), 57.2% of EC conversion with 55.4% of EG yield and 39.8% of MeOH yield was obtained. As the reaction time was prolonged to 3 h (entry 7), EC conversion was increased to 85.7%, while EG yield and MeOH yield were increased to 80.0% and 59.9%, respectively. Furthermore, EC was completely converted with good EG selectivity of 94.7% and MeOH selectivity of 62.3% at a short reaction time of 4 h (entry 4). However, no evident improvement of EG yield and MeOH yield were observed when further increasing reaction time to 6 h (entry 8). Therefore, 4 h was regarded as the proper reaction time.

In a word, among the reaction conditions investigated, 100% of EC conversion, 94.7% of EG yield and 62.3% of MeOH yield were obtained within a short reaction time of 4 h over Cu/SBA-15 catalyst with a low copper loading of 10 wt%.

3.5 Catalyst reusability

The reusability of Cu/SBA-15 catalyst was preliminarily evaluated, and the results were listed in Table 6. The catalyst after the first run was centrifuged, washed with THF, and then directly used in the second run with fresh reactants. In the second run, EC conversion, EG yield and MeOH yield were decreased to 68.8%, 58.0% and 46.5%, respectively (Run 2). In order to eliminate the likely oxidation of the used catalyst due to the inevitable exposure to air during recycling experiments, then the catalyst after the second run was centrifuged, washed with THF, dried in a vacuum oven, reduced in 10 vol% H2/N2 at 623 K for 4 h, and then reused in the third run with fresh reactants. However, continuous decreases with lower EG and MeOH yields were still observed (Run 3). Therefore, XRD and TEM characterization of the catalyst after the third run (Cu/SBA-15-3rd) were used to check the changes of the used catalyst. As depicted in Fig. 9A, the diffraction peak of Cu2O was more intensified for the used Cu/SBA-15-3rd catalyst than the fresh Cu/SBA-15 catalyst, indicating of larger Cu2O particles in the used Cu/SBA-15-3rd catalyst. In addition, compared with the fresh Cu/SBA-15 catalyst (Fig. 6), copper particles of used Cu/SBA-15-3rd catalyst were a bit larger with an average size of 4.5 nm (Fig. 9B). Hence, the agglomeration of Cu and Cu2O nanoparticles were responsible for the decreased catalytic activity of Cu/SBA-15 during recycling experiments. It was reported that the catalytic activity and stability of Cu/SiO2 catalyst could be successfully enhanced after doping with lanthanum oxide,40 boric oxide,41 Ag42 or Au.43 Hence, it is anticipated that the reusability and structure stability of Cu/SBA-15 catalyst can be improved by doping suitable amount of catalyst promoters such as lanthanum oxide, boric oxide, Ag or Au into Cu/SBA-15.
Table 6 Reusability of Cu/SBA-15 in EC hydrogenationa
Run EC conv. (%) Yield (%) Sel. (%)
EG MeOH EG MeOH
a Reaction conditions: 10 mmol EC, 5 MPa H2, 20 mL THF, 20 wt% catalyst loading (based on the weight of EC), 473 K, and 4 h.b Catalyst obtained after the first run and washed with THF.c Catalyst obtained after the second run, washed with THF, dried at 353 K in a vacuum oven, and reduced in 10 vol% H2/N2 at 623 K for 4 h.
1 100.0 94.7 62.3 94.7 62.3
2b 68.8 58.0 46.5 84.3 67.6
3c 32.6 21.2 7.8 65.0 23.9


image file: c6ra06464g-f9.tif
Fig. 9 XRD pattern (A) and TEM image (B) of the fresh and used Cu/SBA-15 catalysts.

4. Conclusions

In summary, thermodynamic data of different reactions associated with EC hydrogenation were detailedly calculated by DFT for the first time. The thermodynamic calculation showed that indirect hydrogenation of CO2 via EC intermediate is more thermodynamically favored than direct hydrogenation of CO2. In addition, ΔrHθm and ΔrGθm of EC hydrogenation are −71.59 kJ mol−1 and −25.62 kJ mol−1, respectively. Three copper-based catalysts Cu/SBA-15, Cu/KIT-6 and Cu/MCM-41 were successfully prepared by facile ammonia evaporation method using ordered mesoporous SBA-15, KIT-6 and MCM-41 as supports. The as-prepared catalysts were utilized as heterogeneous catalysts for EC hydrogenation to co-produce EG and MeOH. The properties of the three copper-based catalysts were characterized by various techniques and were significantly influenced by supports. Catalyst characterization revealed that the ordered structures of Cu/SBA-15 and Cu/KIT-6 catalysts were retained, while that of Cu/MCM-41 was destroyed. Compared with Cu/SBA-15 and Cu/KIT-6 catalysts which had average Cu particle sizes of 4.3 nm and 3.5 nm, respectively, Cu/MCM-41 possessed a relatively larger average Cu particle size of 6.3 nm. Additionally, different ratio of Cu0 and Cu+ species co-existed in the three copper-based catalysts after reduction, which were verified to derive from CuO and copper phyllosilicate, respectively. The catalytic performances showed that the activity for EC hydrogenation followed the sequence of Cu/SBA-15 > Cu/KIT-6 > Cu/MCM-41. The synergetic effect of Cu0 and Cu+ species with appropriate ratio were responsible for the higher catalytic activity of Cu/SBA-15. It was proposed that Cu0 species dissociated H2, while Cu+ species absorbed the carbonyl group of EC. Furthermore, among the three copper-based catalysts, Cu/SBA-15 exhibited a better activity with TON of 22.0 and 11.4 (mol mol−1) towards EG and MeOH, respectively. Under a suitable condition, 100% of EC conversion, 94.7% of EG yield and 62.3% of MeOH yield were achieved within a short reaction time of 4 h. This work provides an inexpensive and efficient copper-based catalyst for sustainable synthesis of ethylene glycol and methanol via indirect chemical utilization of CO2.

Acknowledgements

The authors gratefully acknowledge financial supports from National Natural Science Foundation of China (No. 21576272 and 21406245) and National Key Technology R&D Program (No. 2013BAC11B03).

Notes and references

  1. T. Sakakura, J.-C. Choi and H. Yasuda, Chem. Rev., 2007, 107, 2365–2387 CrossRef CAS PubMed.
  2. Z. Jiang, T. Xiao, V. L. Kuznetsov and P. P. Edwards, Philos. Trans. R. Soc., A, 2010, 368, 3343–3364 CrossRef CAS PubMed.
  3. M. Peters, B. Köhler, W. Kuckshinrichs, W. Leitner, P. Markewitz and T. E. Müller, ChemSusChem, 2011, 4, 1216–1240 CrossRef CAS PubMed.
  4. J. Ma, N. Sun, X. Zhang, N. Zhao, F. Xiao, W. Wei and Y. Sun, Catal. Today, 2009, 148, 221–231 CrossRef CAS.
  5. C. Ampelli, S. Perathoner and G. Centi, Philos. Trans. R. Soc., A, 2015, 373, 20140177 CrossRef PubMed.
  6. G. A. Olah, Angew. Chem., Int. Ed., 2005, 44, 2636–2639 CrossRef CAS PubMed.
  7. D. R. Palo, R. A. Dagle and J. D. Holladay, Chem. Rev., 2007, 107, 3992–4021 CrossRef CAS PubMed.
  8. C. Lian, F. Ren, Y. Liu, G. Zhao, Y. Ji, H. Rong, W. Jia, L. Ma, H. Lu, D. Wang and Y. Li, Chem. Commun., 2015, 51, 1252–1254 RSC.
  9. X. Zhao, M. Yin, L. Ma, L. Liang, C. Liu, J. Liao, T. Lu and W. Xing, Energy Environ. Sci., 2011, 4, 2736–2753 CAS.
  10. J. Lefevere, S. Mullens, V. Meynen and J. Van Noyen, Chem. Pap., 2014, 68, 1143–1153 CAS.
  11. L. Zhang, Z.-X. Jiang, Y. Yu, C.-S. Sun, Y.-J. Wang and H.-Y. Wang, RSC Adv., 2015, 5, 55825–55831 RSC.
  12. E. BuBalaraman, C. Gunanathan, J. Zhang, L. J. W. Shimon and D. Milstein, Nat. Chem., 2011, 3, 609–614 CrossRef PubMed.
  13. M. Tamura, T. Kitanaka, Y. Nakagawa and K. Tomishige, ACS Catal., 2016, 6, 376–380 CrossRef CAS.
  14. X. Z. Yang, ACS Catal., 2012, 2, 964–970 CrossRef CAS.
  15. Z. Han, L. Rong, J. Wu, L. Zhang, Z. Wang and K. Ding, Angew. Chem., Int. Ed., 2012, 51, 13041–13045 CrossRef CAS PubMed.
  16. H. Liu, Z. Huang, Z. Han, K. Ding, H. Liu, C. Xia and J. Chen, Green Chem., 2015, 17, 4281–4290 RSC.
  17. X. Chen, Y. Cui, C. Wen, B. Wang and W.-L. Dai, Chem. Commun., 2015, 51, 13776–13778 RSC.
  18. Y. Wang, Y. Shen, Y. Zhao, J. Lv, S. Wang and X. Ma, ACS Catal., 2015, 5, 6200–6208 CrossRef CAS.
  19. S. Zhu, X. Gao, Y. Zhu, W. Fan, J. Wang and Y. Li, Catal. Sci. Technol., 2015, 5, 1169–1180 CAS.
  20. Z.-Q. Wang, Z.-N. Xu, S.-Y. Peng, M.-J. Zhang, G. Lu, Q.-S. Chen, Y. Chen and G.-C. Guo, ACS Catal., 2015, 5, 4255–4259 CrossRef CAS.
  21. L.-F. Chen, P.-J. Guo, M.-H. Qiao, S.-R. Yan, H.-X. Li, W. Shen, H.-L. Xu and K.-N. Fan, J. Catal., 2008, 257, 172–180 CrossRef CAS.
  22. K. Flodström, V. Alfredsson and N. Källrot, J. Am. Chem. Soc., 2003, 125, 4402–4403 CrossRef PubMed.
  23. F. Kleitz, S. Hei Choi and R. Ryoo, Chem. Commun., 2003, 2136–2137 RSC.
  24. D. Zhao, J. Feng, Q. Huo, N. Melosh, G. H. Fredrickson, B. F. Chmelka and G. D. Stucky, Science, 1998, 279, 548–552 CrossRef CAS PubMed.
  25. M. Choi, W. Heo, F. Kleitz and R. Ryoo, Chem. Commun., 2003, 1340–1341 RSC.
  26. L.-F. Chen, P.-J. Guo, L.-J. Zhu, M.-H. Qiao, W. Shen, H.-L. Xu and K.-N. Fan, Appl. Catal., A, 2009, 356, 129–136 CrossRef CAS.
  27. J. W. Ochterski, Thermochemistry in Gaussian, 2000, pp. 1–19 Search PubMed.
  28. X. Ma, H. Chi, H. Yue, Y. Zhao, Y. Xu, J. Lv, S. Wang and J. Gong, AIChE J., 2013, 59, 2530–2539 CrossRef CAS.
  29. T. Toupance, M. Kermarec and C. Louis, J. Phys. Chem. B, 2000, 104, 965–972 CrossRef CAS.
  30. H. Tüysüz, C. W. Lehmann, H. Bongard, B. Tesche, R. Schmidt and F. Schüth, J. Am. Chem. Soc., 2008, 130, 11510–11517 CrossRef PubMed.
  31. J. S. Beck, J. C. Vartuli, W. J. Roth, M. E. Leonowicz, C. T. Kresge, K. D. Schmitt, C. T. W. Chu, D. H. Olson and E. W. Sheppard, J. Am. Chem. Soc., 1992, 114, 10834–10843 CrossRef CAS.
  32. Q. Zhang, W. Yang, X. Wang, Y. Wang, T. Shishido and K. Takehira, Microporous Mesoporous Mater., 2005, 77, 223–234 CrossRef CAS.
  33. D. Zhao, Q. Huo, J. Feng, B. F. Chmelka and G. D. Stucky, J. Am. Chem. Soc., 1998, 120, 6024–6036 CrossRef CAS.
  34. B. L. Newalkar, S. Komarneni and H. Katsuki, Chem. Commun., 2000, 2389–2390 RSC.
  35. D. Zhao, J. Sun, Q. Li and G. D. Stucky, Chem. Mater., 2000, 12, 275–279 CrossRef CAS.
  36. A. Gervasini, M. Manzoli, G. Martra, A. Ponti, N. Ravasio, L. Sordelli and F. Zaccheria, J. Phys. Chem. B, 2006, 110, 7851–7861 CrossRef CAS PubMed.
  37. L.-F. Chen, P.-J. Guo, M.-H. Qiao, S.-R. Yan, H.-X. Li, W. Shen, H.-L. Xu and K.-N. Fan, J. Catal., 2008, 257, 172–180 CrossRef CAS.
  38. J. Gong, H. Yue, Y. Zhao, S. Zhao, L. Zhao, J. Lv, S. Wang and X. Ma, J. Am. Chem. Soc., 2012, 134, 13922–13925 CrossRef CAS PubMed.
  39. E. Poels and D. Brands, Appl. Catal., A, 2000, 191, 83–96 CrossRef CAS.
  40. X. Zheng, H. Lin, J. Zheng, X. Duan and Y. Yuan, ACS Catal., 2013, 3, 2738–2749 CrossRef CAS.
  41. Z. He, H. Lin, P. He and Y. Yuan, J. Catal., 2011, 277, 54–63 CrossRef CAS.
  42. Y. Huang, H. Ariga, X. Zheng, X. Duan, S. Takakusagi, K. Asakura and Y. Yuan, J. Catal., 2013, 307, 74–83 CrossRef CAS.
  43. Y.-N. Wang, X. Duan, J. Zheng, H. Lin, Y. Yuan, H. Ariga, S. Takakusagi and K. Asakura, Catal. Sci. Technol., 2012, 2, 1637–1639 CAS.

This journal is © The Royal Society of Chemistry 2016