LEIS study of the protection of zinc phosphate/epoxy coatings under cathodic protection
Xiaoling Liu*a,
Yawei Shaob,
Mingshun Liuc,
Shougang Chena,
Fuhui Wangb and
Longqiang Wanga
aInstitute of Materials Science and Engineering, Ocean University of China, Qingdao 266100, PR China. E-mail: L05102129@163.com; Fax: +86-0532-66781688; Tel: +86-0532-66781688
bCorrosion and Protection Laboratory, Harbin Engineering University, Harbin 150001, PR China
cChina University of Mining & Technology, Beijing 100083, PR China
First published on 27th April 2016
Abstract
The anti-corrosion properties of the defective zinc phosphate/epoxy coatings under cathodic protection (CP) in a 3.5% NaCl solution were evaluated by localized electrochemical impedance spectroscopy (LEIS), scanning electrochemical microscopy and X-ray diffraction. The results revealed that the application of CP inhibited the formation of the phosphate film, compared with exposure at open circuit potential (OCP). Moreover, a CP/OCP cycle was beneficial to form a phosphate film on the defective coatings, particularly under a −0.65 V/OCP cycle. The mechanism of zinc phosphate modifying the corrosion process of the defective coatings under different cathodic potentials was also considered.
1. Introduction
Zinc phosphate is commonly used as a green pigment in non-toxic pigments for anticorrosive paints.1–5 There are many theories about the role of zinc phosphate in the corrosion processes of coatings in the literature. Several researchers believed that zinc phosphate was able to compound with the carboxyl and hydroxyl groups of the binder in the corrosion environment.6–10 Rossenbeck revealed that zinc phosphate formed Zn hydroxides and a phosphate film with Fe ions absorbed on the iron surface that can alleviate the cathodic disbondment process at the interface.11,12 Shao found that epoxy coatings containing zinc phosphate had a remarkable healing function on a steel surface.13 Hao's study indicated that the presence of zinc phosphate could form an inhibiting film that was composed of the phosphate film while also providing a shielding film of zinc phosphate on the steel surface.14 Some other authors believe that the addition of zinc phosphate to paints improves their barrier function.15,16The use of protective organic coatings is often associated with the application of cathodic protection (CP) to inhibit the corrosion of metallic components. When organic coatings are employed in immersed conditions, moisture may penetrate into the coating, decreasing the coating's electrical resistance, and corrosive species such as Cl− and O2 may diffuse through coating defects, such as pinholes and gaps, to reach the substrate surface, which can result in corrosion of the steel substrate beneath the coating.17 The imposed cathodic protection is supposed to prevent corrosion of steel under the coating. However, excessive cathodic protection can induce a marked alkalinization at the substrate-coating interface and lead to cathodic disbonding of the coating. Touzain et al. and Thu et al. reported that the degradation of coatings was faster when the cathodic protection was more negative (−1.5 V/SCE).18,19 Thus, the question is when cathodic protection is imposed on coatings containing zinc phosphate within an appropriate range, how does zinc phosphate influence corrosion of the metal beneath the coating and can the phosphate film still form on the surface of the metal? Therefore, it is useful to clarify the influence of zinc phosphate while different levels of cathodic protection within an appropriate range are imposed on the zinc phosphate/epoxy coating.
Local electrochemical processes always occur at micro-defects such as pinholes but analysis of EIS data only gives the average response from the whole surface. Localized electrochemical impedance spectroscopy (LEIS) measurements can monitor the average response of the defect areas and perhaps gain some useful information on the defective areas.20–28 Mouanga et al. investigated the corrosion behavior of a defective zinc–nickel + chromate conversion coating on carbon steel, which demonstrated that local impedance measurement was very useful to characterize in situ the electrochemical reactivity at the defect.29 Zhong et al. used LEIS to study the influence of defect size on the corrosion mechanism in a composite epoxy coating.30 Zhang et al. investigated the corrosion protective property of defective hydrofluoric acid-doped polyaniline/epoxy (PANI-HF/EP) coatings using LEIS.31 Dong's group applied LEIS to study the corrosion reactions of steel under a high performance composite coating (HPCC) with defects under cathodic protection and considered that the corrosion of the steel depended on the cathodic protection potential and the defect geometry.17 Nevertheless, there are very few investigations to characterize the anti-corrosion properties of the defective zinc phosphate/epoxy coatings under cathodic protection, particularly using LEIS.
In the present study, the role of zinc phosphate pigments in defective epoxy coatings at different cathodic potentials was studied by means of LEIS.
2. Experimental
2.1 Electrodes and solutions
Carbon steel panels (≤0.18% C; ≤0.050% S; ≤0.045% P in mass%) were used as the substrates and were ground to 800-grit finish, degreased in acetone and dried in air.Zinc phosphate was obtained from Sinopharm Chemical Reagent Co. Ltd. (Shanghai, China). The main composition of zinc phosphate discussed in this study was Zn3(PO4)2·4H2O in the shape of rhombic prisms with a grain size of about 5.2 μm. The epoxy resin (E-44) and curing agent polyamide (PA) were purchased from Phoenix Resins Inc. (Wu xi, China). In this research, only zinc phosphate was used to make a single component pigmented coating. Epoxy resin was dissolved using a dimethylbenzene and n-butyl alcohol mixed solution in a mass ratio of 2![[thin space (1/6-em)]](https://www.rsc.org/images/entities/char_2009.gif) :
:![[thin space (1/6-em)]](https://www.rsc.org/images/entities/char_2009.gif) 1. Zinc phosphate with the concentration 10 mass% was added subsequently, as it provided better protection than other concentrations in preliminary experiments. All the compositions were added into an agate jar, according to the required proportions, then the mixture was dispersed using a ball milling machine for 2 h, to obtain the paint mixture. The polyamide curing agent was added to the paint matrix with a mass that was half of the epoxy resin weight and then the mixture was applied on the ground carbon steel panels. Coatings were cured at 30 °C for 24 h and then cured at 60 °C for 24 h. The thickness of the dry coating was 120 ± 10 μm. An artificial pinhole of 200 μm in diameter was generated in the center of the coating (Fig. 1), by stabbing a needle tip to simulate a micro-defect.
1. Zinc phosphate with the concentration 10 mass% was added subsequently, as it provided better protection than other concentrations in preliminary experiments. All the compositions were added into an agate jar, according to the required proportions, then the mixture was dispersed using a ball milling machine for 2 h, to obtain the paint mixture. The polyamide curing agent was added to the paint matrix with a mass that was half of the epoxy resin weight and then the mixture was applied on the ground carbon steel panels. Coatings were cured at 30 °C for 24 h and then cured at 60 °C for 24 h. The thickness of the dry coating was 120 ± 10 μm. An artificial pinhole of 200 μm in diameter was generated in the center of the coating (Fig. 1), by stabbing a needle tip to simulate a micro-defect.
The test solution was a 3.5% sodium chloride solution (NaCl). All tests were conducted at room temperature (20 °C) and open to air.
2.2 Cathode potential
Because the protection potential for steel is −0.8 V (SCE), at least for design purposes, −0.8 V (SCE) was chosen as the complete protection potential. The OCP of the damaged zinc phosphate/epoxy coating was approximately −0.5 V (SCE) during the initial immersion stage and thus, a median potential value of −0.65 V (SCE) was chosen as the under-voltage protection potential. The experiments were carried out at the three potentials mentioned above for 12 days. Additional four-step potentiostatic tests were applied: an initial CP potential of −0.65 V (SCE) or −0.8 V (SCE) was imposed for 2 days, then the cathodic potential was interrupted (at the OCP) for 4 days, after that a CP potential of −0.65 V (SCE) or −0.8 V (SCE) was re-imposed for 2 days, and then the CP potential was interrupted again (at the OCP) for 4 days, as shown in Table 1.| Experimental code | OCP | −0.65 V | −0.8 V | −0.65 V/OCP cycle | −0.8 V/OCP cycle |
| Experimental condition | OCP/12 d | −0.65 V/12 d | −0.8 V/12 d | −0.65 V/2 d | −0.8 V/2 d |
| OCP/4 d | OCP/4 d | ||||
| −0.65 V/2 d | −0.8 V/2 d | ||||
| OCP/4 d | OCP/4 d |
2.3 LEIS measurements
LEIS measurements were performed on the working electrode (WE) using a PAR Model 370 Scanning Electrochemical Workstation comprising a 370 scanning control unit controlling the three coordinate positions of the LEIS probe, a M273A potentiostat providing a DC potential and AC excitation signal, a PG580R potentiostat measuring the potential difference ΔVlocal between two microprobes, a M5210 lock-in amplifier as the frequency response analyzer, and a video camera system.The experiment used an LEIS mapping model. The microprobe was stepped over the defect on the electrode surface. Scanning took the form of a raster in the x–y plane, the scanning area was 2000 μm × 1500 μm, and the step size was controlled to obtain a plot of 16 lines × 12 lines. The AC perturbation signal was 20 mV, and the excitation frequency for impedance measurements was fixed at 50 Hz, which was chosen according to the ref. 30 and 31. An Ag/AgCl (saturated KCl) electrode was used as the reference electrode, and a platinum ring fixed around the LEIS probe was the counter electrode.
3. Results
3.1 LEIS mapping under OCP
LEIS maps showing the impedance response at the defect in the zinc phosphate/epoxy coating under OCP after 6 h, 48 h, 144 h, 192 h and 288 h immersion and results are presented in Fig. 2. The impedance value of the defect point was approximately 2 kΩ, which was minimum on the LEIS map during the initial stage of immersion. The impedance values were approximately 10 kΩ at the area around the defect, which was 900 μm from the center of the defect shown in Fig. 2(a). During formation of the phosphate film, the impedance value of the coating at the defect point and adjacent area increased as the immersion time extended. After 288 h immersion, the impedance values at the defect point reached 20 kΩ and the area around the defect reached 24 kΩ (shown in Fig. 2(E) and 3). | ||
| Fig. 2 LEIS maps of the defected coating after (A) 6 h, (B) 48 h, (C) 144 h, (D) 192 h, and (E) 288 h immersion in the solution under OCP. | ||
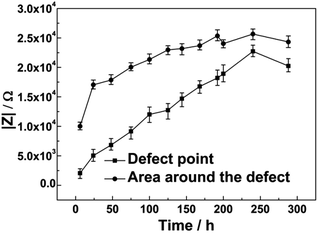 | ||
| Fig. 3 Impedance value measured at the defect point and an area 900 μm away from the center of the defect and its change with immersion time under OCP. | ||
3.2 LEIS mapping under CP
Fig. 4 and 5 show the LEIS maps measured for coatings with artificial defects under cathodic potentials of −0.65 V or −0.8 V after 6 h, 48 h, 144 h, 192 h and 288 h immersion, respectively. Fig. 6 and 7 show the changes of the impedance values of the coatings at the defect point and the area around the defect with immersion time at applied cathodic potentials of −0.65 V or −0.8 V, respectively. From Fig. 6, the impedance values around the defect firstly decreased from approximately 20 kΩ to 15 kΩ after 175 h of immersion, then increased slightly to 20 kΩ at an applied cathodic potential of −0.65 V. The response was similar with the coating applied with a −0.8 V cathodic potential; the impedance values around the defect firstly decreased from about 24 kΩ to 15 kΩ after 125 h of immersion and then increased slightly to 20 kΩ, as shown in Fig. 7. The decreasing cathodic potential caused enhanced alkalinity in the coating defect, which increased the susceptibility of coating adhesion failure. Thus, impedance values obtained at an applied cathodic potential of −0.8 V decreased faster than those obtained at −0.65 V. With increasing immersion time, the accumulation of the corrosion products caused the impedance values at the defect point and the area around it to increase slightly. | ||
| Fig. 4 LEIS maps of the defected coating after (A) 6 h, (B) 48 h, (C) 144 h, (D) 192 h, and (E) 288 h immersion in the solution under −0.65 V cathodic potential. | ||
 | ||
| Fig. 5 LEIS maps of the defected coating after (A) 6 h, (B) 48 h, (C) 144 h, (D) 192 h, and (E) 288 h immersion in the solution under −0.8 V cathodic potential. | ||
 | ||
| Fig. 6 Impedance value measured at the defect point and an area 900 μm away from the center of the defect and its change with immersion time under −0.65 V cathodic potential. | ||
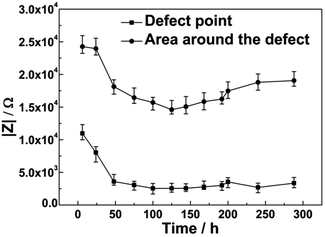 | ||
| Fig. 7 Impedance value measured at the defect point and an area 900 μm away from the center of the defect and its change with immersion time under −0.8 V cathodic potential. | ||
However, the impedance values at the defect firstly decreased and then remained at 7.7 kΩ and 3.3 kΩ under −0.65 V or −0.8 V, respectively. The decreasing cathodic potential resulted in a better protection for the substrate, which inhibited the formation of corrosion products. Thus, after 288 h of immersion, the impedance value at −0.8 V was lower than that at −0.65 V (see Fig. 6 and 7).
3.3 LEIS mapping under CP/OCP cycle
LEIS maps measured on coatings with artificial defects with an applied cathodic potential of −0.65 V/OCP or −0.8 V/OCP after 6 h, 48 h, 144 h, 192 h and 288 h of immersion, respectively, are shown in Fig. 8 and 9. The impedance plots given in Fig. 10 and 11 for the defect point and the area around the defect show how the potentials changed with the immersion time when the applied corrosion potential was cycled from −0.65 V and the OCP or −0.8 V and the OCP, respectively. With increased immersion, the impedance values of both cycle experiments decreased at first and then increased rapidly.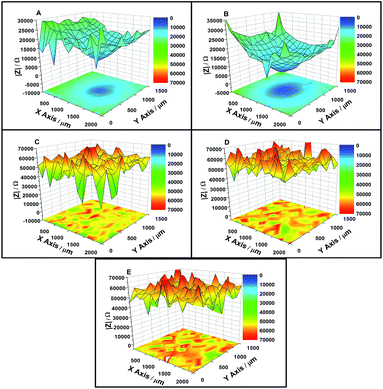 | ||
| Fig. 8 LEIS maps of the defected coating after (A) 6 h, (B) 48 h, (C) 144 h, (D) 192 h, and (E) 288 h immersion in the solution under −0.65 V/OCP cathodic potential. | ||
 | ||
| Fig. 9 LEIS maps of the defected coating after (A) 6 h, (B) 48 h, (C) 144 h, (D) 192 h, and (E) 288 h immersion in the solution under −0.8 V/OCP cathodic potential. | ||
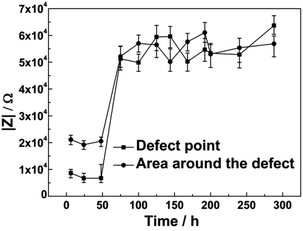 | ||
| Fig. 10 Impedance value measured at the defect point and the area 900 μm away from the center of the defect and its change with immersion time under −0.65 V/OCP cathodic potential. | ||
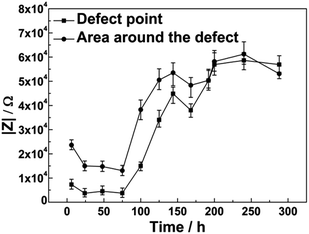 | ||
| Fig. 11 Impedance value measured at the defect point and the area 900 μm away from the center of the defect and its change with immersion time under −0.8 V/OCP cathodic potential. | ||
In the case of −0.65 V/OCP cycle, the defect point exhibited a lowest impedance value of 8.6 kΩ, whereas the impedance value at the point around the defect was approximately 21 kΩ during the early stages of immersion. For the first cycle, when a cathodic potential of −0.65 V was applied to the coated sample, the impedance values exhibited little change during the initial 48 h of immersion. When CP was shut off after 48 h, the impedance values increased quickly to approximately 50 kΩ at the defect point and in the area around the defect after 75 h of immersion. During the subsequent OCP/CP cycle, impedance values increased slightly and remained at around 54 kΩ, as shown in Fig. 10.
In the case of the −0.8 V/OCP cycle, the typical changes of the impedance values of the coating were similar to those during the −0.65 V/OCP potential cycle. The defect point exhibited the lowest impedance value of 7.3 kΩ, whereas the impedance value at the area around the defect was approximately 23 kΩ during the initial stages of immersion. When a cathodic potential of −0.8 V was applied to the sample, the impedance values decreased during the initial 48 h of immersion. As the metallic corrosion beneath the coating gradually progressed, the impedance values at the point defect and around the defect increased to 45 kΩ and 53 kΩ, respectively, after 75 h of immersion when CP was shut off. For the subsequent OCP/CP cycle, the impedance values increased slightly and remained at about 54 kΩ, as shown in Fig. 11.
Decreasing cathodic potential slowed down the increase of the impedance values. For the −0.8 V/OCP potential cycle, the impedance values at the point defect and around the defect increased to the same level until 192 h of immersion. However, for the −0.65 V/OCP cycle, the impedance values at the defect point and around the defect increased to the same level after 75 h immersion.
3.4 Surface morphology
After 288 h immersion, zinc phosphate/epoxy coatings were stripped from the steel surface, and the corrosion morphology of the steel was observed. Fig. 12(A), (B), (C), (D) and (E) show the surface morphology of the steel at the point defect under OCP, −0.65 V, −0.8 V, −0.65 V/OCP cycle, and −0.8 V/OCP cycle, respectively. At the OCP, corrosion products covered the metal at the defect point and around the defect, see Fig. 12(A), though relatively few corrosion products were present at the defect point or around the defect at −0.65 V (Fig. 12(B)). However, there were hardly any corrosion products with an applied CP potential of −0.8 V, see Fig. 12(C). From the −0.65 V/OCP cycle and −0.8 V/OCP cycle panels, more corrosion products covered the point defect location and the area around the defect, see Fig. 12(D) and (E). | ||
| Fig. 12 Surface morphology of the metal at the defect point and around the defect under the following conditions (A) OCP, (B) −0.65 V, (C) −0.8 V, (D) −0.65 V/OCP cycle, and (E) −0.8 V/OCP cycle. | ||
The composition (atom%) of the corrosion product films on the steel surface was measured by energy disperse spectroscopy (EDS) and the results are shown in Table 2. The EDS results for CP static potential experiments indicated that with decreasing cathodic potentials, the oxygen content decreased and zinc content increased at the point defects. Moreover, no phosphorus was detected for CP static potential experiments. For CP/OCP cycling experiments, oxygen content was higher than that of the static CP experiments, and phosphorus and zinc contents were higher than that at the OCP. After the CP/OCP cycling experiments, some corrosion products were present beneath the coating and these were analyzed using X-ray diffraction (XRD). The result of XRD analysis, shown in Fig. 13, confirmed that the corrosion products consisted of FeOOH, Fe + 3O(OH), FeO, Zn(OH)2, and Fe4(PO4)3(OH)3. Thus, the combination of the impedance readings and the EDS results confirmed that under the CP/OCP cycle, zinc phosphate was better able to form a phosphate film beneath the coating defect than was the case under OCP.
| Experimental code | C | Fe | O | P | Zn |
|---|---|---|---|---|---|
| OCP | 30.37 | 47.11 | 21.27 | 0.14 | 0.14 |
| −0.65 V | 42.12 | 39.88 | 17.16 | — | 0.84 |
| −0.8 V | 41.07 | 45.93 | 12.28 | — | 0.72 |
| −0.65 V/OCP cycle | 23.44 | 37.99 | 37.45 | 0.22 | 0.89 |
| −0.8 V/OCP cycle | 33.13 | 47.28 | 18.54 | 0.31 | 0.74 |
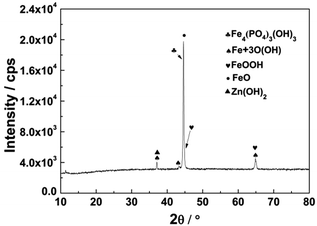 | ||
| Fig. 13 The XRD result of corrosion products beneath the defected zinc phosphate coating under CP/OCP cycle. | ||
4. Discussion
4.1 Mechanism of the corrosive protection of zinc phosphate under OCP
When a zinc phosphate/epoxy coating with a point defect was immersed in a 3.5% NaCl solution, electrochemical corrosion could occur at the defect. Iron dissolved at the anode according to the following equation,| Fe − 2e−→ Fe2+ | (1) |
Oxygen reduction reaction at the cathode was according to the following equation,
| O2 + 2H2O + 4e− → 4OH− | (2) |
Ferrous ion was hydrolyzed at the anode,
| Fe2+ + H2O ⇌ Fe(OH)+ + H+ | (3) |
H+ produced by hydrolysis acidizes the anodic liquid and increases the speed of anodic dissolution. At the same time, H+ reacts with zinc phosphate as follows:
| Zn3(PO4)2 + 2H+ → 3Zn2+ + 2HPO42− | (4) |
Zn2+ and HPO42− react with OH− generated at the cathode,
| Zn2+ + 2OH− ⇌ Zn(OH)2↓ | (5) |
| HPO42− + OH− ⇌ PO43− + H2O | (6) |
The reactions among PO43−, Zn2+, Fe2+ and OH− generate a phosphate film, which could protect the metal and increase the impedance values of the defect point and the area around the defect, see Fig. 2 and 3. The surface morphology, shown in Fig. 12(A) and the results of EDS of the corrosion products containing phosphorus and zinc (Table 2) also demonstrate that at the OCP, a phosphate film is formed at the point defect point and around the defect area.
4.2 Mechanism of corrosion protection of zinc phosphate under CP
When cathodic protection (CP) was applied on a defective coating, the protection mechanism of zinc phosphate was different from the mechanism occurring at the OCP. The reaction of the cathode was the same as eqn (2) mentioned above. However, the electron was supplied by the cathodic protection current. Thus, CP inhibited the dissolution of iron, as in eqn (1) and (3). In tandem, the reaction of zinc phosphate under an alkaline environment was as follows:| Zn3(PO4)2 + 6OH− → 3Zn(OH)2↓ + 2PO43− | (7) |
Under cathodic protection, although there was plenty of PO43− ions generated in solution, it was difficult to form the phosphate film because of insufficient Fe ions, which would result from corrosion of the substrate, inhibited by the cathodic protection. In the latter stage of immersion, the deposition of Zn(OH)2 on the metal surface increased the impedance values slightly, see Fig. 6 and 7. The content of zinc formed under potentials of −0.65 V and −0.8 V was more than that formed at the OCP, which confirmed that the alkaline environment was beneficial for the formation of Zn(OH)2 (Table 2).
4.3 Mechanism of corrosion protection of zinc phosphate under CP/OCP cycle
The formation mechanism of zinc phosphate during the initial 48 h of immersion under cathodic protection was the same as the in the initial 48 h of immersion under CP/OCP cycling, as stated above in section 4.2. When CP was interrupted after 48 h of immersion, the metal was corroded and reacted according to eqn (1)–(3) mentioned above.With the generation of Fe ions and PO43− ions, the phosphate film formed on the metal surface, as in Fig. 12(D) and (E), which resulted in an increase in the impedance values for the defects, as shown in Fig. 10 and 11. During the second stage, when CP was switched off, the formation rate of the phosphate film at −0.8 V was slower than at −0.65 V because the concentration of Fe ions produced by metal dissolution during the first stage when the CP was switched on was lower than that at −0.65 V.
Compared with the alkaline environment caused by cathodic protection when CP was on, the concentration of H+ ions caused by the hydrolysis reaction of Fe2+ was very low (hydrolysis balance constant was about 4.86 × 10⁻¹⁷) to neutralize OH− ions. Zinc phosphate reacted according to eqn (6) and (7) to generate PO43− ion in the alkaline environment generated by the cathodic protection. Therefore, the cyclic CP/OCP experiments were more helpful in forming PO43− ions and the phosphate film at the defect than were the static OCP experiments. For immersion times from 48 h to 144 h, while the CP was switched off, the impedance values increased more quickly during cyclic CP/OCP tests than was the case during the static OCP experiments, as shown in Fig. 3, 10 and 11.
5. Conclusions
The experimental results from LEIS, SEM and EDS reveal that cathodic potentials imposed on the zinc phosphate/epoxy coating panels with artificial defects were able to affect steel corrosion in the region of the coating defect.(1) At the OCP, zinc phosphate exhibited an inhibition effect on the corrosion of the coated steel in the defect area, resulting from the formation of the phosphate film at the defect.
(2) Under applied cathodic potentials of −0.65 V and −0.8 V, the formation of the phosphate film was inhibited, which was attributed to there being insufficient Fe2+ ions.
(3) When the cyclic −0.65 V/OCP and −0.8 V/OCP potentials were imposed on the coated panels, the formation rate of the phosphate film was accelerated because more PO43− ions were produced in the alkaline environment caused by the cathodic protection. Moreover, the −0.65 V/OCP cycle was more beneficial for the formation of the phosphate film than was the −0.8 V/OCP cycle.
Acknowledgements
The authors wish to acknowledge the financial supports of the Fundamental Research Fund for Central Universities (HEUCF201310023 and HEUCF102012001) and the Key Laboratory of Superlight Material and Surface Technology (Harbin Engineering University), Ministry of Education.Notes and references
- M. Mahdavian and M. M. Attar, Electrochim. Acta, 2005, 50, 4645–4648 CrossRef.
- R. Naderi and M. M. Attar, Corros. Sci., 2009, 51, 1671–1674 CrossRef CAS.
- L. Y. Niu, Z. H. Jiang, G. Y. Li, C. D. Gu and J. S. Lian, Surf. Coat. Technol., 2006, 200, 3021–3026 CrossRef CAS.
- M. Zubielewicz and W. Gnot, Prog. Org. Coat., 2004, 49, 358–371 CrossRef CAS.
- A. C. Bastos, M. G. Ferreira and A. M. Simões, Corros. Sci., 2006, 48, 1500–1512 CrossRef CAS.
- J. Sinko, Prog. Org. Coat., 2001, 42, 267–282 CrossRef CAS.
- M. Bethencourt, F. J. Botana, M. Marcos, R. M. Osuna and J. M. Sánchez-Amaya, Prog. Org. Coat., 2003, 46, 280–287 CrossRef CAS.
- L. Chromy and E. Kaminska, Prog. Org. Coat., 1990, 18, 319–324 CrossRef CAS.
- W. Kozlowski and J. Flis, Corros. Sci., 1991, 32, 861–875 CrossRef CAS.
- G. Blustein, M. C. Deyá, R. Romagnoli and B. D. Amo, Appl. Surf. Sci., 2005, 252, 1386–1397 CrossRef CAS.
- B. Rossenbeck, P. Ebbinghaus, M. Stratmann and G. Grundmeier, Corros. Sci., 2006, 48, 3703–3715 CrossRef CAS.
- G. Grundmeier, B. Rossenbeck, K. J. Roschmann, P. Ebbinghaus and M. Stratmann, Corros. Sci., 2006, 48, 3716–3730 CrossRef CAS.
- Y. W. Shao, C. Jia, G. Z. Meng, T. Zhang and F. H. Wang, Corros. Sci., 2009, 51, 371–379 CrossRef CAS.
- Y. S. Hao, F. C. Liu, E. H. Han, S. M. Anjum and G. B. Xu, Corros. Sci., 2013, 69, 77–86 CrossRef CAS.
- D. Amo, R. Romagnoli, V. F. Vetere and L. S. Hernández, Prog. Org. Coat., 1998, 33, 28–35 CrossRef.
- M. Beiro, A. Collazo, M. Izquierdo, X. R. Nóvoa and C. Pérez, Prog. Org. Coat., 2003, 46, 97–106 CrossRef CAS.
- F. Dong, A. Q. Fu, X. G. Li and Y. F. Cheng, Electrochim. Acta, 2008, 54, 628–633 CrossRef.
- S. Touzain, Q. L. Thu and G. Bonnet, Prog. Org. Coat., 2005, 52, 311–319 CrossRef CAS.
- Q. L. Thu, H. Takenouti and S. Touzain, Electrochim. Acta, 2006, 51, 2491–2502 CrossRef.
- F. Zou and D. Thierry, Electrochim. Acta, 1997, 42, 3293–3301 CrossRef CAS.
- M. Macedo, I. C. P. Margarit-Mattos, F. L. Fragata, J. B. Jorcin, N. Pébère and O. R. Mattos, Corros. Sci., 2009, 51, 1322–1327 CrossRef CAS.
- J. B. Jorcin, E. Aragon, C. Merlatti and N. Pébère, Corros. Sci., 2006, 48, 1779–1790 CrossRef CAS.
- D. Snihirova, S. Lamaka and M. F. montemor, Electrochim. Acta, 2012, 83, 439–447 CrossRef CAS.
- V. Barranco, N. Carmona, J. C. Galvan, M. Grobelny, L. Kwiatkowski and M. A. Ville, Prog. Org. Coat., 2010, 68, 347–355 CrossRef CAS.
- S. R. Taylor, Prog. Org. Coat., 2001, 43, 141–148 CrossRef CAS.
- T. T. X. Hang, T. A. Truc, T. H. Nam, V. K. Oanh, J. B. Jorcin and N. Pébère, Surf. Coat. Technol., 2007, 201, 7408–7415 CrossRef CAS.
- C. F. Dong, H. Sheng, Y. H. An, X. G. Li, K. Xiao and Y. F. Cheng, Prog. Org. Coat., 2010, 67, 269–273 CrossRef CAS.
- S. L. Sinebryukhov, A. S. Gnedenkov, D. V. Mashtalyar and S. V. Gnedenkov, Surf. Coat. Technol., 2010, 205, 1697–1701 CrossRef CAS.
- M. Mouanga, M. Puiggali and O. Devos, Electrochim. Acta, 2013, 106, 82–90 CrossRef CAS.
- C. Zhong, X. Tang and Y. F. Cheng, Electrochim. Acta, 2008, 53, 4740–4747 CrossRef CAS.
- Y. J. Zhang, Y. W. Shao, G. Z. Meng, T. Zhang, P. Li and F. H. Wang, J. Coat. Technol. Res., 2015, 12, 777–785 CrossRef CAS.
| This journal is © The Royal Society of Chemistry 2016 |

