Role of interfacial interactions to control the extent of wrapping of polymer chains on multi-walled carbon nanotubes

Suchitra Parija and Arup R. Bhattacharyya*
Department of Metallurgical Engineering and Materials Science, Indian Institute of Technology Bombay, Powai, Mumbai 400076, India. E-mail: arupranjan@iitb.ac.in; Fax: +91-22-2572 6975; Tel: +91-22-2576-7634

Received 9th March 2016 , Accepted 11th April 2016

First published on 13th April 2016


Abstract

A novel method has been developed to establish an enhanced interfacial interaction between polypropylene (PP) and multi-walled carbon nanotubes (MWCNTs) via interfacial engineering. MWCNTs were separated via a hot vacuum filtration technique from a melt-mixed PP/MWCNTs composite containing pristine MWCNTs or the Li-salt of 6-amino hexanoic acid (Li-AHA) modified MWCNTs with a polymeric compatibilizer (polypropylene-g-maleic anhydride; PP-g-MA). Transmission electron microscopic observation suggested the presence of thicker polymer wrapping on the MWCNT surface. Various spectroscopic techniques; viz.; solid state nuclear magnetic resonance spectroscopy, Fourier transform infrared spectroscopy and Raman spectroscopy could unequivocally support the presence of adhered PP chains on the MWCNT surface. Further, differential scanning calorimetry and wide angle X-ray diffraction analysis suggested the presence of the crystallizable PP chains on the MWCNT surface. Thermo-gravimetric analysis showed an increase in the residual weight at 500 °C for the separated MWCNT indicating the formation of an ‘interphase’. A decrease in the DC electrical conductivity was observed in the compacted pellet of the separated MWCNTs of the Li-AHA modified MWCNTs with PP-g-MA indicating the presence of insulating polymer chains on the MWCNT surface. The role of interfacial interactions in the formation of the ‘interphase' was demonstrated via various characterization techniques.

Introduction

Carbon nanotubes (CNTs) are progressively becoming an integral part of the scientific and the technological community over the last twenty years since their discovery by Iijima in 1991.1 The wide range of applications include photovoltaic devices,2,3 superconductors,4 energy storage devices,5 lithium ion batteries,6,7 electromechanical capacitors,8 high performance composites materials,9–14 biomaterials and drug delivery systems15,16 owing to their extraordinary properties such as high elastic modulus, high tensile strength, large aspect ratio, excellent thermal stability and very high electrical conductivity.

However, the disadvantages associated with the CNTs, viz., the tendency to form ‘agglomerates’ structure due to high aspect ratio and strong inter-tube van der Waals force of attraction in pristine CNTs, make them difficult to disperse as ‘individualized’ entity in the polymer matrix. Moreover, atomically smooth surface of multi-walled carbon nanotubes (MWCNTs) in general provides inadequate interfacial adhesion to the polymer matrix, due to which CNTs were subjected to undergo various modifications. Hence, in order to improve the interaction between CNTs and the polymer matrix, methodologies such as acid treatment,17,18 fluorination19 have been reported. The covalent modification includes acidic or basic treatment, which creates desired functional groups on its surface, which in turn significantly improve interfacial interaction between them.20,21 However, the covalent modification creates defects in the ordered graphitic structure, which significantly influences the performance of CNTs/polymer composites. In order to alleviate such issues, non-covalent modification22,23 has been utilized, which involves the use of various secondary forces such as π–π interaction,24 cation–π interaction,25,26 electrostatic interaction27 and the use of surfactant.28 With this technique, the dispersion state of CNTs in the polymer matrix could be improved significantly while retaining the integrity of the tubes.

Non-covalent methodology also utilizes the wrapping of the CNT with the polymer chains. Currently, numerous researchers have validated that wrapping of polymer chains onto the surface of MWCNT could constitute an excellent methodology of surface modification to achieve effective polymer/filler interaction.29–33 O'Connell et al.29 reported that the wrapping of single-walled carbon nanotubes (SWCNTs) by various water soluble polymers viz.; polyvinyl pyrrolidone and polystyrene sulfonate (PSS). Further, CNTs have been successfully solubilized by wrapping with various polymer matrices and bio-polymers, which include PSS,34 chitosan,35 DNA36 and protein.37 The mechanism is largely driven by a thermodynamic drive to eliminate the hydrophobic interface between the nanotubes and their aqueous medium. Similar results have been observed by Tang et al.,38 wherein poly(phenylacetylenes) wrapped CNT composites showed good solubility in common organic solvents. It has also been reported that certain semi-crystalline polymers, viz.; polyethylene and polyamide6 can crystallize on the CNT surface in a periodic fashion, which has been described as nano-hybrid shish-kebab (NHSK) structure.39–41 Recently, Roy et al. demonstrated a facile and effective method for the grafting of MWCNT with poly 2-acrylamido-2-methylpropane sulfonic acid using oxygen plasma induced grafting, nitrogen plasma induced grafting and nitrogen plus oxygen plasma induced grafting techniques.42 The technique of polymer wrapping not only preserves the intrinsic sp2 structure and conjugation in CNT, but also maintains the electronic structure of CNT. Thus, the polymer wrapping technique has become a promising strategy to functionalize, modify and assemble CNT in a non-destructive way.

Polypropylene (PP) has been used widely in many industrial applications primarily due to its low cost and easy processing. CNTs reinforced PP composites hold the promise of delivering excellent composite materials with high strength, light weight, and multi-functional qualities.43 The present investigation involves a novel processing route to develop PP-wrapped MWCNT. The objective of the study was to improve the interfacial interaction between PP and MWCNT by using a novel organic modifier (lithium salt of 6-aminohexanoic acid; Li-AHA) and a reactive compatibilizer (polypropylene-grafted-maleic anhydride; PP-g-MA). It is expected that the melt-interfacial reaction between MA moiety of PP-g-MA and the amine functional group of Li-AHA may facilitate an improved interfacial interaction between PP and MWCNT.44 It is also expected that MWCNT could be wrapped with interfacially interacted PP chains while following the above approach in separated MWCNT. In view of this, we have investigated the morphology and the properties of separated MWCNT from various PP/MWCNTs composites.

Experimental

Materials

Polypropylene (PP) was obtained from Reliance Industries Ltd., India (REPOL H200MA of melt flow index of 23 g/10 min at 230 °C at a load of 2.16 kg; η0 = 305 Pa s at 260 °C). 6-Aminohexanoic acid (AHA) (Merck, Germany, Mw = 131.17; purity: 99%) was neutralized using lithium hydroxide (S. D. Fine-Chem Limited, India, purity: 99%) to obtain lithium salt of 6-aminohexanoic acid (Li-AHA). Polypropylene-g-maleic anhydride (PP-g-MA; MFI = 40 g/10 min at 190 °C at a load of 2.16 kg, density 0.91 g ml−1, MAH content ranging from 1.6–2.5%; η0 = 208 Pa s at 260 °C) was supplied by Pluss Polymers Pvt. Ltd., New Delhi, India. Purified multi-walled carbon nanotubes (MWCNTs) were procured from Nanocyl SA, Belgium (NC 3100, purity > 95%, diameter: 9.5 nm, average length 1.5 μm as per the manufacturer specifications). The detail characterization of the MWCNT can be found elsewhere.45

Melt-mixing of PP/MWCNT composite

Lithium salt of 6-aminohexanoic acid (Li-AHA) was obtained by neutralizing AHA using lithium hydroxide. During the modification, MWCNTs were initially sonicated in distilled water for 20 min. The required amount of Li-AHA solution (to reach the desired weight ratio of x[thin space (1/6-em)]:[thin space (1/6-em)]y, where x = MWNTs and y = Li-AHA) was then added to the MWCNTs dispersion and again sonicated for 10 min. Li-AHA modified MWCNTs dispersion was then subjected to evaporation. The obtained dry powder was then kept in a vacuum oven at 80 °C for 24 h to ensure the complete removal of water. The various compositions of Li-AHA modified MWCNTs, wherein MWCNTs[thin space (1/6-em)]:[thin space (1/6-em)]Li-AHA ratio has been varied from 1[thin space (1/6-em)]:[thin space (1/6-em)]1 to 1[thin space (1/6-em)]:[thin space (1/6-em)]15 (w/w) and are mentioned in Table 1. PP/MWCNTs composite of 5 wt% MWCNTs was prepared by melt-mixing technique via simultaneous mixing strategy in a conical twin-screw micro-compounder (Micro 5; DSM Research, The Netherlands) at 260 °C, 150 rpm for 10 min in N2 atmosphere. In order to prepare PP/MWCNTs composites with PP-g-MA; Li-AHA modified MWCNTs of varying ratios of 1[thin space (1/6-em)]:[thin space (1/6-em)]1, 1[thin space (1/6-em)]:[thin space (1/6-em)]2, 1[thin space (1/6-em)]:[thin space (1/6-em)]4, 1[thin space (1/6-em)]:[thin space (1/6-em)]8 and 1[thin space (1/6-em)]:[thin space (1/6-em)]15 (w/w) MWCNTs[thin space (1/6-em)]:[thin space (1/6-em)]Li-AHA were used, wherein 5 wt% of MWCNTs and 5 wt% PP-g-MA were utilized in all the compositions. The compositions along with the sample codes are mentioned in Table 1.
Table 1 Sample codes for PP/MWCNTs composites and the corresponding separated MWCNT
Composition Sample code for PP/MWCNTs composite Sample code for separated MWCNTs
Pure PP P23
Pristine MWNTs   N
PP + 5 wt% pristine MWNTs P23N5 N5
PP + 5 wt% MWNTs modified by Li-AHA (1[thin space (1/6-em)]:[thin space (1/6-em)]x) + 5 wt% PP-g-MA (x = 1, 2, 4, 8 and 15) P23N51LxG5 N51LxG5


Separation of MWCNT

In order to separate MWCNT from PP/MWCNTs composites, xylene was used as a solvent. PP/MWCNTs composite sample was kept in a soxhlet extractor in boiling xylene for 96 h to dissolve the PP phase from the composite sample. Subsequently, the composite dispersion was set for vacuum filtration with the help of a hot vacuum filtration system. The temperature was maintained at 130 °C, wherein PP phase would dissolve and MWCNT would separate out from the composite dispersion as a residue with continuous addition of hot xylene. Finally, the separated MWCNTs were dried in a vacuum oven at 80 °C for 24 h. Table 1 exhibits the sample codes of the various PP/MWCNTs composites and the corresponding separated MWCNT. The separated MWCNTs were compacted using a hydraulic press machine (Hemco Corporation-Mumbai, India) at a pressure of 5 ton to make a pellet of 3 mm of thickness and 10 mm of diameter, which was used to carry out AC electrical conductivity measurement.

Characterization techniques

HR-TEM observation was carried out for separated MWCNTs samples to investigate the presence of any PP phase on the surface of MWCNT with Jeol JEM-2100F (JAPAN) field emission gun transmission electron microscope at 200 kV.

13C solid state nuclear magnetic resonance (NMR) spectroscopic analysis was carried out for the separated MWCNT on a Bruker750 (Bruker Biospin, Avance III 750 MHz, Switzerland) spectrometer. All the experiments were carried out with 100 mg of the sample at probe ambient temperature.

FTIR spectroscopic analysis was carried out with Nicolet spectrometer (MAGNA 550, USA) for the separated MWCNTs samples in the scanning range of 400–4000 cm−1 at room temperature. A KBr pellet was utilized for the purpose of calibration.

A micro-Raman (HR 800 HORIBA JobinYovon, France) was utilized to perform Raman spectroscopic analysis for pristine and separated MWCNTs samples over a scanning range of 1000 cm−1 to 3000 cm−1. The laser light of wavelength of 514 nm was used with 10 mW power.

Thermo-gravimetric analysis of separated MWCNTs was conducted with SDT Q 600 V 8.3 Build 101 (TA Instruments, USA) from room temperature up to 800 °C at the scanning rate of 10 °C min−1 under nitrogen atmosphere to determine the thermal degradation behavior of the sample.

DSC analysis was carried out using a modulated DSC (Q200, TA Instruments, USA). Samples of 5 mg were dried in a vacuum oven at 80 °C for 12 h prior to the experiment. Non-isothermal crystallization experiment was carried out for the separated MWCNTs in order to study the crystallization behavior of the PP phase (if any), which may exist on the MWCNT surface. In order to investigate non-isothermal crystallization behavior of the PP phase, the sample was equilibrated at −40 °C. Then it was heated to 260 °C at the heating rate of 20 °C min−1 and the melting endotherm of the sample was recorded. The sample was kept for 2 min at isothermal condition at 260 °C and then cooled to −40 °C at the cooling rate of 10 °C min−1, and the crystallization exotherm was recorded. The samples were modulated ±1.33 °C every 100 s to acquire the MDSC signal.

WAXD analysis was carried out on a Panalytical X-Pert Pro X-ray diffractometer (Philips, The Netherlands) for the separated MWCNTs. The incident X-rays (Kα of 1.54 Å) from the Cu-target were monochromatized using a Ni filter. WAXD patterns were recorded in the transmission mode with a step scan with step size of 0.02 between 2θ ranging from 5° to 40°.

Novocontrol Technologies (Alpha A analyzer: 3 μHz to 20 MHz and Agilent E4991A RF analyzer, 1 MHz to 3 GHz, Germany) were utilized to perform AC electrical conductivity measurement on the compacted pellets of separated MWCNTs samples (across the thickness, 3 mm) in the frequency range between 10−1 Hz and 107 Hz.

Results and discussion

Morphological observation of pristine and separated MWCNTs via TEM

The morphology of the MWCNTs, viz., pristine multi-walled carbon nanotubes and nanotubes separated from PP/MWCNTs composites consisting of pristine MWCNTs or Li-AHA modified MWCNTs and PP-g-MA are shown in Fig. 1 and 2. The presence of the polymer layer on the MWCNT surface can be visualized through HR-TEM analysis. Fig. 1(a–d) shows the morphology of the pristine as well as MWCNTs separated from PP/MWCNTs composites with pristine MWCNTs of 2 wt% and 5 wt% respectively. Pristine MWCNT show relatively smooth surface (Fig. 1(a and b)). In contrast, MWCNTs separated from the PP/MWCNTs composites consisting of pristine MWCNTs exhibit roughness on the outer surface, which may originate from the adhered polymer layers on the MWCNT surface as shown in Fig. 1(c and d). It is also observed that the adhered polymer layer has started melting during TEM observation, which also appears as a rough surface. The average diameter (Davg) of the pristine as well as separated MWCNT has been calculated. Pristine MWCNT exhibit Davg of 9.8 nm, whereas separated MWCNT show Davg of 12.63 nm and 10.01 nm corresponding to PP/MWCNTs composite of 2 wt% and 5 wt% pristine MWCNTs respectively. This observation suggests that the extent of PP chain wrapping on pristine MWCNTs is higher in case of separated MWCNTs (N2) from PP/MWCNTs composite of 2 wt% MWCNTs as compared to separated MWCNT (N5) from PP/MWCNTs composite of 5 wt% MWCNTs. It is expected that composite containing 5 wt% MWCNTs may contain bigger remaining ‘agglomerates’ of MWCNTs as compared to the composite containing 2 wt% MWCNTs. This would invariably lead to a varying extent of interaction with the polymer chain, considering the radius of gyration of the PP chain of ∼10–15 nm.46
image file: c6ra06258j-f1.tif
Fig. 1 HR-TEM images of pristine MWCNT at (a) lower and at (b) higher magnification and MWCNT separated from PP/MWCNTs composite of (c) 2 wt% and (d) 5 wt% pristine MWCNTs.

image file: c6ra06258j-f2.tif
Fig. 2 HR-TEM images of MWCNT separated from PP/MWCNTs composite with (a) (1[thin space (1/6-em)]:[thin space (1/6-em)]1), (b) (1[thin space (1/6-em)]:[thin space (1/6-em)]2), (c) (1[thin space (1/6-em)]:[thin space (1/6-em)]4), (d) (1[thin space (1/6-em)]:[thin space (1/6-em)]8) and (e) (1[thin space (1/6-em)]:[thin space (1/6-em)]15) MWCNTs[thin space (1/6-em)]:[thin space (1/6-em)]Li-AHA mixture and PP-g-MA; MWCNTs content was 5 wt% and PP-g-MA concentration was 5 wt% in all the compositions.

On the other hand, MWCNTs separated from PP/MWCNTs composite with Li-AHA modified MWCNTs and PP-g-MA show a higher extent of adhered polymer layer on its surface as shown in Fig. 2(a–d). Separated MWCNT exhibit Davg of 13.4 nm, 14.0 nm, 14.8 nm and 17.8 nm corresponding to PP/MWCNTs composite of 5 wt% Li-AHA modified MWCNTs of (1[thin space (1/6-em)]:[thin space (1/6-em)]1), (1[thin space (1/6-em)]:[thin space (1/6-em)]2), (1[thin space (1/6-em)]:[thin space (1/6-em)]4) and (1[thin space (1/6-em)]:[thin space (1/6-em)]8) (w/w) MWCNTs[thin space (1/6-em)]:[thin space (1/6-em)]Li-AHA along with 5 wt% PP-g-MA respectively. This suggests that MWCNTs modification via Li-AHA and the use of the compatibilizer (PP-g-MA) could enhance the interfacial interaction between MWCNT and the PP chains, which could lead to a higher extent of polymer wrapping on the MWCNT surface. It is to be pointed out that the polymer adhered surface of MWCNT is appeared different from the corresponding separated MWCNT from PP/MWCNTs composite of pristine MWCNTs. Polymer melting during TEM investigation along with interfacially adhered PP phase may appear different in the separated MWCNTs.

The extent of interfacial interaction seems to be highest for MWCNTs separated from PP/MWCNTs composite of (1[thin space (1/6-em)]:[thin space (1/6-em)]15) (w/w) MWCNTs[thin space (1/6-em)]:[thin space (1/6-em)]Li-AHA, which depicts Davg of 19.7 nm as shown in Fig. 2(e). It is envisaged that Li-AHA modification leads to smaller ‘agglomerates’ of MWCNTs along with ‘individualized’ MWCNT due to the strong electrostatic repulsion between AHA species and MWCNT in the aqueous dispersion.45 On removal of the deionized water from the respective Li-AHA modified MWCNTs dispersion, Li-AHA molecules adsorb on the MWCNT surface. Further, amine functionality of Li-AHA could engage in the melt-interfacial reaction during melt-mixing with the MA moiety of PP-g-MA, which could lead to an enhanced interfacial reaction.47,48 A similar observation has been reported in the literature,49 where poly(butyl acrylate) (PBA) encapsulated MWCNT have been observed even after 72 h of Soxhlet extraction with boiling acetone, suggesting that the PBA could attach on the sidewalls of MWCNT.

Solid state NMR, FT-IR and Raman spectroscopic analyses to assess the interfacial interaction

Solid state 13C NMR analysis has been performed on neat PP, PP-g-MA and MWCNTs separated from PP-based various composites in order to understand the possible interactions involved between PP and MWCNT and the corresponding NMR spectroscopic results are shown in Fig. 3. Neat PP exhibits strong 13C NMR resonance signals at 24.4, 28.8 and 45.6 ppm, which are attributed to chemical shift for methyl (CH3), methane (CH) and methylene (CH2) groups of polypropylene chain respectively.50
image file: c6ra06258j-f3.tif
Fig. 3 Solid state NMR analysis of MWCNTs separated from various PP/MWCNTs composites along with pure PP and PP-g-MA.

For neat PP-g-MA, apart from methyl, methane and methylene carbon, chemical shift at 177.7 ppm is observed in the spectrum, which is a signature for the carbon atoms corresponding to MA moiety.51 It is observed that the separated MWCNT (N5) from pristine PP/MWCNTs composite involving pristine MWCNTs do not show any signature of the PP phase. However, traces of the PP phase are observed in the separated MWCNTs from PP/MWCNTs composites involving Li-AHA modified MWCNTs and PP-g-MA. It is interesting to note that separated MWCNT from PP/MWCNTs composite of (1[thin space (1/6-em)]:[thin space (1/6-em)]2) and (1[thin space (1/6-em)]:[thin space (1/6-em)]4) MWCNTs[thin space (1/6-em)]:[thin space (1/6-em)]Li-AHA show NMR resonance signals at 24.4, 28.8 and 45.6 ppm, which indicate the presence of the PP phase. The peak at 177.7 ppm in the spectrum corresponding to PP-g-MA has been shifted to 172.8 ppm in the separated MWCNT, indicating the signature of carbon atoms for imide functionality.52 This observation may be due to melt-interfacial reaction as mentioned earlier. Moreover, with higher extent of modification [(1[thin space (1/6-em)]:[thin space (1/6-em)]8) and (1[thin space (1/6-em)]:[thin space (1/6-em)]15) w/w MWCNTs[thin space (1/6-em)]:[thin space (1/6-em)]Li-AHA], the intensity corresponding to the signal at 172.8 ppm becomes very weak in the respective spectrum of the separated MWCNTs (Fig. S1). This is probably due to the fact that a higher extent of melt-interfacial reaction between the carbonyl groups of PP-g-MA and NH2 functionality of the Li-AHA leads to higher extent of ‘interphase’ formation, which may impede the relaxation phenomenon arising from imide bonds. Similar observations have been reported in the literature, wherein the polymer phase is interacting with the surface modifier leading to a change in the intensity of the NMR spectrum.53,54 In brief, NMR spectroscopic observation could serve as a significant evidence for interaction between MA moiety of the PP-g-MA and NH2 functional group of Li-AHA along with the signature of the PP phase, which confirms the polymer wrapping on the separated MWCNT surface.

The extent of melt-interfacial reaction between Li-AHA and PP-g-MA and the subsequent interaction between PP and MWCNT is also confirmed via FTIR spectroscopic analysis of MWCNTs separated from PP/MWCNTs composites as shown in Fig. 4(a). The peak at 1467 cm−1 corresponds to the deformation vibration band of –CH2, the asymmetric and symmetric in-plane C–H (–CH3) vibration shows at 1451 cm−1 and 1374 cm−1 (as a shoulder), which confirms the polypropylene phase.55–57 The peak at 1543 cm−1 is assigned to the N–H bending vibration and peak at 1737 cm−1 corresponds to the C[double bond, length as m-dash]O stretching vibration corresponding to the characteristic of the imide bond.53,58 Moreover, it is to be noted that even after separation process with boiling xylene for prolonged time period, the characteristic peaks corresponding to the PP phase could be observed in the spectra of separated MWCNTs from PP/MWCNTs composites with Li-AHA modified MWCNTs and PP-g-MA.


image file: c6ra06258j-f4.tif
Fig. 4 (a) FTIR spectroscopic analysis of MWCNTs separated from PP/MWCNTs composites; (b) intensity ratio of imide peak to the peak at 1115 cm−1 as a function of Li-AHA concentration; (c) intensity ratio of –N–H bending peak to the peak at 1115 cm−1 as a function of Li-AHA concentration.

Further, the FTIR spectra also suggest the occurrence of melt-interfacial reaction between amine functional group of Li-AHA and MA moiety of PP-g-MA.48,50 The extent of melt-interfacial reaction is estimated by comparing the relative intensity of imide C[double bond, length as m-dash]O stretching band (I1737) and amide N–H bending (I1543) with respect to a band in the fingerprint region (I1115, C–C stretching, which is unaffected due to melt-interfacial reaction). Fig. 4(b) and (c) show the relative increase in intensity of I1737/I1115 and I1543/I1115 with increase in Li-AHA concentration respectively. It is evident that in case of separated MWCNTs from PP/MWCNTs composite involving pristine MWCNTs; the melt-interfacial reaction is completely absent. However, for MWCNTs separated from PP/MWCNTs composites of Li-AHA modified MWCNTs and PP-g-MA, a significantly higher extent of melt-interfacial reaction is observed at higher Li-AHA concentration and the dependence is observed to be linear in nature. A similar observation has been reported for PA6/EG/MWCNTs composite in the presence of Li-AHA modified MWCNTs.59 The higher extent of melt-interfacial reaction may be due to the availability of higher fraction of NH2 functionality of Li-AHA, which may participate in the melt-interfacial reaction with the anhydride group associated with the PP-g-MA. A similar observation has been observed while considering the relative peak area of A1737/A1115 and A1543/A1115, which increases as a function of Li-AHA concentration (Fig. S2), indicating higher extent of melt-interfacial reaction with increasing Li-AHA concentration.

Raman spectroscopic analysis for pristine MWNTs and separated MWNTs are shown in Fig. 5. Two distinct peaks around 1344 cm−1 and 1581 cm−1 are observed for pristine MWCNTs (N) denoted as D and G band respectively. The D band is attributed to the defects in the curved graphite sheet, arising from the sp2 carbon (C–C).60 The G band is associated with in-plane stretching vibration mode in the basal plane of graphite, which indicates the presence of ordered graphitic carbon (C[double bond, length as m-dash]C) in MWCNTs.61 It is observed that both the G and D bands are shifted to the higher wave-numbers for the MWCNTs separated from PP/MWCNTs composite with pristine MWCNTs. The up-shift is more prominent for MWCNTs separated from Li-AHA modified MWCNTs and PP-g-MA compatibilized PP/MWCNTs composite. G-band is shifted to 1583.5 cm−1, 1584.1 cm−1, 1586.1 cm−1 and 1586.8 cm−1 (w/w) for separated MWCNTs from PP/MWCNTs composite of MWCNTs[thin space (1/6-em)]:[thin space (1/6-em)]Li-AHA ratio of (1[thin space (1/6-em)]:[thin space (1/6-em)]1), (1[thin space (1/6-em)]:[thin space (1/6-em)]2), (1[thin space (1/6-em)]:[thin space (1/6-em)]4) and (1[thin space (1/6-em)]:[thin space (1/6-em)]8) (w/w) respectively (Table 2). A maximum up-shift in G-band is observed in MWCNTs separated from PP/MWCNTs composite of (1[thin space (1/6-em)]:[thin space (1/6-em)]15) (w/w) MWCNTs[thin space (1/6-em)]:[thin space (1/6-em)]Li-AHA (1589.5 cm−1). Similarly, up-shift in D-band to 1346.7 cm−1, 1346.9 cm−1, 1349.2 cm−1, 1349.6 cm−1 and 1350.2 cm−1 is demonstrated for separated MWCNTs from PP/MWCNTs composite of MWCNTs[thin space (1/6-em)]:[thin space (1/6-em)]Li-AHA ratio of (1[thin space (1/6-em)]:[thin space (1/6-em)]1), (1[thin space (1/6-em)]:[thin space (1/6-em)]2), (1[thin space (1/6-em)]:[thin space (1/6-em)]4), (1[thin space (1/6-em)]:[thin space (1/6-em)]8) and (1[thin space (1/6-em)]:[thin space (1/6-em)]15) (w/w) respectively. The up-shift in both G-band and D-band indicates a strong interaction between PP and the MWCNT, suggesting the hydrostatic pressure exerted by the adhered polymer layer on the MWCNT surface.62 The contact between the nanotube walls and the polymer chains may directly influence the vibrations of the MWCNT, leading to the observed shifts in the Raman spectra.63 The up-shift in D and G band could also be as a consequence of strong compressive forces associated with PP chains on MWCNT surface.64


image file: c6ra06258j-f5.tif
Fig. 5 Raman spectra of (a) MWCNTs separated from PP/MWCNTs composites of Li-AHA modified MWCNTs and PP-g-MA (b) pristine MWCNTs and MWCNTs separated from PP/MWCNTs composites pristine MWCNTs; (c) ID/IG ratio for separated MWCNTs as a function of Li-AHA concentration.
Table 2 D-band and G-band position and ID/IG ratio for pristine and separated MWCNTs
Sample D-band G-band ID/IG
N 1344.3 1581.5 0.99
N5 1344.6 1582.2 0.98
N51L1G5 1346.7 1583.5 0.96
N51L2G5 1346.9 1584.1 0.92
N51L4G5 1349.2 1586.1 0.86
N51L8G5 1349.6 1586.8 0.84
N51L15G5 1350.2 1589.5 0.82


The intensity ratio of D-band and G-band (ID/IG) with varying Li-AHA concentration is presented in Fig. 5(c) and the corresponding values are summarized in Table 2.

Pristine MWCNTs exhibit ID/IG ratio is 0.99. Such a higher value of ID/IG could be due to large ‘agglomerates’ structure associated with pristine MWCNTs. However, ID/IG value decreases for MWCNTs separated from PP/MWCNTs composites, being 0.98 for MWCNTs separated from PP/MWCNTs composite of 5 wt% pristine MWCNTs. Moreover, ID/IG value decreases further for MWCNTs separated from PP/MWCNTs composite of Li-AHA modified MWCNTs and PP-g-MA with increasing Li-AHA concentration with the values being 0.96, 0.92, 0.86 and 0.84 for MWCNTs[thin space (1/6-em)]:[thin space (1/6-em)]Li-AHA ratio of (1[thin space (1/6-em)]:[thin space (1/6-em)]1), (1[thin space (1/6-em)]:[thin space (1/6-em)]2), (1[thin space (1/6-em)]:[thin space (1/6-em)]4) and (1[thin space (1/6-em)]:[thin space (1/6-em)]8) (w/w) respectively. ID/IG value is lowest (0.82) for MWCNTs separated from PP/MWCNTs composite of MWCNTs[thin space (1/6-em)]:[thin space (1/6-em)]Li-AHA ratio of (1[thin space (1/6-em)]:[thin space (1/6-em)]15). It has been reported that the reduction in the ID/IG ratio indicates well ‘de-agglomerated’ MWCNTs in the presence of the modifier.45 It is proposed that due to ‘de-agglomeration’ of MWCNTs, the photon absorption may increase when a higher ordered graphitic fraction of MWCNTs is exposed to the laser.65 This observation further suggests that polymer wrapping on the surface of MWCNT eventually leads to smaller ‘agglomerates’ and ‘individualized’ MWCNT structure. This behavior is more significant for MWCNTs separated from PP/MWCNTs composite of Li-AHA modified MWCNTs and PP-g-MA as compared to separated MWCNTs from PP/MWCNTs composite of pristine MWCNTs. Polymer wrapping on the surface of the MWCNT leads to the ‘de-agglomeration’, which may lead to a decrease in ID/IG ratio.

Thermo-gravimetric analysis to establish the formation of an ‘interphase’

Fig. 6(a) depicts the weight loss as a function of temperature in the nitrogen atmosphere for MWCNTs separated from PP/MWCNTs composite involving pristine as well as Li-AHA modified MWCNTs with PP-g-MA. The corresponding thermal degradation parameters viz.; onset of thermal degradation temperature (Tonset) and % residual weight are summarized in Table 3. The thermal degradation plot for pure PP is shown in Fig. S3. Pristine MWCNTs are stable and do not show any significant decomposition in the temperature range of 25–800 °C under nitrogen atmosphere. The marginal decomposition at 400–800 °C may presumably be due to the presence of functional groups exists in MWCNTs. On the other hand, pure PP exhibits Tonset at 426.9 °C for pure PP. It is observed that MWCNT separated (Tonset = 450 °C) from PP/MWCNTs composite of 5 wt% pristine MWCNTs exhibit less thermal stability as compared to pristine MWCNT. The weight loss observed at the initial stage may be due to the presence of moisture. In pristine MWCNTs this weight loss is not observed at the initial stage. However, the presence of polymer on the surface of separated MWCNTs from PP/MWCNTs composites may lead to an absorption of moisture. This observation suggests the presence of functional groups on the MWCNT surface as well as some traces of the PP chains, which was still adhered after the separation process. However, in case of separated MWCNTs corresponding to PP/MWCNTs composite with Li-AHA modified MWCNTs and PP-g-MA as a compatibilizer, Tonset values show different behavior. The value of Tonset decreases with increasing Li-AHA concentration, the values being 347.9 °C, 345.6 °C, 331.7 °C, 241.3 °C and 216.7 °C for MWCNTs modified by Li-AHA in the ratio of (1[thin space (1/6-em)]:[thin space (1/6-em)]1), (1[thin space (1/6-em)]:[thin space (1/6-em)]2), (1[thin space (1/6-em)]:[thin space (1/6-em)]4), (1[thin space (1/6-em)]:[thin space (1/6-em)]8) and (1[thin space (1/6-em)]:[thin space (1/6-em)]15) (w/w) MWCNTs[thin space (1/6-em)]:[thin space (1/6-em)]Li-AHA respectively as shown in Table 3. It is reported that thermal stability of the organic modifier; Na-AHA is ∼375 °C.66 This observation can be extended for Li-AHA as well, wherein the degradation starts early in MWCNTs separated from PP/MWCNTs composite of Li-AHA modified MWCNTs and PP-g-MA. In order to understand the thermal stability of the separated MWCNTs, the % residual weight at 500 °C has been calculated.
image file: c6ra06258j-f6.tif
Fig. 6 % weight as a function of temperature for (a) pristine MWCNTs and MWCNTs separated from PP/MWCNTs composites under nitrogen atmosphere, (b) % residual weight at 500 °C as a function of Li-AHA concentration for separated MWCNTs.
Table 3 Tonset and % residual weight for MWCNTs separated from PP/MWCNTs composite during thermo-gravimetric analysis in nitrogen atmosphere
Sample Onset of degradation (Tonset) (°C) Residual wt% (at 500 °C)
P23 426.9 0.54
N5 450.0
N51L1G5 347.9 15.9
N51L2G5 345.6 40.9
N51L4G5 331.7 43.8
N51L8G5 241.3 65.4
N51L15G5 216.7 72.9


Fig. 6(b) shows the plot of % residual weight of separated MWCNTs with increasing Li-AHA concentration. Interestingly, the residual wt% is observed to be increasing with increasing Li-AHA concentration and the values being 15.9%, 40.9%, 43.8% and 65.4% for MWCNTs[thin space (1/6-em)]:[thin space (1/6-em)]Li-AHA ratio of (1[thin space (1/6-em)]:[thin space (1/6-em)]1), (1[thin space (1/6-em)]:[thin space (1/6-em)]2), (1[thin space (1/6-em)]:[thin space (1/6-em)]4) and (1[thin space (1/6-em)]:[thin space (1/6-em)]8) (w/w) respectively. The % residual weight is maximum (73%) for MWCNTs separated from PP/MWCNTs composite with MWCNTs[thin space (1/6-em)]:[thin space (1/6-em)]Li-AHA ratio of (1[thin space (1/6-em)]:[thin space (1/6-em)]15) (w/w). Please note that pure PP shows 0.54 wt% of residual weight at 500 °C. The retention of higher fraction of the polymer chains corresponding to the MWCNTs separated from PP/MWCNTs composite of Li-AHA modified MWCNTs and PP-g-MA manifests an enhanced interfacial interaction between MWCNTs and the PP phase. Similar results have been reported for MWCNTs wrapped with polystyrene or poly (methyl methacrylate).67 The improved thermal stability is strongly dependent on the extent of interaction between MWCNT and the PP phase, which is significantly improved due to melt-interfacial reaction between amine functionality of Li-AHA and MA moiety of PP-g-MA, which may lead to the ‘interphase’ formation. It has been reported that for PA6/ABS blends, wherein the higher residual weight at higher temperature in case of MWCNTs modified with Na-AHA was correlated to the melt-interfacial reaction between the –NH2 functionality of Na-AHA and the acid end group of the PA6 phase.48

Interaction in the amorphous region

The glass transition temperature (Tg) of the PP phase in the separated MWCNTs has been investigated by MDSC analysis. The temperature-derivative plot of the heat capacity signal, (dCp/dT) as a function of temperature yields Tg as a distinct peak. Fig. 7(a) shows the Tg of the PP phase for all the separated MWCNT during the heating scan. Pure PP shows a Tg of −19.9 °C. Moreover, the separated MWCNTs show Tg in between −5 °C and −20 °C as shown in Table 4.
image file: c6ra06258j-f7.tif
Fig. 7 (a) Temperature-derivative of the heat capacity in the glass transition region for MWCNTs separated from PP/MWNTs composite (pure PP is also shown as a reference); (b) glass transition temperature (Tg) of the PP phase as a function of Li-AHA concentration for separated MWCNTs.
Table 4 Bulk crystallization temperature (Tc), melting temperature (Tm), glass transition temperature (Tg), enthalpy of melting (ΔHm) and enthalpy of crystallization (ΔHc) of MWCNTs separated from various PP/MWCNTs composites
Sample Tg (°C) Tc (°C) Tm (°C) ΔHc (J g−1) ΔHm (J g−1)
P23 −19.9 114.74 161.09 105.2 112.9
N5 −19.8
N51L1G5 −14.4
N51L2G5 −12.8
N51L4G5 −12.4 125.1 161.9 37.2 41.1
N51L8G5 −10.3 123.2 160.54 42.6 49.2
N51L15G5 −9.9 122.1 160.51 53.3 61.03


It is observed that MWCNTs separated from PP/MWCNTs composite of pristine MWCNTs show a Tg at −19.8 °C. However, Tg values are increased for MWCNTs separated from PP/MWCNTs composite of Li-AHA modified MWCNTs and PP-g-MA with increase in Li-AHA concentration, the values being −14.4 °C, −12.8 °C, −12.4 °C and −10.3 °C for MWCNTs[thin space (1/6-em)]:[thin space (1/6-em)]Li-AHA ratio of (1[thin space (1/6-em)]:[thin space (1/6-em)]1), (1[thin space (1/6-em)]:[thin space (1/6-em)]2), (1[thin space (1/6-em)]:[thin space (1/6-em)]4) and (1[thin space (1/6-em)]:[thin space (1/6-em)]8) (w/w) respectively as shown in Fig. 7(b). A Tg value of −9.9 °C is registered for MWCNTs separated from PP/MWCNTs composite with MWCNTs[thin space (1/6-em)]:[thin space (1/6-em)]Li-AHA ratio of 1[thin space (1/6-em)]:[thin space (1/6-em)]15 (w/w). The increase in the Tg value for the PP phase may be assigned to an interfacial layer formed on the sidewalls of MWCNT, which may reduce the segmental mobility of the polymer chains significantly, enhancing the Tg value.68,69 The above analysis also suggests an enhanced interaction between the amorphous phase of the PP and the MWCNT in the presence of Li-AHA modified MWCNTs and PP-g-MA. This observation also suggests the ‘interphase’ formation in the presence of Li-AHA modified MWCNTs and PP-g-MA, which has been reflected in the higher % residual weight of the separated MWCNTs at 500 °C during the TGA scan.

Crystallization behaviour of the PP phase in the separated MWCNTs via DSC and WAXD analysis

The non-isothermal crystallization behaviour of the PP phase in the separated MWCNTs from various PP/MWCNTs composites has been investigated by DSC analysis. Representative plots of heat flow as a function of temperature during cooling cycle are shown in Fig. 8(a). In contrast, Fig. 8(b) shows the melting endotherm of the PP phase of separated MWCNTs (along with pure PP). The corresponding thermal parameters viz.; bulk crystallization temperature (Tc), melting temperature (Tm), enthalpy of crystallization (ΔHc) and enthalpy of melting (ΔHm) are summarized in Table 4.
image file: c6ra06258j-f8.tif
Fig. 8 (a) Crystallization exotherms and (b) melting endotherms of the PP phase in MWCNTs separated from PP/MWCNTs composite (pure PP is also shown as a reference).

Pure PP exhibits Tc at ∼114.7 °C. It is observed that MWCNTs separated (N5) from the PP/MWCNTs composite of pristine MWNTs do not show any crystallization peak corresponding to the PP phase. However, MWCNTs separated from the PP/MWCNTs composite of PP-g-MA and MWCNTs[thin space (1/6-em)]:[thin space (1/6-em)]Li-AHA ratio of 1[thin space (1/6-em)]:[thin space (1/6-em)]4, 1[thin space (1/6-em)]:[thin space (1/6-em)]8 and 1[thin space (1/6-em)]:[thin space (1/6-em)]15 (w/w) show Tc at 125.1 °C, 123.2 °C and 122.1 °C respectively, corresponding to the crystallizable PP phase. This observation suggests the presence of crystallizable PP phase on the surface of the separated MWCNTs. The incorporation of Li-AHA modified MWCNTs and the use of PP-g-MA as a compatibilizer could facilitate favorable interfacial interaction between the PP chains and MWCNT. Further, Tc value of the PP phase in separated MWCNT is significantly higher than pure PP. This could be due to hetero-nucleating action of MWCNT, which is reflected in the increase in Tc.70 Tc value is decreased gradually with increase in the Li-AHA concentration in PP/MWCNTs composite. This could be due to the reduction in the extent of hetero-nucleating action of Li-AHA-modified MWCNTs.45 The melt-interfacial reaction between PP-g-MA and Li-AHA may also lead to an encapsulation of the PP chains on the MWCNT surface, which could be one of the reasons for suppressing the extent of hetero-nucleating action of the separated MWNTs. It is observed that with increase in Li-AHA concentration in the PP/MWCNTs composite, the corresponding value of normalized ΔHc for separated MWCNTs is gradually increased and is maximum for MWCNTs separated from PP/MWCNTs composite of MWCNTs modified by Li-AHA of 1[thin space (1/6-em)]:[thin space (1/6-em)]15 (w/w) MWCNTs[thin space (1/6-em)]:[thin space (1/6-em)]Li-AHA with the value being 53.2 J g−1 (Fig. S4). This observation also suggests the presence of highest extent of crystallizable PP phase on the surface of MWCNT corresponding to this composition.

Melting endotherms for the PP phase in the separated MWNTs are shown in Fig. 8(b). Increase in the melting enthalpy is also observed with increase in Li-AHA concentration as shown in Table 4. As observed in Fig. 8(b), the separated MWNTs from PP/MWCNTs composite of pristine MWCNTs do not show any melting peak corresponding to the PP phase.

However, the melting endotherm for separated MWCNTs from PP/MWCNTs composite of MWCNTs[thin space (1/6-em)]:[thin space (1/6-em)]Li-AHA ratio of 1[thin space (1/6-em)]:[thin space (1/6-em)]4, 1[thin space (1/6-em)]:[thin space (1/6-em)]8 and 1[thin space (1/6-em)]:[thin space (1/6-em)]15 (w/w) and PP-g-MA show melting peak at 161.8 °C, 160.54 °C and 160.51 °C respectively corresponding to the PP phase. No significant change in the melting peak is observed with increasing Li-AHA concentration. It is observed that with increase in Li-AHA concentration in the PP/MWCNTs composite, the corresponding value of normalized ΔHm for separated MWCNTs is also increased and is maximum for MWCNTs separated from PP/MWCNTs composite of MWCNTs[thin space (1/6-em)]:[thin space (1/6-em)]Li-AHA ratio of 1[thin space (1/6-em)]:[thin space (1/6-em)]15 (w/w) with the value being 61.03 J g−1 (see supporting Fig. 4). Both the crystallization and melting analysis of the separated MWCNTs unequivocally suggest the presence of higher fraction of crystallizable PP phase with increasing Li-AHA concentration.44

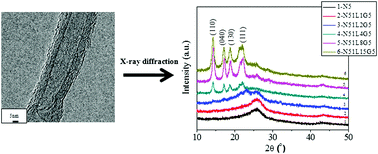
Further, to confirm the nature of the crystallizable PP phase on the surface of separated MWCNTs, the separated MWCNTs from PP/MWCNTs composites are investigated using WAXD analysis and the corresponding diffraction patterns are presented in Fig. 9. The diffraction pattern for pure PP is shown in the inset of Fig. 9 indicating the characteristic diffraction peaks at 2θ of 14.2°, 17.1°, 18.7°, 21.2° and 22° corresponding to α-crystalline phase. For pristine MWCNTs, characteristic diffraction peaks are centered at 2θ of 25.8° and 43.1° corresponding to (002) and (100) reflection of the hexagonal crystal structure of graphite, which is the structural equivalent of the MWCNT.71 It is observed that the MWCNTs separated from PP/MWCNTs composite with pristine MWCNT do not show any signature of the crystallizable PP phase in the WAXD pattern. On the contrary, MWCNTs separated from PP/MWCNTs composite of Li-AHA modified MWCNTs and PP-g-MA as a compatibilizer show distinct diffraction peaks corresponding to α-crystalline phase of the PP phase. The four main characteristic diffraction peaks for the PP phase at 2θ of 14.2°, 17.1°, 18.7°, and 21.2° corresponding to (110), (040), (130) and (111) planes of α-crystalline phase of PP are observed for MWCNTs separated from PP/MWCNT composite with Li-AHA modified MWCNTs and PP-g-MA of MWCNTs[thin space (1/6-em)]:[thin space (1/6-em)]Li-AHA ratio of 1[thin space (1/6-em)]:[thin space (1/6-em)]2, 1[thin space (1/6-em)]:[thin space (1/6-em)]4, 1[thin space (1/6-em)]:[thin space (1/6-em)]8 and 1[thin space (1/6-em)]:[thin space (1/6-em)]15 (w/w). It is also interesting to observe that with increase in Li-AHA content in the PP/MWCNTs composite, the intensity of the diffraction peak corresponding to the PP phase is enhanced. Norrish et al. have established a direct correlation between the intensity of the X-ray diffraction pattern and the concentration of the component.72 This confirms that with increasing the Li-AHA concentration, the amount of the crystallizable PP phase on the surface of the separated MWCNTs increases and is highest for MWCNTs separated from PP/MWCNTs composite of MWCNTs[thin space (1/6-em)]:[thin space (1/6-em)]Li-AHA ratio of 1[thin space (1/6-em)]:[thin space (1/6-em)]15 (w/w).


image file: c6ra06258j-f9.tif
Fig. 9 WAXD pattern of MWNTs separated from PP/MWCNTs composite (inset shows the WAXD pattern for pure PP).

AC electrical conductivity of the compacted pellets of separated MWCNTs

AC electrical conductivity versus frequency plot of the compacted pellets of pristine MWCNT and separated MWCNT from various PP/MWCNT composites are shown in Fig. 10(a). It is observed that pristine MWCNT exhibit the highest value of the DC electrical conductivity (σDC), which is in the order of 10−4 S cm−1. However, a reduction in the σDC value is observed for MWCNTs separated from PP/MWCNTs composite, suggesting unequivocally the presence of insulating polymer layer on separated MWCNTs surface. Presence of the polymer layer on the surface of MWCNT reduces the σDC of the separated MWCNTs. Apparently; MWCNT separated from PP/MWCNT composite of pristine MWCNTs show a least reduction in DC electrical conductivity suggesting the presence of negligible fraction of the PP phase on MWCNT surface. However, MWCNTs separated from PP/MWCNTs composite with Li-AHA modified MWCNTs and PP-g-MA as a compatibilizer show a significant decrease in the σDC value indicating the higher amount of polymer wrapping on the separated MWNTs surface. The AC electrical conductivity results are fitted with Jonscher's power law and the corresponding σDC values are calculated and shown in Table 5. Fig. 10(b) shows the plot of the DC electrical conductivity (σDC) values of the separated MWCNTs as a function of Li-AHA concentration.
image file: c6ra06258j-f10.tif
Fig. 10 (a) AC electrical conductivity versus frequency plot for compacted pellets of pristine and separated MWCNTs; (b) DC electrical conductivity as a function of Li-AHA concentration for compacted pellets of separated MWCNTs.
Table 5 DC electrical conductivity of compacted pellets of pristine and separated MWCNTs
Sample DC electrical Conductivity (S cm−1)
N 1.95 × 10⁻²
N5 3.04 × 10⁻³
N51L1G5 1.2 × 10⁻³
N51L2G5 9.4 × 10⁻⁴
N51L4G5 3.65 × 10⁻⁴
N51L8G5 2.5 × 10⁻⁵
N51L15G5 7.2 × 10⁻⁶


It is observed that the σDC value is progressively decreasing with increase in the Li-AHA concentration in PP/MWNTs composites; the values being 1.2 × 10⁻³ S cm−1, 9.4 × 10⁻⁴ S cm−1, 3.65 × 10⁻⁴ S cm−1, and 2.5 × 10⁻⁵ S cm−1 for MWCNTs[thin space (1/6-em)]:[thin space (1/6-em)]Li-AHA ratio of (1[thin space (1/6-em)]:[thin space (1/6-em)]1), (1[thin space (1/6-em)]:[thin space (1/6-em)]2), (1[thin space (1/6-em)]:[thin space (1/6-em)]4) and (1[thin space (1/6-em)]:[thin space (1/6-em)]8) (w/w) MWCNTs[thin space (1/6-em)]:[thin space (1/6-em)]Li-AHA respectively. The lowest value is observed for the MWCNTs separated from the composite containing MWCNTs[thin space (1/6-em)]:[thin space (1/6-em)]Li-AHA ratio of 1[thin space (1/6-em)]:[thin space (1/6-em)]15 (w/w) and PP-g-MA, which is 7.2 × 10⁻⁶ S cm−1. This result indicates an enhanced polymer wrapping on MWCNT surface and PP being insulating component reduces the electrical conductivity of the separated MWCNTs.

Interaction between PP and MWCNTs in the presence of the modifier and the compatibilizer

Fig. 11 shows the schematic presentation of the interfacial interaction between the MWCNTs and the PP chains in the presence of Li-AHA and PP-g-MA. MWCNTs dispersed as a pristine form within the PP matrix lead to considerable extent of MWCNTs ‘agglomerates’. MWCNTs of higher extent of entanglement and strong inter-tube van der Waals force lead to the ‘agglomeration’ between nanotubes. Thus, it becomes very difficult to separate them and disperse them into the polymer matrix. The modification of MWCNTs results in a finer dispersion of MWCNTs in the PP matrix and the addition of PP-g-MA leads to melt-interfacial reaction. These two factors significantly alter the interfacial interaction between MWCNT and the PP chains.
image file: c6ra06258j-f11.tif
Fig. 11 Schematic representation of interfacial interaction due to melt-interfacial reaction between amine group of Li-AHA and anhydride moiety of PP-g-MA.

This has been confirmed by separating the MWCNTs from PP/MWCNTs composite of pristine MWCNTs as well as Li-AHA modified MWCNTs with PP-g-MA. MWCNTs separated from the PP/MWCNTs composite of pristine MWCNTs exhibit clean outer surface indicating inadequate interaction between the PP chains and the MWCNTs as observed from the corresponding HR-TEM image. On the other hand, MWCNTs separated from PP/MWCNTs composite with Li-AHA modified MWCNTs and PP-g-MA show a considerably higher extent of adhered polymer layer on its surface. This reflects the fact that modification of the MWCNTs and addition of a compatibilizer significantly enhance the interfacial interaction between MWCNT and the polymer chains.

Conclusion

We have demonstrated a facile and an effective method for the improved interfacial interaction between the MWCNT and the PP chains via the utilization of an organic modifier (Li-AHA) along with a compatibilizer (PP-g-MA). This technique could yield MWCNT with strongly adhered polymer chains on its surface. Various characterization techniques unequivocally support the presence of amorphous as well as crystallizable PP chains on the separated MWCNTs.

Acknowledgements

The authors would like to acknowledge SAIF and CRNTS. IIT Bombay, ‘Microcompounder’, ‘Broadband Dielectric Spectroscopy’ and ‘Solid State NMR’ Central Facilities at IIT Bombay.

References

  1. S. Iijima, Nature, 1991, 354, 56–58 CrossRef CAS.
  2. S. Ren, M. Bernardi, R. R. Lunt, V. Bulovic, J. C. Grossman and S. Gradečak, Nano Lett., 2011, 11, 5316–5321 CrossRef CAS PubMed.
  3. A. Bachtold, P. Hadley, T. Nakanishi and C. Dekker, Science, 2001, 294, 1317–1320 CrossRef CAS PubMed.
  4. A. Kasumov, R. Deblock, M. Kociak, B. Reulet, H. Bouchiat, I. Khodos, Y. B. Gorbatov, V. T. Volkov, C. Journet and M. Burghard, Science, 1999, 284, 1508–1511 CrossRef CAS PubMed.
  5. W. H. Shin, H. M. Jeong, B. G. Kim, J. K. Kang and J. W. Choi, Nano Lett., 2012, 12, 2283–2288 CrossRef CAS PubMed.
  6. B. J. Landi, M. J. Ganter, C. D. Cress, R. A. DiLeo and R. P. Raffaelle, Energy Environ. Sci., 2009, 2, 638–654 CAS.
  7. S. R. Sivakkumar, D. R. MacFarlane, M. Forsyth and D. W. Kim, J. Electrochem. Soc., 2007, 154, 834–838 CrossRef.
  8. C. Niu, E. Sichel, R. Hoch, D. Moy and H. Tennet, Appl. Phys. Lett., 1997, 70, 1480–1482 CrossRef CAS.
  9. V. N. Popov, Mater. Sci. Eng., R, 2004, 43, 61–102 CrossRef.
  10. C. Zhang, W. W. Tjiu, T. Liu, W. Y. Lui, I. Y. Phang and W. D. Zhang, J. Phys. Chem. B, 2011, 115, 3392–3399 CrossRef CAS PubMed.
  11. G. Che, B. B. Lakshmi, E. R. Fisher and C. R. Martin, Nature, 1998, 393, 346–349 CrossRef CAS.
  12. M. Cadek, J. N. Coleman, K. Ryan, V. Nicolosi, G. Bister, A. Fonseca, J. B. Nagy, K. Szostak, F. Beguin and W. J. Blau, Nano Lett., 2004, 4, 353–356 CrossRef CAS.
  13. M. J. Biercuk, M. C. Llaguno, M. Radosavljevic, J. K. Hyun, A. T. Johnson and J. E. Fischer, Appl. Phys. Lett., 2002, 80, 2767–2769 CrossRef CAS.
  14. P. M. Ajayan, L. S. Schadler, C. Giannaris and A. Rubio, Adv. Mater., 2000, 12, 750–753 CrossRef CAS.
  15. W. Yang, P. Thordarson, J. J. Gooding, S. P. Ringer and F. Braet, Nanotechnology, 2007, 18, 412001 CrossRef.
  16. M. Gallo, A. Favila and D. G. Mitnik, Chem. Phys. Lett., 2007, 447, 105–109 CrossRef CAS.
  17. Y. Feng, H. Zhang, Y. Hou, T. P. McNicholas, D. Yuan, S. Yang, L. Ding, W. Feng and J. Liu, ACS Nano, 2008, 2, 1634–1638 CrossRef CAS PubMed.
  18. Y. R. Shin, I. Y. Jeon and J. B. Baek, Carbon, 2012, 50, 1465–1476 CrossRef CAS.
  19. N. O. V. Plank, L. Jiang and R. Cheung, Appl. Phys. Lett., 2003, 83, 2426–2428 CrossRef CAS.
  20. A. Garg and S. B. Sinnott, Chem. Phys. Lett., 1998, 295, 273–278 CrossRef CAS.
  21. E. Bekyarova, M. E. Itkis, N. Cabrera, B. Zhao, A. P. Yu, J. B. Gao and R. C. Haddon, J. Am. Chem. Soc., 2005, 127, 5990–5995 CrossRef CAS PubMed.
  22. Y. L. Zhao and J. F. Stoddart, Acc. Chem. Res., 2009, 42, 1161–1171 CrossRef CAS PubMed.
  23. R. A. Khare, A. R. Bhattacharyya, A. S. Panwar, S. Bose and A. R. Kulkarni, Polym. Eng. Sci., 2011, 51, 1891–1905 CAS.
  24. D. Baskaran, J. W. Mays and M. S. Bratcher, Chem. Mater., 2005, 17, 3389–3397 CrossRef CAS.
  25. K. Subramaniam, A. Das and G. Heinrich, Compos. Sci. Technol., 2011, 71, 1441–1449 CrossRef CAS.
  26. T. Fukushima and T. Aida, Chem.–Eur. J., 2007, 13, 5048–5058 CrossRef CAS PubMed.
  27. B. I. Kharisov, O. V. Kharissova, H. L. Gutierrez and U. O. Méndez, Ind. Eng. Chem. Res., 2009, 48, 572–590 CrossRef CAS.
  28. C. M. Vaz, R. L. Reis and A. M. Cunha, Biomaterials, 2002, 23, 629–635 CrossRef CAS PubMed.
  29. M. J. O'Connell, P. Boul, L. M. Ericson, C. Huffman, Y. Wang, E. Haroz, C. Kuper, J. Tour, K. D. Ausman and R. E. Smalley, Chem. Phys. Lett., 2001, 342, 265–271 CrossRef.
  30. M. A. Correa-Duarte, N. Sobal, L. M. Liz-Marzan and M. Giersig, Adv. Mater., 2004, 16, 2179–2184 CrossRef CAS.
  31. M. Grzelczak, M. A. Correa-Duarte, V. Salgueirino-Maceira, M. Giersig, R. Diaz and L. M. Liz-Marzan, Adv. Mater., 2006, 18, 415–419 CrossRef CAS.
  32. S. Hrapovic, Y. L. Liu, K. B. Male and J. H. T. Luong, Anal. Chem., 2004, 76, 1083–1088 CrossRef CAS PubMed.
  33. K. Prashantha, J. Soulestin, M. F. Lacrampe, M. Claes, G. Dupin and P. Krawczak, eXPRESS Polym. Lett., 2008, 2, 735–745 CrossRef CAS.
  34. K. Gong, P. Yu, L. Su, S. Xiong and L. Mao, J. Phys. Chem. C, 2007, 111, 1882–1887 CAS.
  35. M. G. Zhang, A. Smith and W. Gorshi, Anal. Chem., 2004, 76, 5045–5050 CrossRef CAS PubMed.
  36. G. N. Ostojic, J. R. Ireland and M. C. Hersam, Langmuir, 2008, 24, 9784–9789 CrossRef CAS PubMed.
  37. S. K. Iyer and C. L. Raston, J. Mater. Chem., 2007, 17, 4872–4875 RSC.
  38. B. Z. Tang and H. Y. Xu, Macromolecules, 1999, 32, 2569–2576 CrossRef CAS.
  39. C. Y. Li, L. Y. Li, W. W. Cai, S. L. Kodjie and K. K. Tenneti, Adv. Mater., 2005, 17, 1198–1202 CrossRef CAS.
  40. L. Y. Li, C. Y. Li and C. Y. Ni, J. Am. Chem. Soc., 2006, 128, 1692–1699 CrossRef CAS PubMed.
  41. A. E. Hsiao, S. Y. Tsai, M. W. Hsu and S. J. Chang, Nanoscale Res. Lett., 2012, 7, 240–244 CrossRef PubMed.
  42. S. Roy, T. Das, C. Y. Yue and H. Xiao, ACS Appl. Mater. Interfaces, 2014, 6, 664–670 CAS.
  43. J. Zhu, H. Peng, F. Rodriguez-Macias, J. L. Margrave, V. N. Khabashesku, A. M. Imam, K. Lozano and E. V. Barrera, Adv. Funct. Mater., 2004, 14, 643–648 CrossRef CAS.
  44. R. A. Khare, A. R. Bhattacharyya and A. R. Kulkarni, J. Appl. Polym. Sci., 2011, 120, 2663–2672 CrossRef CAS.
  45. A. V. Poyekar, A. R. Bhattacharyya, A. S. Panwar, G. P. Simon and D. S. Sutar, ACS Appl. Mater. Interfaces, 2014, 6, 11054–11067 CAS.
  46. B. K. Satapathy, M. Ganß, R. Weidisch, P. Pötschke, D. Jehnichen, T. Keller and K. D. Jandt, Macromol. Rapid Commun., 2007, 28, 834–841 CrossRef CAS.
  47. S. Bose, A. R. Bhattacharyya, A. R. Kulkarni and P. Pötschke, Compos. Sci. Technol., 2009, 69, 365–372 CrossRef CAS.
  48. A. V. Poyekar, A. R. Bhattacharyya, R. A. Khare, A. S. Panwar, G. P. Simon, S. Dhar and J. K. Mishra, Polym. Eng. Sci., 2015, 55, 443–456 CAS.
  49. H. Xia, Q. Wang and G. Qiu, Chem. Mater., 2003, 15, 3879–3886 CrossRef CAS.
  50. S. Saito, Y. Moteki, M. Nakagawa, F. Horii and R. Kitamaru, Macromolecules, 1990, 23, 3256–3260 CrossRef CAS.
  51. S. H. P. Bettini and J. A. M. Agnelli, J. Appl. Polym. Sci., 2002, 85, 2706–2717 CrossRef CAS.
  52. M. Hasan, Org. Magn. Reson., 1980, 14, 447–450 CrossRef.
  53. S. Yesil and G. Bayram, Polym. Eng. Sci., 2011, 51, 1286–1300 CAS.
  54. C. S. Wu, J. Appl. Polym. Sci., 2007, 104, 1328–1337 CrossRef CAS.
  55. X. Li, L. Yang and D. Liu, Adv. Mater. Res., 2012, 476, 2223–2226 CrossRef.
  56. G. W. Lee, S. Jagannathan, H. G. Chae, M. L. Minus and S. Kuma, Polymer, 2008, 49, 1831–1840 CrossRef CAS.
  57. J. Zheng, Z. Zhu, J. Qi, Z. Zhou, P. Li and M. Peng, J. Mater. Sci., 2011, 46, 648–658 CrossRef CAS.
  58. B. C. Smith, Infrared Spectral Interpretation: A Systematic Approach, CRC Press, USA, 1999 Search PubMed.
  59. M. S. Sreekanth, A. S. Panwar, P. Pötschke and A. R. Bhattacharyya, Phys. Chem. Chem. Phys., 2015, 17, 9410–9419 RSC.
  60. M. Mucha and Z. Krolikowski, J. Therm. Anal. Calorim., 2003, 74, 549–557 CrossRef CAS.
  61. S. H. Park, S. G. Lee and S. H. Kim, Composites, Part A, 2013, 46, 11–18 CrossRef CAS.
  62. Q. Zhao and H. D. Wagner, Philos. Trans. R. Soc., A, 2004, 362, 2407–2424 CrossRef CAS PubMed.
  63. L. Bokobza and J. Zhang, Express Polym. Lett., 2012, 6, 601–608 CrossRef CAS.
  64. G. Gorrasi, M. Sarno, A. D. Bartolomeo, D. Sannino, P. Ciambelli and V. Vittoria, J. Polym. Sci., Part B: Polym. Phys., 2007, 45, 597–606 CrossRef CAS.
  65. S. S. Strano, V. C. Moore, M. K. Miller, M. J. Allen, E. H. Haroz, C. Kittrell, R. H. Hauge and R. E. Smalley, J. Nanosci. Nanotechnol., 2003, 3, 81–86 CrossRef PubMed.
  66. S. Bose, A. R. Bhattacharyya, R. A. Khare, A. R. Kulkarni, U. Patro and P. Sivaraman, Nanotechnology, 2008, 19, 335704 CrossRef PubMed.
  67. H. X. Wu, X. Q. Qiu, W. M. Cao, Y. H. Lin, R. F. Cai and S. X. Qian, Carbon, 2007, 45, 2866–2872 CrossRef CAS.
  68. C. G. Robertson, C. J. Lin, M. Rackaitis and C. M. Roland, Macromolecules, 2008, 41, 2727–2731 CrossRef CAS.
  69. M. Mortezaei, Compos. Sci. Technol., 2011, 71, 1039–1045 CrossRef CAS.
  70. S. Zhang, M. L. Minus, L. Zhu, C. P. Wong and S. Kumar, Polymer, 2008, 49, 1356–1364 CrossRef CAS.
  71. D. H. Marsh, G. A. Rance, M. H. Zaka, R. J. Whitby and A. N. Khlobystov, Phys. Chem. Chem. Phys., 2007, 9, 5490–5496 RSC.
  72. K. Norrish and R. M. Taylor, Clay. miner. bull., 1962, 5, 98–109 CAS.

Footnote

Electronic supplementary information (ESI) available. See DOI: 10.1039/c6ra06258j

This journal is © The Royal Society of Chemistry 2016