
Fluorescent carbon dots from milk by microwave cooking†
Dan Wangab,
Lin Zhuc,
Christopher Mccleesed,
Clemens Burdad,
Jian-Feng Chen*a and
Liming Dai*b
aState Key Laboratory of Organic-Inorganic Composites, Beijing University of Chemical Technology, Beijing 100029, China. E-mail: chenjf@mail.buct.edu.cn
bCenter of Advanced Science and Engineering for Carbon (Case4Carbon), Department of Macromolecular Science and Engineering, Case Western Reserve University, Cleveland, OH 44106, USA. E-mail: liming.dai@case.edu
cInstitute of Advanced Materials for Nano-bio Applications, School of Ophthalmology and Optometry, Wenzhou Medical University, 270 Xueyuan Xi Road, Wenzhou, Zhejiang, China
dCenter for Chemical Dynamics and Nanomaterials Research, Department of Chemistry, Case Western Reserve University, Cleveland, OH 44106, USA
First published on 15th April 2016
Abstract
Milk, containing carbohydrates and proteins, is one of the most popular sources of nutrition for human beings. Along with others, we have recently found that milk can also be used as a carbon source for the synthesis of carbon quantum dots. Here, we report the formation of nanometre-sized, highly-fluorescent, nitrogen-doped carbon dots from milk by microwave cooking. Carbon dots thus produced are well dispersed in aqueous solution, and could be easily taken up by HeLa cells without additional surface functionalization. The distribution of carbon dots in cells is confirmed by two-photon excited fluorescence intensity imaging and fluorescence lifetime imaging. Fortunately, no significant cytotoxicity of the milk-derived carbon dots was observed while the strong fluorescence makes them potentially useful for biomedical imaging and many other applications.
Introduction
Milk is an emulsion or colloid of butterfat globules within a water-based fluid that contains dissolved carbohydrates and protein aggregates with minerals (ESI Table S1†).1 People around the world use milk from animals (e.g., cattle, sheep) as a food product every day. Hundreds of millions of tonnes of milk are produced throughout the world every year, from which many food additives and products, such as cream, butter, casein, and whey protein, are produced by modern industrial processes.Apart from the use of milk for the long-term, large-scale production of customary dairy products, only a few of recent studies have demonstrated that carbon dots (CDs) could be synthesized from milk via hydrothermal treatment.2,3 Compared with conversional fluorescent semiconductor quantum dots4,5 and organic dye-based nanoparticles,6–8 CDs, as new fluorescent nanoparticles, offer multiple advantages, such as good biocompatibility and better photostability.9–11 Consequently, CDs have been shown to be useful for various potential applications, including light emitting diodes,12,13 organic photovoltaic devices,14–16 biological fluorescent labels,17–22 electroluminescence,23 and catalysis.24,25 Many studies on the synthesis of fluorescent CDs under a variety of conditions have been reported, ranging from simple candle burning to in situ dehydration reactions and laser ablation methods.26
For bio-related applications (e.g., biomedical imaging), the synthesis of fluorescent CDs from biocompatible ‘natural’ material, such as milk, is interesting. We found that highly-fluorescent, nitrogen-doped CDs can be produced by microwave cooking of milk, in a way much like the everyday cooking to make milk drinks in our kitchen. Compared with the hydrothermal treatment of milk to produce CDs reported previously, the use of microwave cooking could not only significantly simplify the synthetic process but also point out the urgency for ascertaining the potential hazards of microwave-cooked milk to humans. In the present work, we investigated the possible reaction pathways from milk to CDs by microwave cooking. We studied the structure, optical properties, and cytotoxicity of the resultant CDs. The distribution of the CDs in HeLa cells is confirmed by both two-photon excited fluorescence imaging and fluorescence lifetime imaging. Fortunately, no significant cytotoxicity of the milk-derived carbon dots was observed, which provided assurance for our daily consumption of milk drinks cooked by microwave ovens. The results of this study also provide support for the use of milk-derived CDs as biocompatible fluorescent labels for biomedical imaging.
Experimental
Synthesis of CDs
The milk used in this work was purchased from the supermarket and the nutrition information of the milk was presented in Table S1.† For a typical synthesis of CDs from milk, a 500 mL glass cup containing 1 mL of milk was subjected to microwave irradiation in a microwave oven at high level (Panasonic NN-SD 762S, output power: 1250 W) for a predetermined time (30 s, 60 s, 90 s, 120 s and 150 s, respectively). During the microwave heating, water in the milk was evaporated and the dry milk solids were then carbonized, forming brown solid mass. Thereafter, the final product was allowed to cool down at room temperature and was collected for further characterization.Characterization of CDs
A PerkinElmer LS 55 Fluorescence spectrometer was used to measure the excitation and photoluminescence spectra of aqueous solutions of the samples. For the measurement of time-resolved photoluminescence decay curves, the samples were excited at 390 nm and monitored at 450 nm. A PerkinElmer spectrum GX FTIR system was used to record the FTIR spectra of solid samples. XPS measurements were carried out on a VG Microtech ESCA 2000 using a monochromic Al X-ray source. The TGA was performed on a TA Instruments with a heating rate of 10 °C. TEM images were taken by a JEOL JEM-1230 transmission electron microscope operating at 160 kV in bright-field mode.Cell viability experiments
For MTT (3-(4,5-dimethylthiazol-2-yl)-2,5-diphenyl tetrazolium bromide) measurements, 96 wells of HeLa cells were prepared, containing about 6000 cells in each well. The cells were randomly separated to three groups. Two groups were separately treated with milk and CDs at a concentration of 50, 100, 150, and 200 μg mL−1, respectively. Another group of cells were blank control cell lines without any treatment. After incubation at 37 °C under 5% CO2 for 24 h, the 15 μL of MTT was added to each well and the cells were incubated for another 2 h. The absorbance of formazan was measured at 490 nm. The cell viability of control cells was assumed as 100%, and the relative viability of cells treated with various samples was estimated. The whole experiment was repeated 3 times.In vitro fluorescence imaging
HeLa cells were cultured in a Dulbecco's minimum essential media (DMEM/f12) with 10% fetal bovine serum (FBS), 1% penicillin, and 1% amphotericin B. For fluorescence imaging, cells were treated with nothing and CDs (200 μg mL−1), respectively. The cells were then incubated at 37 °C with 5% CO2 for 2 h. Thereafter, all the cell samples were gently washed three times with PBS (pH = 7.4, 10 mM) and directly imaged with a two-photon excited fluorescence microscope by using an 800 nm femtosecond laser irradiation. A time-correlated single photon counting (TCSPC) system was coupled with the two-photon excited fluorescence microscope for fluorescence lifetime imaging.Results and discussion
It is well-known that milk contains water, proteins, sugars, and a few minerals (ESI Table S1†). Fig. 1 illustrates the possible process for the formation of CDs by microwave cooking of milk. Microwave heating caused protein denaturation to unravel amino acids, which, otherwise, might have been folded within the three-dimensional (3D) domains of the protein chain.27,28 CDs then formed following the carbonization of denatured protein and sugars, similar to previously reported microwave mediated pyrolysis process for the synthesis of carbon nanodots by using citric acid as the carbon source.9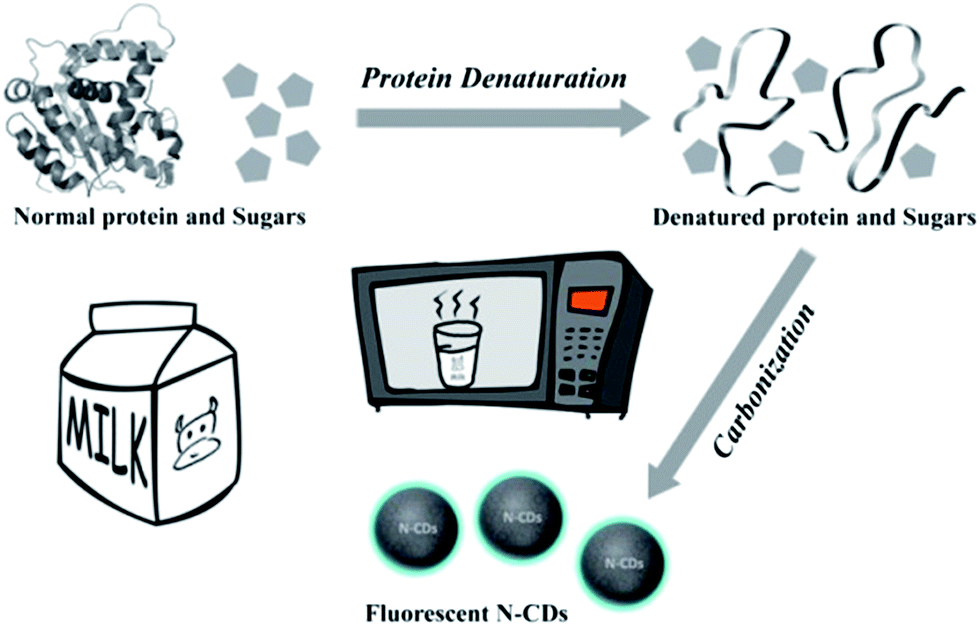 | ||
| Fig. 1 A schematic diagram for the preparation of fluorescent, nitrogen-doped carbon dots (N-CDs) from milk by microwave cooking. | ||
Using a digital infrared thermometer, we measured the temperature changes of the reactor with milk during microwave-heating (Fig. S1†). There are two linear relationships between the temperature and heating time over 0–60 s and 90–150 s, respectively. The appearance of a temperature transition over the time range of 60–90 s, is resulted from the evaporation of water around 100 °C. Fig. 2a shows survey spectra from X-ray photoelectron spectroscopic (XPS) measurements on the milk samples before (black curve) and after microwave heating for 120 s (red curve). As expected, the dried milk sample without microwave cooking (0 s) consists of aggregates of the 3D protein and sugar domains, leading to a low nitrogen content on the sample surface as reflected by the XPS N1s peak intensity (Fig. 2a, black line). In contrast, the corresponding XPS survey spectrum of the milk sample after being heated for 120 s shows a much higher XPS N1s and O1s peak intensities (Fig. 2a, red line) due to the thermally-induced protein denaturation to expose amino groups (vide supra). Numerical results from the XPS analyses are listed in Table S2,† which shows that the heating treatment caused the nitrogen content to increase from 2% for the pristine milk to 9.3% for the milk after microwave cooking for 120 s and a concomitant increase in the O/C atomic ratio due to the denaturation-induced exposure of amino acids (vide supra). It was also noted that some brown solid mass was observed in the milk after microwave cooking for longer than 30 s and 120 s microwave cooking turned the starting material into dark brown (Fig. S2†), indicating the occurrence of carbonization. Prolonged microwave cooking (say, >150 s) could cause carbon oxidization by air, and hence a further increased O/C atomic ratio (Fig. 2b). Fourier transform infrared (FTIR) spectra of the samples (Fig. 2c) show the presence of aromatic amine, hydroxyl, and carboxyl groups. Detailed chemical nature of C and N in the CDs (120 s) could be further elucidated by the curve-fitted XPS N1s (Fig. 2d) and C1s (Fig. 2e) spectra, which clearly show the peaks of sp2 graphitic C (284.3 eV), sp3 graphitic C (284.9 eV), and C–N (285.7 eV), along with many other chemical bonds indicated by those labels in the figures.24
 | ||
| Fig. 2 (a) XPS spectra of the milk without heating (0 s, black line) and with heating treatment (120 s, red line); composition (b) and FTIR (c) spectra of various milk samples with different microwave cooking times (0 s, 30 s, 60 s, 90 s, 120 s, 150 s, respectively); high-resolution C1s (d) and N1s (e) peaks of as-prepared CDs (120 s); (f) TGA curves of various microwave-cooked milk samples in air. | ||
Oxidative thermal gravimetric analyses (TGA) of the milk samples microwave cooked for different times were performed. As shown in Fig. 2f, the initial weight loss for all the samples heated up to ∼200 °C was associated with the thermal desorption of water molecules and decomposition of certain oxygen-containing groups.29,30 Below 200 °C, the milk samples prepared by microwave cooking for a longer heating time (90 s, 120 s, 150 s) show a smaller weight loss than that of their counterparts obtained by shorter microwave heating (0 s, 30 s, 60 s). These results demonstrated that the dehydration of the milk samples during their preparation increased as the microwave heating time increased. All the samples have similar residuals of about (8 wt%) after complete oxidative decomposition of the carbon materials up to 800 °C. We attribute the residuals to minerals in the milk, which remain even after the microwave cooking and thermal gravimetric analysis.
The formation of CDs from milk under microwave cooking was also monitored by fluorescence measurements. Fig. 3 shows the excitation-emission maps of various milk samples with different microwave cooking times (0 s, 30 s, 60 s, 90 s, 120 s, 150 s). For the samples with short microwave-cooking times (0 s, 30 s, 60 s), intense emission was observed in the range of 300–400 nm with a maximum excitation of ∼280 nm, which was attributed to the fluorescence of amino acids in the proteins.31,32 As the microwave-cooking time increased (90 s, 120 s, 150 s), however, the emission peak gradually red-shift to 400–500 nm and became intense, attributable to the fluorescence of CDs. These results demonstrate the formation of CDs with increasing the microwave cooking time.
 | ||
| Fig. 3 Fluorescence excitation–emission maps of milk samples prepared at various microwave-cooking times. (a) 0 s, (b) 30 s, (c) 60 s, (d) 90 s, (e) 120 s, (f) 150 s. Two trains of strong signals indicated by dashed white lines are due to scattering of excitation light and its second order. | ||
Fig. 4 shows the time-resolved photoluminescence decay for various milk samples in aqueous solutions. All the samples were excited using 390 nm fs laser and the fluorescence was monitored at 450 nm. The mean lifetimes for all of the samples investigated are calculated and summarized in Table S3.† As can be seen, the pristine milk solution possesses the longest lifetime of about 7 ns, probably arising from the protein aggregates with autofluorescence of long fluorescence lifetime (such as casein).33 For the sample after microwave cooking for 30 s, a much shorter fluorescence lifetime (about 1 ns) was observed, which might come from the autofluorescence of amino acids. As the microwave-cooking time increased, the fluorescence time of the microwave-cooked samples increased up to about 5 ns, which is comparable to that of reported for most carbon dots.34–36 These results indicate that the photoluminescence of the CDs generated by microwave cooking is resulted from radiative change carrier recombination.37,38
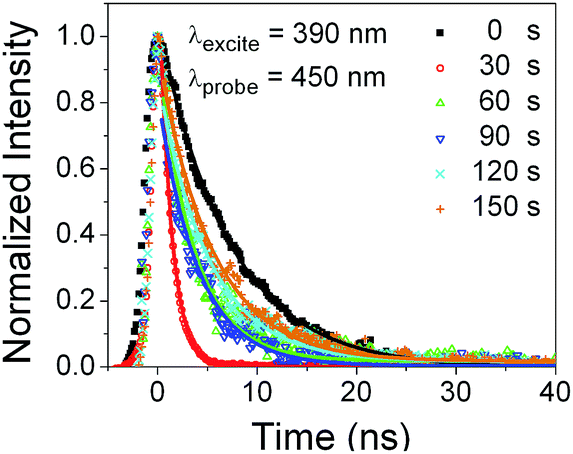 | ||
| Fig. 4 Time-resolved photoluminescence decay curves (symbols) and their fits (lines) for various samples in aqueous solutions. All the samples were excited at 390 nm and monitored at 450 nm. | ||
The morphology of the CDs generated by microwave cooking of milk was studied using transmission electron microscope (TEM). Fig. S3† reproduces a typical TEM image from six microwave-cooked milk samples (0 s, 30 s, 60 s, 90 s, 120 s, and 150 s), showing a typical morphology for aggregates of carbohydrates and proteins in the milk. To characterize the morphology and size distribution for CDs, the solution of the milk samples was filtered by a 0.22 μm membrane to remove the large carbohydrate/protein aggregates. Fig. 5a shows a typical TEM image for the resultant nanosized CDs, showing spherical dots with a size distribution between 1 and 7 nm (Fig. S4†). Similar size distributions were observed for CDs obtained from various samples with different microwave cooking times. However, the amount of the fluorescent CDs thus formed increased with increasing microwave-cooking time, as reflected by the solution fluorescence intensities shown in Fig. S5 and S6.† Polyacrylamide gel electrophoresis (PAGE) study was performed to measure the molecular weights of CDs, by using Pierce™ Prestained Protein MW Marker (Thermo Fisher Scientific, Fig. S7†) as the marker and following the manufactures protocol. The result shows the molecular weights of CDs were less than 20 kDa (Fig. 5b). The hydrodynamic size of the CDs was also measured by dynamic light scattering (DLS), which shows a number average diameter of about 3 nm (Fig. 5c) in a good agreement with the TEM measurements (Fig. S4†).
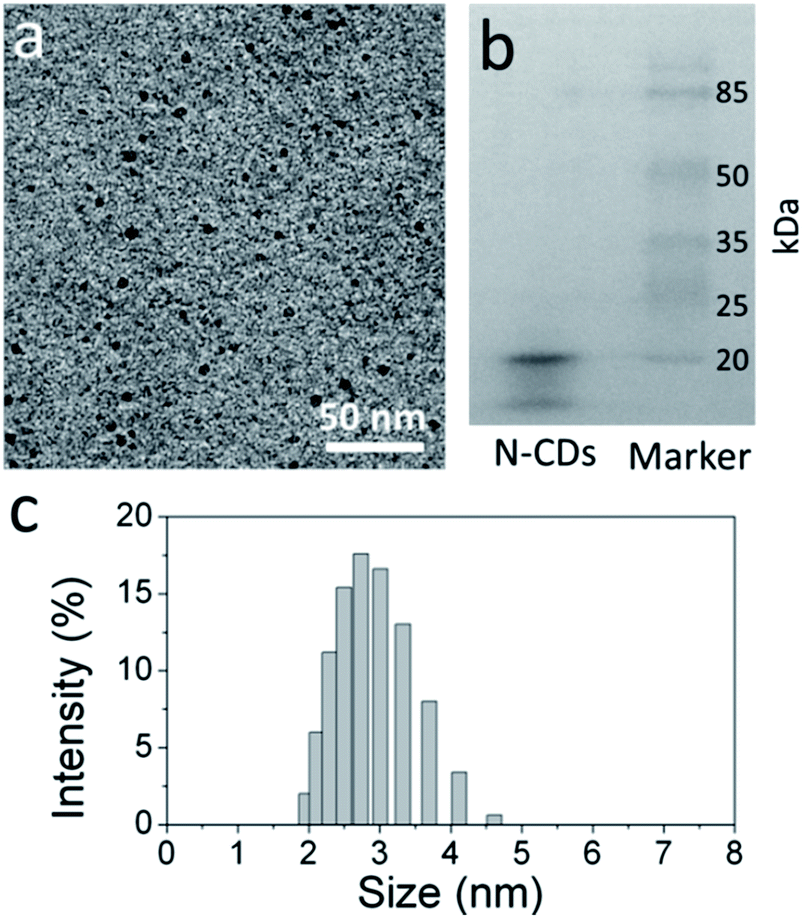 | ||
| Fig. 5 (a) A typical TEM image of CDs; (b) PAGE and (c) DLS measurements of CDs. | ||
Fig. S7a† represents a high resolution transmission electron microscope (HR-TEM) image of CDs from milk after microwave cooking for 150 s, which hardly shows any crystal lattice for the CDs. Because of the low degree carbonization, these CDs are also sensitive to the electron beam irradiation damage;39 some of the nanodots shown in Fig. S8a disappeared in Fig. S8b.† The photostability of the CDs was investigated by monitoring the photoluminescence intensity of the CDs dispersions under continuous ultraviolet irradiation (365 nm UV lamp). The results in Fig. S9† reveal that CDs maintained over 90% of photoluminescence intensity after continuous UV irradiation for up to 60 min. Although the low carbonization degree of the CDs led to a relatively poor material stability (particularly, under the electron beam irradiation), it could have a positive effect on the biocompatibility,40,41 which, coupled with the sufficiently strong fluorescence intensity, should make the CDs attractive for biomedical imaging and other bio-related applications.
In order to ensure CDs for potential bio-related applications, we performed the biocompatibility assessment of CDs. According to many previous reports on the uptake of nanoparticles by cells,42–45 the nanosized CDs should be small enough to have minimal disturbance of normal cellular physiology, attractive for studies on the cytotoxicity and distribution of CDs in cells. The cytotoxicity of the CDs was investigated by a typical MTT method. Fig. 6 shows the relative cell viability for cells treated with different concentrations of milk and the milk-derived CDs. The incubation time of CDs with cells is 24 h in our experiments. We can see that no significant cytotoxicity of cells was caused by either milk or microwave-cooked CDs with concentrations of the CDs up to 200 μg mL−1.
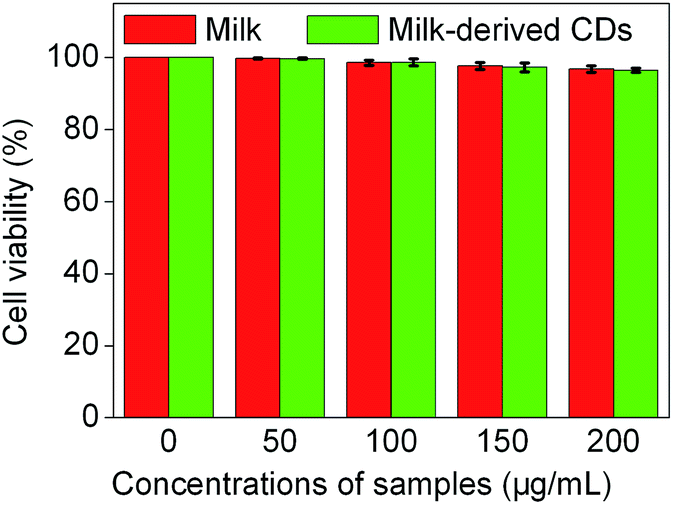 | ||
| Fig. 6 MTT assays illustrating relative cell viability with different concentrations of samples (milk and milk-derived CDs) for 24 h. | ||
To investigate the distribution of CDs in the HeLa cells, in vitro two-photon excited fluorescence imaging was performed. Fig. 7a and b show the images of control cells (without the CD treatment) and experimental cells (incubated with 200 μg mL−1 CDs for 2 h), respectively. The bright-field images show that the morphologies of all the cells kept very well, and they were viable after the CD treatment, and that the CDs did not cause significant toxicity to the cells. The fluorescence images illustrated that two-photon excited fluorescence of CDs could be clearly observed from the cytoplasm of the cells. Since the cells were irradiated by 800 nm femtosecond laser for fluorescence imaging, no autofluorescence of the cells was detected. A two-photon excited 3D fluorescence image (Fig. 7c) shows the distinct distribution of CDs inside the cells.
 | ||
| Fig. 7 Two-photon excited fluorescence intensity imaging of HeLa cells. (a) Control cells without the CD treatment; (b) cells incubated with 200 μg mL−1 CDs for 2 h; (c) a reconstructed 3D image of z-direction scanned images of one cells in (b). The scale bar is 50 μm. | ||
In addition to the in vitro two-photon excited fluorescence imaging, we also performed fluorescence lifetime imaging (FLIM) of the CDs in living cells. Fig. 8 reveals that the average fluorescence lifetime of CDs inside cells was about 1.4 ns, which is much shorter than that of the fluorescence lifetime of CDs observed in aqueous solution (about 5 ns, cf. Fig. 4). These results demonstrate the complex cellular environment has some effects on the fluorescence of CDs.
 | ||
| Fig. 8 Two-photon excited fluorescence lifetime imaging of HeLa cells. (a) Control cells without the CD treatment; (b) cells incubated with 200 μg mL−1 CDs for 2 h. The scale bar is 50 μm. | ||
Conclusions
We have for the first time used microwave cooking to prepare CDs from milk. Upon high level microwave irradiation, proteins in milk were denatured to form aggregates with sugars, followed by in situ carbonization to produce aqueous soluble CDs. The resultant CDs, with an average size around 4 nm and molecular weight of less than 20 kDa, exhibited bright excitation-dependent emission in the range of 400 to 500 nm. These CDs could be easily taken up by cells and mainly distributed in the cytoplasm of the cells. However, no significant cytotoxicity of CDs to the cells was observed. The fluorescence lifetime imaging of cells revealed a much shorter fluorescence lifetime in cells than that measured in in vitro. Carbon dots thus produced are soluble in aqueous solution, and could be easily taken up by HeLa cells without additional surface functionalization. The distribution of carbon dots in cells are confirmed by two-photon excited fluorescence intensity imaging and fluorescence lifetime imaging. The good biocompatibility and strong fluorescence make the CDs potentially useful for biomedical imaging and many other applications.Acknowledgements
We are grateful for financial support from WMU-CWRU (SPN2330), NSF (CMMI-1266295), and partial support from the open-funding program of the State Key Laboratory of Organic-Inorganic Composites, the Fundamental Research Funds for the Central Universities, and the “111” project of China (B14004).Notes and references
- H.-D. Belitz, W. Grosch, and P. Schieberle, Milk and dairy products, in Food Chemistry, ed. H.-D. Belitz, W. Grosch and P. Schieberle, Springer, Berlin, 3rd edn, 2004, pp. 505–550 Search PubMed.
- L. Wang and H. S. Zhou, Anal. Chem., 2014, 86, 8902–8905 CrossRef CAS PubMed.
- D. Wang, X. Wang, Y. Guo, W. Liu and W. Qin, RSC Adv., 2014, 4, 51658–51665 RSC.
- K. T. Yong, W. C. Law, R. Hu, L. Ye, L. W. Liu, M. T. Swihart and P. N. Prasad, Chem. Soc. Rev., 2013, 42, 1236–1250 RSC.
- D. Wang, J. Qian, F. Cai, S. He, S. Han and Y. Mu, Nanotechnology, 2012, 23, 245701 CrossRef CAS PubMed.
- K. Li and B. Liu, Chem. Soc. Rev., 2014, 43, 6570–6597 RSC.
- D. Wang, J. Qian, S. He, J. S. Park, K.-S. Lee, S. Han and Y. Mu, Biomaterials, 2011, 32, 5880–5888 CrossRef CAS PubMed.
- D. Wang, J. Qian, W. Qin, A. Qin, B. Z. Tang and S. He, Sci. Rep., 2014, 4, 4279 Search PubMed.
- X. Zhai, P. Zhang, C. Liu, T. Bai, W. Li, L. Dai and W. Liu, Chem. Commun., 2012, 48, 7955–7957 RSC.
- P. Miao, K. Han, Y. Tang, B. Wang, T. Lin and W. Cheng, Nanoscale, 2015, 7, 1586–1595 RSC.
- D. Wang, J. Liu, J.-F. Chen and L. Dai, Adv. Mater. Interfaces, 2016, 3, 1500439 Search PubMed.
- X. Zhang, Y. Zhang, Y. Wang, S. Kalytchuk, S. V. Kershaw, Y. Wang, P. Wang, T. Zhang, Y. Zhao, H. Zhang, T. Cui, Y. Wang, J. Zhao, W. W. Yu and A. L. Rogach, ACS Nano, 2013, 7, 11234–11241 CrossRef CAS PubMed.
- X. Guo, C. F. Wang, Z. Y. Yu, L. Chen and S. Chen, Chem. Commun., 2012, 48, 2692–2694 RSC.
- P. Mirtchev, E. J. Henderson, N. Soheilnia, C. M. Yipc and G. A. Ozin, J. Mater. Chem., 2012, 22, 1265–1269 RSC.
- Y. Li, Y. Hu, Y. Zhao, G. Shi, L. Deng, Y. Hou and L. Qu, Adv. Mater., 2011, 23, 776–780 CrossRef CAS PubMed.
- V. Gupta, N. Chaudhary, R. Srivastava, G. D. Sharma, R. Bhardwaj and S. Chand, J. Am. Chem. Soc., 2011, 133, 9960–9963 CrossRef CAS PubMed.
- L. Yang, W. Jiang, L. Qiu, X. Jiang, D. Zuo, D. Wang and L. Yang, Nanoscale, 2015, 7, 6104–6113 RSC.
- L. Cao, X. Wang, M. J. Meziani, F. Lu, H. Wang, P. G. Luo, Y. Lin, B. A. Harruff, L. M. Veca, D. Murray, S.-Y. Xie and Y.-P. Sun, J. Am. Chem. Soc., 2007, 129, 11318–11319 CrossRef CAS PubMed.
- P. G. Luo, S. Sahu, S. T. Yang, S. K. Sonkar, J. P. Wang, H. F. Wang, G. E. LeCroy, L. Cao and Y. P. Sun, J. Mater. Chem. B, 2013, 1, 2116–2127 RSC.
- J. Ge, M. Lan, B. Zhou, W. Liu, L. Guo, H. Wang, Q. Jia, G. Niu, X. Huang, H. Zhou, X. Meng, P. Wang, C.-S. Lee, W. Zhang and X. Han, Nat. Commun., 2014, 5, 4596 CAS.
- D. Wang, J.-F. Chen and L. Dai, Part. Part. Syst. Charact., 2015, 5, 515–523 CrossRef.
- D. Stefanakis, A. Philippidis, L. Sygellou, G. Filippidis, D. Ghanotakis and D. Anglos, J. Nanopart. Res., 2014, 16, 2646 CrossRef.
- L. L. Li, J. Ji, R. Fei, C. Z. Wang, Q. Lu, J. R. Zhang, L. P. Jiang and J. J. Zhu, Adv. Funct. Mater., 2012, 22, 2971–2979 CrossRef CAS.
- Y. Li, Y. Zhao, H. Cheng, Y. Hu, G. Shi, L. Dai and L. Qu, J. Am. Chem. Soc., 2011, 134, 15–18 CrossRef PubMed.
- H. Li, X. He, Z. Kang, H. Huang, Y. Liu, J. Liu, S. Lian, C. H. A. Tsang, X. Yang and S. T. Lee, Angew. Chem., Int. Ed., 2010, 49, 4430–4434 CrossRef CAS PubMed.
- S. N. Baker and G. A. Baker, Angew. Chem., Int. Ed., 2010, 49, 6726–6744 CrossRef CAS PubMed.
- M. A. J. S. van Boekel, Effect of heating on Maillard reactions in milk, Food Chem., 1998, 62, 403–418 CrossRef CAS.
- P. X. Qi, E. M. Brown and H. M. Farrell Jr., Trends Food Sci. Technol., 2001, 12, 339–346 CrossRef.
- A. B. Bourlinos, R. Zbořil, J. Petr, A. Bakandritsos, M. Krysmann and E. P. Giannelis, Chem. Mater., 2012, 24, 6–8 CrossRef CAS.
- K. Qu, J. Wang, J. Ren and X. Qu, Chem.–Eur. J., 2013, 19, 7243–7249 CrossRef CAS PubMed.
- F. W. Teale and G. Weber, Biochem. J., 1957, 65, 476–482 CrossRef CAS PubMed.
- O. Tcherkasskaya, V. E. Bychkova, V. N. Uversky and A. M. Gronenborn, J. Biol. Chem., 2000, 46, 36285–36294 CrossRef PubMed.
- S. Kaminogawa, K. Koide and K. Yamauchi, Agric. Biol. Chem., 1975, 39, 533–539 CAS.
- J. Wang, C. F. Wang and S. Chen, Angew. Chem., Int. Ed., 2012, 51, 9297–9301 CrossRef CAS PubMed.
- Q. Liang, W. Ma, Y. Shi, Z. Li and X. Yang, Carbon, 2013, 60, 421–428 CrossRef CAS.
- Z. L. Wu, P. Zhang, M. X. Gao, C. F. Liu, W. Wang, F. Leng and C. Z. Huang, J. Mater. Chem. B, 2013, 1, 2868–2873 RSC.
- X. Wang, L. Cao, F. Lu, M. J. Meziani, H. Li, G. Qi, B. Zhou, B. A. Harruff and Y.-P. Sun, Chem. Commun., 2009, 3774–3776 RSC.
- Y.-P. Sun, B. Zhou, Y. Lin, W. Wang, K. A. S. Fernando, P. Pathak, M. J. Meziani, B. A. Harruff, X. Wang, H. F. Wang, P. J. G. Luo, H. Yang, M. E. Kose, B. Chen, L. M. Veca and S. Y. Xie, J. Am. Chem. Soc., 2006, 128, 7756–7757 CrossRef CAS PubMed.
- Y. Sun, A. G. Chmielewski, J. Licki, S. Bułka and Z. Zimek, Radiat. Phys. Chem., 2009, 78, 721–723 CrossRef CAS.
- A. M. Schrand, J. Johnson, L. Dai, S. M. Hussain, J. J. Schlager, L. Zhu, Y. Hong, and E. Ōsawa, Cytotoxicity and genotoxicity of carbon nanomaterials, in Safety of Nanoparticles, ed. T. J. Webster, Springer, New York, 2009, pp. 159–187 Search PubMed.
- Y. Xing and L. Dai, Nanomedicine, 2009, 4, 207–218 CrossRef CAS PubMed.
- J. Qian, D. Wang, F. Cai, Q. Zhan, Y. Wang and S. He, Biomaterials, 2012, 33, 4851–4860 CrossRef CAS PubMed.
- Y. Cheng, A. C. Samia, J. D. Meyers, I. Panagopoulos, B. W. Fei and C. Burda, J. Am. Chem. Soc., 2008, 130, 10643–10647 CrossRef CAS PubMed.
- D. Wang, L. Zhu, J.-F. Chen and L. Dai, Nanoscale, 2015, 7, 9894–9901 RSC.
- J.-L. Li, H.-C. Bao, X.-L. Hou, L. Sun, X.-G. Wang and M. Gu, Angew. Chem., Int. Ed., 2012, 51, 1830–1834 CrossRef CAS PubMed.
Footnote |
| † Electronic supplementary information (ESI) available. See DOI: 10.1039/c6ra06120f |
| This journal is © The Royal Society of Chemistry 2016 |