
Epoxy/graphene oxide/liquid polysulfide ternary nano-composites: rheological, thermal and mechanical, characterization
Matin Golshani Nasab and
Mohammadreza Kalaee*
Department of Polymer Engineering, Islamic Azad University, South Tehran Branch, Tehran, Iran. E-mail: mohammad.kalaee@gmail.com; mr_kalaee@azad.ac.ir
First published on 4th May 2016
Abstract
Despite its functionality, one major drawback associated with cured epoxy resin is its brittle nature. In order to overcome this problem, liquid polysulfide (PSf) and graphene oxide (GO) were incorporated into an epoxy resin. The current study investigates the effect of the weight fraction of PSf (20%, 33%, and 50%) on the glass transition temperature (Tg), thermal stability, rheological, and mechanical properties of epoxy/GO/PSf ternary nano-composites. The weight fraction of GO was kept constant and set at 0.1% to confirm the percolation threshold. The rheological measurements demonstrated that as the amount of PSf is increased in an uncured sample, the strength of the network is increased, too. Differential scanning calorimetry revealed that phase separation occurred during curing of the epoxy resin in a way that three different regions were detected. The X-ray diffraction peak proved that the d-spacing between GO sheets was increased to 16.68 Å at 50% PSf loading. The tensile strength of the nano-composites followed a descending trend vs. PSf content. However, the sample containing 50% PSf scored the highest fracture value. This was correlated to a plasticizing effect of PSf on the cured epoxy. Finally, thermogravimetric analysis showed that degradation occurred faster and at lower temperature as the amount of PSf increased.
1. Introduction
Epoxy resins are one of the most functional materials widely employed in industrial applications due to their superior properties such as high tensile strength and Young's modulus. Despite these, one crucial drawback of a cured epoxy resin is its very low brittleness coming from a high degree of crosslinking which may restrict its applicability.1–4 In other words, cured epoxy suffers from low resistance of the material against crack growth resulting in low fracture energy.5–8 Various methods have been used for modification of cured epoxy on the basis of toughening to overcome this problem.5,9–11 The most common method is inclusion of a rubber-like material into the epoxy matrix as soft phase which is responsible for toughening. Some materials investigated for this purpose are carboxyl-terminated butadiene-acrylonitrile rubbers,2 acrylonitrile-butadiene rubbers,3 polysulfone,12 poly(ethersulfone)13 and poly(aryl ether ketone).14Liquid polysulfide (PSf), a split form of high molecular weight latex into resins, has been recognized as a suitable option for toughening epoxy resin due to its facile mixing in the epoxy resin and superb physical properties. The epoxy/PSf composite featured high impact strength, dimensional stability, and resistance to solvent and ozone.4,15,16 Wilford et al. investigated epoxy/polysulfide systems and found that mechanical properties such as adhesion, peel strength, and durability of composite can be promoted by modifying polysulfide resin and its phase separation from cured epoxy matrix.17 The presence of discrete rubber phase in epoxy/polysulfide system was also elaborated by some other researchers.18 Abdouss et al. have indicated that as the amount of polysulfide in the epoxy/polysulfide composite increased, elongation at break increased as well. However, there was a reduction in tensile strength for the sake of reduction in crosslink density (CLD).19
Toughening of epoxy by incorporating different types of rubbers can improve energy dissipating mechanism of composite when an external load is applied. It has been found that by lowering CLD of epoxy in an epoxy/rubber composite young modulus and/or tensile strength is declined.12,19 Introducing micro and/or nanoparticle into epoxy/polysulfide matrix can reinforce the aforementioned mechanical properties.20,21 Some nanomaterials chosen for this aim are: silica,22 carbon nanotube,23 graphite,24 clay,25 graphene and graphene oxide.26,27
Graphene oxide (GO), an oxidized form of graphene sheet with thickness of almost 1 nm has been the center of attention among many scientists since its discovery. GO has been identified as an amphiphilic material in which both hydrophobic and hydrophilic sites are available on its planar surface.28,29 Hydrophilicity of GO comes from its oxidized functional groups, namely epoxide, carboxylic, and hydroxide on its basal plane.30 This characteristic makes it possible to have GO at the interface of two immiscible liquid (for example water and epoxy resin) that can lead to the formation of Pickering emulsion.31 Due to high barrier properties, modulus, and tensile strength GO has been used as a reinforcing agent for many thermoplastic and thermosetting polymers.32–35 It has been figured out that (reduced) graphene oxide functionalized epoxy composites exhibit improved physical, electrochemical, electromagnetic interference shielding, and mechanical properties at very low GO content.26,34,36–38 These properties at very low GO contents come from high aspect ratio of GO and its functional groups facilitate intermolecular interaction within epoxy matrix.32
The aim of this work is to scrutinize the effect of linear PSf content on the physical, thermal, and mechanical properties of epoxy/GO/polysulfide nano-composite. GO content was kept constant to evaluate polysulfide role in this ternary system. Different tests were conducted to explore the characteristics of nano-composite such as Fourier transform infrared (FTIR), scanning electron microscopy (SEM), tensile, rheo-mechanical spectroscopy (RMS), differential scanning calorimetry (DSC), X-ray diffraction (XRD), and thermogravimetric analysis (TGA).
2. Materials and method
2.1. Material
Epoxy resin (Epon828), and amine hardener (F205) were provided from Shell Co. The PSf resin (G4 grade) was purchased from Akzonobel Co. Natural graphite flakes was supplied from Asbury Graphite Mills. Other reagents were purchased from Merck Chemicals and used as received.2.2. GO synthesis
GO was synthesized according to Hummers' method as described elsewhere.39,40 In detail, 1 g of graphite powder was added to 80 ml H2SO4 (98%) and stirred for 2 h. In the next step, 6 g KMnO4 powder was gradually added to the dispersion in order to form oxidation reaction. After an overnight, a brown paste was obtained. To quench oxidation reaction, the paste poured into 500 ml deionized water surrounded by ice bath to prevent sudden temperature rise. An appropriate amount of hydrogen peroxide (30 wt% in water) was added drop wise to the mixture until a color is changed from brown to yellow was observable. For purification, washing by hydrochloric acid solution (1 M) and deionized water, each for 3 times, was performed. Spontaneous exfoliation of graphite oxide into single layer GO takes place as impurities and ions were removed.392.3. Epoxy/GO/PSf nano-composite preparation
Three different samples were prepared according to Table 1. In detail, PSf and epoxy with a proper amount were mixed by a magnetic stir for 10 min. Then, GO aqueous dispersion with concentration of 2 mg ml−1 was added to the mixture with subsequent mixing. An emulsion consists of GO, epoxy, PSf, and water and a cream color produced after mixing. Heating at 100 °C for 30 min was employed to remove water from this mixture. This step followed a change from cream mixture to blackish brown one which was an indicative of water removal. Samples were placed in vacuum oven at 30 °C for an overnight to remove bubble formed in this stage. Proper amount of hardener (a half of epoxy resin by weight) was mixed with the above mixture slowly to ensure thorough mixing. In the next step, the mixture was coated on the glass substrate via an applicator with 100 μm thickness. Finally, curing was accomplished in an electric oven at 100 °C for 2 h.| Sample name | PSf/epoxy (g/g) | GO (wt%) |
|---|---|---|
| PSf-0.25 | 0.25 | 0.1 |
| PSf-0.5 | 0.5 | 0.1 |
| PSf-1.0 | 1 | 0.1 |
2.4. Characterization
FTIR spectroscopy was performed (thermo scientific NICOLET IR100 FTIR spectrometer). The samples were prepared by mixing a small amount of each case with KBr pellet. DSC was utilized to measure the glass transition temperatures (Tg) of samples using heating and immediate cooling cycles from 25 to 290 °C with temperature ramp of 10 °C min−1 in a TA instrument. SEM was recorded by AIS2100 series of Seron Technology instrument working at a voltage of 0.5–30 kV. RMS was done with rheo-mechanical spectrometry (Paar physica UDS200) using parallel plate geometry at 20 °C. Tensile test was prepared on Galdabini2500 at the rate of 10 mm min−1 in a heating chamber with circulating air at 25 °C. The test specimens were in rectangular shape with dimension of 11 cm × 2.5 cm × 60 μm. XRD analysis was done by Philips X'Pert instrument featuring Cu-Kα radiation system. The measurements were performed at room temperature. TGA was performed by a Netzsch-TGA209 F1 instrument at nitrogen atmosphere with temperature ramp of 10 °C min−1. Ultraviolet-visible (UV-vis) spectrum of GO dispersion was prepared by Cecil CE9200 spectrophotometer. Polarized optical microscopy was performed by Leica DMR instrument in transmission mode.3. Result and discussion
3.1. GO characterization
Different tests were carried out to characterize GO. From UV-vis spectroscopy, a distinct peak at 230 nm and a shoulder at 300 nm were detected which are related to π–π* transitions of aromatic C![[double bond, length as m-dash]](https://www.rsc.org/images/entities/char_e001.gif) C bonds and n–π* transitions of C–O bonds, respectively (Fig. 1a).41 FTIR spectrum of GO sheet features out the characteristic peaks of oxidized functional groups on its surface. The main peaks are 1070, 1406, 1625, 1710, and 3469 cm−1 assigned to C–O stretching, O–H deformation, water stretching deformation, CO stretching, and O–H stretching vibration modes respectively (Fig. 1b).40 In XRD pattern, a very sharp peak centered at 11.3° was noticed that corresponds to an interlayer space of 7.85 Å which is in agreement with previous results (Fig. 1c).39,40 SEM images of GO indicate planar morphology of GO reflecting qualitatively successful synthesis of GO from graphite (Fig. 1d–f). Strong oxidation process introduces oxygenated groups on the graphite flakes. Both increased interlayer size can be occurred during reaction due to existence of oxygen functionalities and reduction of flakes' lateral. Exfoliation of graphite oxide into polar solvent (here, water) can be facilitated by removing ions and other impurities. The wrinkling on the GO surface, a characteristic of GO sheet, is also observable from (Fig. 1e). From liquid crystalline behavior of GO at low concentration (0.75 mg ml−1), it can be deduced that the average size of GO sheets should be above 1 μm (Fig. 1f and g).42,43 This inference is in agreement with optical microscopy images (Fig. 1i).
C bonds and n–π* transitions of C–O bonds, respectively (Fig. 1a).41 FTIR spectrum of GO sheet features out the characteristic peaks of oxidized functional groups on its surface. The main peaks are 1070, 1406, 1625, 1710, and 3469 cm−1 assigned to C–O stretching, O–H deformation, water stretching deformation, CO stretching, and O–H stretching vibration modes respectively (Fig. 1b).40 In XRD pattern, a very sharp peak centered at 11.3° was noticed that corresponds to an interlayer space of 7.85 Å which is in agreement with previous results (Fig. 1c).39,40 SEM images of GO indicate planar morphology of GO reflecting qualitatively successful synthesis of GO from graphite (Fig. 1d–f). Strong oxidation process introduces oxygenated groups on the graphite flakes. Both increased interlayer size can be occurred during reaction due to existence of oxygen functionalities and reduction of flakes' lateral. Exfoliation of graphite oxide into polar solvent (here, water) can be facilitated by removing ions and other impurities. The wrinkling on the GO surface, a characteristic of GO sheet, is also observable from (Fig. 1e). From liquid crystalline behavior of GO at low concentration (0.75 mg ml−1), it can be deduced that the average size of GO sheets should be above 1 μm (Fig. 1f and g).42,43 This inference is in agreement with optical microscopy images (Fig. 1i).
 | ||
| Fig. 1 Characterization of GO with different measurements: (a) UV-vis spectrum, arrows corresponds to the wavelength of 230 and 300 nm, (b) FTIR, (c) XRD pattern, (d–f) SEM images at different magnifications, (g) POM image of GO dispersion at concentration of 0.75 mg ml−1, (h) POM image of GO at concentration of 1 mg ml−1, (i) optical micrograph of diluted GO dispersion on glass substrate. | ||
3.2. Epoxy/GO/PSf ternary system
Many attempts have been made to improve dispersability of GO (or graphene) in solvent or polymeric solution media by ultra-sonication.44,45 However, this method may have some disadvantages such as formation of defects on GO basal plane and/or sheet rupture which can alter its physical properties.44 Moreover, it is a time-energy consuming process limiting its applicability from industrial point of view. To overcome this drawback, utilization of inherent chemical and physical properties of GO in contact with solvent is employed.It has been reported that GO can be regarded as an amphiphile which can stabilize two immiscible phase.31,46,47 In fact, GO plays the role of a self-assembly particle arranged at liquid–liquid interface to reduce the free energy of two interacting surface through construction of new, low energy surfaces.48 This idea was employed to fabricate ternary epoxy/GO/PSf nano-composites. To do so, aqueous dispersion of GO was introduced into epoxy/PSf mixed system. Fig. 2 indicates a schematic representation of nano-composites preparation. Functional groups of GO interact with water molecule on one hand, and sp2 hybridized carbon bond islands on its basal plane may interact with epoxy on the other hand. Here, PSf is a more hydrophilic resin than epoxy, it probably makes like a second linkage between GO and epoxy to reduce interfacial tension. After heating the above mixture, water droplets formed in this procedure were evaporated and led to a distinct color change. In this step, partially reduced GO sheets may be produced due to heating process.49–52
 | ||
| Fig. 2 Schematic representation of epoxy/GO/PSf nano-composite preparation. | ||
To investigate the effect of PSf content on the properties of final nano-composites, GO content was kept constant. It has been reported that for a randomly oriented ellipsoid with aspect ratio of 1000 the percolation threshold occurs at 0.06 vol%.53 Hence, to ensure percolation threshold is achieved weight fraction of GO was determined to be 0.1% (∼0.06 vol%).
3.3. Rheological measurements
Rheological measurements of uncured epoxy/GO/PSf samples have been performed in order to detect the formation of physical structure in the nano-composites. Fig. 3a illustrates the results of storage modulus against frequency (0.1–700 s−1). This figure specifies that PSf-1.0 possessed highest storage modulus at all frequencies. Moreover, a plateau is obvious in this sample which is an indication of the existence of a physical network. Network formation can be seen in the other samples as well according to the plateau region. This kind of behavior was also reported in other particulate composites.54 Since GO concentration is large enough to reach percolation threshold, solid like behavior at low frequencies is inevitable.39 To evaluate the effect of PSf presence on the rheological behavior of nanocomposite sample PSf-0.0 (without PSf) was prepared. It was found that in both storage modulus and complex viscosity, PSf-0.0 had the lowest values which both indicate the critical role of PSf in rheological behavior of aforementioned nanocomposites. Moreover, the intensity of physical network formed in the PSf-1.0 is almost an order of magnitude stronger than PSf-0.5 and PSf-0.25. To explain this phenomenon, the possible reaction of oxirane group in epoxy and mercapto group in PSf is considered (Fig. 4).15,16,19 The product of this reaction contains two hydroxyl groups which facilitates the intermolecular interaction between polysulfide-grafted-epoxy (PSf-g-EP) molecules and GO functional groups. As the amount of PSf in the uncured ternary nano-composite is increased, the probability of PSf-g-EP formation is enhanced as well. Therefore, PSf-g-EP plays a crucial role in the strength of the network formation owing to the capability of its –OH groups to create additional strong hydrogen bonding.30,55 | ||
| Fig. 3 Linear viscoelastic measurements of different samples: (a) storage modulus vs. frequency, (b) complex viscosity vs. frequency. | ||
 | ||
| Fig. 4 The reaction between epoxy and polysulfide to produce PSf-g-EP during nano-composite preparation. | ||
Fig. 3b embraces a complex viscosity of uncured samples as a function of frequency at 20 °C. PSf-0.25 and PSf-0.5 presenting a Newtonian behavior; sample comprising more content of PSf possesses a greater complex viscosity which is somehow contradicting according to lower viscosity of PSf (10 Pa s) compared to epoxy resin (15 Pa s). It can be explained by formation of PSf-g-EP providing additional hydrogen bonding to create intermolecular interaction (Fig. 5). Furthermore, sample PSf-1.0 exhibits a shear thinning behavior. This behavior can be also described by network formation in this sample. At low frequencies, an energetic barrier can be created by the interactions of PSf-g-EP molecules with GO functional groups shifting the relaxation process to very low frequencies.56
 | ||
| Fig. 5 Schematic representation of possible mechanism for solid like behavior of uncured nano-composites at different PSf contents: (a) a low amount of PSf leads to lower PSf-g-EP formation. (b) A high amount of PSf results in more PSf-g-EP. Intermolecular hydrogen bonding represented by dash line. | ||
3.4. FTIR spectroscopy
FTIR spectroscopy of PSf-0.25, PSf-0.5, and PSf-1.0 are depicted in Fig. 6. The main characteristic peaks of nano-composites can be found in Table 2. These characteristic peaks are directed into a successful curing of epoxy resin by amine hardener. For example, O–H stretching vibration is an indicative of curing reaction due to hydroxyl formation during amine and epoxide functional groups reaction. | ||
| Fig. 6 Normalized FTIR spectra of PSf-0.25, PSf-0.5, and PSf-1.0. | ||
| Wavenumber (cm−1) | Assignment |
|---|---|
| 3440 | O–H stretching vibration |
| 2950 | S–H and/or –CH2– symmetric stretching |
| 1470 | CC symmetric stretching |
| 1014 | Out-of-plane C–H deformation of the aromatic ring |
| 1249 | C–N symmetric stretching |
| 941 | Asymmetric stretching of epoxy ring |
| 651 | S–C stretching vibration |
| 568 | S–S stretching vibration |
3.5. DSC
DSC measurements were performed (Fig. 7) to identify Tg and possible crystallinity of samples. Data were extracted from derivative of cooling and heating curves (Table 3) in order to avoid the effect of possible thermal history on Tg of nano-composites. There are some important points deduced from DSC results. The heating curve implies that three different phases coexist in each sample (Fig. 7a). For instance, Tg of these phases are shown by arrows. The observed Tgs are attributed to PSf-rich phase, GO/PSf (and/or PSF-g-EP) phase, and epoxy-rich phase. PSf undergoes a phase separation process during curing reaction of epoxy resin. The intermolecular interactions between GO and PSf (or PSf-g-EP) should come into consideration to explain observing two different PSf contained phases. Therefore, PSf can be in two regions, namely in vicinity of GO sheets or in PSf-rich phase. Upon heating, there is a possibility of PSf migration from GO/PSf phase to PSf-rich phase. In fact, the hydrogen bonding strength between GO and PSf or PSf-g-EP gets dwindled as temperature is increased. When the samples are exposed to cooling cycle after being heated up to 250 °C, two distinct phases were detected which are ascribed to PSf-rich and epoxy-rich phases. | ||
| Fig. 7 DSC curves of PSf-0.25, PSf-0.5, PSf-1.0, and PSf-0.5 (GO-0.0): (a) heating cycle, (b) cooling cycle. | ||
| Sample | Tg of PSf-rich phase (on cooling, °C) | Tg of epoxy-rich phase (on cooling, °C) | Tg of GO/PSf rich phase (on heating, °C) | Tg of epoxy-rich phase (on heating, °C) | Tg of PSf-rich phase (on heating, °C) |
|---|---|---|---|---|---|
| PSf-0.25 | −29 | 104 | 63 | 108 | −23 |
| PSf-0.5 | −29 | 79 | 58 | 93 | −23 |
| PSf-1.0 | −29 | 64.5 | 57 | 79 | −23 |
| PSf-0.5 (no GO) | −34 | 31 | — | 56 | −23 |
Sample PSf-0.5 (GO-0.0) was prepared without addition of GO and cured at the same condition as mentioned before to figure out the effect of GO on the glass transition behavior of nano-composites and possible contribution to phase separation. As expected, there are two phases in this sample because the lack of GO sheet in this sample is able to create an intermolecular interaction with PSf molecules. Moreover, Tg of epoxy-rich phase was reduced from 93 °C to 56 °C on heating cycle (or from 70 °C to 31 °C on cooling cycle). This may be correlated to the restricted segmental movement in epoxy-rich phase induced by GO sheets.
The effect of PSf content on the Tg of mentioned phases in different samples after curing process has been depicted in Fig. 8.
 | ||
| Fig. 8 Tg of different phases in PSf-0.25, PSf-0.5, PSf-1.0, and PSf (GO-0.0). | ||
As the amount of PSf in nano-composites increases, there is a decrease in Tg of epoxy-rich phase. This can be related to the plasticizing effect of PSf uncured molecules which can increase the number of degree of freedom leading to entropy rise in epoxy network.57,58 This trend was observed in both cooling and heating cycle. However, Tg of epoxy-rich phase observed in heating cycle is always greater than the one in cooling cycle. As aforementioned, PSf involved with GO sheets through hydrogen bonding which can migrate to PSf-rich phase and increase its concentration and boost its plasticizing effect. On the other hand, Tg of PSf-rich phase was almost unchanged with PSf content. The final point is concerned with the observation of transient GO/PSf phase in all samples. This state has been phased out during cooling cycle (Fig. 7b). GO/PSf phase possesses an intermediate Tg (value between epoxy-rich phase and PSf-rich phase) which is not changed with PSf content. Fig. 9 illustrates different phase in a typical ternary nano-composite schematically.
 | ||
| Fig. 9 Schematic representation of microstructure of nano-composite prepared in this study. Different phases have been shown. PSf-rich phase contains less crosslink points leading to very low Tg. In contrast, epoxy-rich phase has a high crosslink density that makes it as a rigid phase with high Tg. In the GO/PSf phase crosslink density leads to an intermediate Tg. | ||
3.6. XRD analysis
XRD measurement was carried out (Fig. 10) to explore the dispersion of GO in nano-composites. The wide peak centered at 20° is associated with amorphous nature of cured epoxy resin. Characteristic peak of GO in nano-composites has been downshifted from 11.3° to lower quantities establishing a higher interlayer distance between GO sheets. Furthermore, as the amount of PSf was enhanced, the interlayer distance also supported the idea that PSf (or PSf-g-EP) molecules have more affinity to GO (see also Fig. 5). Table 4 carries out the calculated d-spacing. These results direct to the outlook that GO has been successfully intercalated in nano-composites and they convey the effectiveness of nano-composites preparation method. | ||
| Fig. 10 XRD patterns associated with PSf-0.25, PSf-0.5, and PSf-1.0. | ||
| Sample | PSf-0.25 | PSf-0.5 | PSf-1.0 |
|---|---|---|---|
| 2θ (°) | 6.87 | 5.32 | 5.29 |
| d-Spacing (Å) | 12.85 | 16.59 | 16.68 |
3.7. Tensile
It has been reported that incorporation of GO sheets into polymeric matrix leads to enhancement of Young modulus and tensile strength.35,39 It was correlated to high surface area of GO sheets and its wrinkling can enhance polymer–GO interlocking;21 however, elongation at break may be transferred to lower values due to rigidity implied by GO nature.31 Therefore, the application of both nanoparticle and PSf inducing ductility into neat polymer matrix are directed into achieving desired mechanical properties which are inevitable in most cases.Fig. 11a displays the stress–strain curves corresponding to neat epoxy, epoxy containing 0.1 wt% GO without PSf (PSf-0.0), PSf-0.25, PSf-0.5, and PSf-1.0. It is clear that by incorporation of 0.1 wt% GO into epoxy without PSf, Young modulus was increased up to 823 MPa. However, there was a decrease in elongation at break of epoxy–0.1GO compared to neat epoxy.
 | ||
| Fig. 11 Mechanical properties of PSf-0.25, PSf-0.5, and PSf-1.0: (a) stress–strain curve, (b) modulus and elongation at break for different nano-composites, (c) work of fracture and tensile strength for different nano-composites, (d) work of fracture vs. Tg of epoxy-rich phase. | ||
After introducing PSf into nanocomposites, there were significant changes in mechanical behavior. 36% enhancement in Young modulus of PSf-0.25 in comparison with PSf-0.0 is a clear indication of the vital role of PSf in mechanical behavior of the nanocomposites. The mechanism behind this improvement is correlated to the ability of PSf and/or PSf-g-EP for better formation of physical network between GO sheets.
To study the mechanical properties of PSf containing nanocomposites Young modulus, tensile strength, elongation at break, and work of fracture were utilized which is found in Fig. 11b–d. Modulus of PSf-0.25 has the highest value among the others. As the amount of PSf in nano-composite was increased, modulus has undergone a significant decline (up to 40% for PSf-1.0 in comparison with PSf-0.25). This can be correlated to the softening effect of PSf. In PSf-1.0, nano-composite contains a major amount of PSf molecules which are not cross-linked. This may be the reason for modulus reduction in nano-composites. In case of tensile strength, similar trend can be found in accordance with previous reports.59 Same perspective can be adopted for tensile strength to assess this behavior.
On the other hand, elongation at break shifted to greater value as the amount of PSf increased in the nano-composites. Comparing to PSf-0.25. PSf molecules, its value improved up to 1.6%. As mentioned before, this can be regarded as a plasticizing agent facilitating molecular rearrangements under applied load.57 Holistically, the nano-composite containing higher amount of PSf is able to withstand more extension.
Work of fracture (WoF), as a measure of ductility, was calculated from stress–strain curve. PSf-1.0 nano-composite revealed the greatest WoF with a value of 224 J m−3. WoF for PSf-0.5 and PSf-0.25 are 153 and 125 J m−3, respectively. It can be concluded that the sample embracing higher PSf acquires higher WoF. The soft segments of PSf compared to rigid structure of epoxy consider the main reason for this behavior. To clarify the role of PSf on WoF, Tg of epoxy-rich phase is taken into account in Fig. 11d. It can be inferred that there is a clear relationship between Tg of epoxy-rich phase in nano-composites and their WoF. As Tg was decreased due to higher loading of PSf, WoF was boosted. This kind of behavior, i.e. enhancement of WoF by introducing an effective plasticizer, was reported before.57
3.8. Morphology
SEM measurement was carried out Fig. 12 to scrutinize the morphological characteristics of nano-composites. The fracture surface of PSf-0.25 is almost smooth and it features some river-like lines. GO sheets on the fracture surface is also apparent. Conclusively, PSf-0.25 acts as a brittle material which is unable to resist against crack initiation and growth. This result is in agreement with tensile measurement demonstrating the lowest WoF for this sample. Moreover, the fracture surfaces of PSf-0.5 and PSf-1.0 are rough. In fact, they characterize a ductile material. Considerably, the PSf-1.0 domains of phase separation can be clearly detected. Voids formation only occurred in PSf-1.0 which can lead further plastic void growth. This behavior has been recognized as an effective mechanism for toughening of epoxy-based nano-composite.60,61 Much greater WoF for PSf-1.0 in accordance with SEM observation indicates a rough surface comprising phase separated regions and voids. | ||
| Fig. 12 SEM images of cross section for (a and b) PSf-0.25, (c and d) PSf-0.5, (e and f) PSf-1.0 at different magnification. The scale bar is available in each image separately. | ||
3.9. TGA analysis
TGA analysis was utilized to study the thermal degradation behavior of different samples (Fig. 13). Notably, the derivatives of weight loss results are summarized in Table 5. PSf-0.25 shows more resistance to thermal degradation than PSf-0.5 and PSf-1.0. For instance, a weight loss of 15.3% was detected for PSf-0.25 up to 300 °C. However, this value for PSf-0.5 and PSf-1.0 was 37.1% and 58.3% respectively. There are two distinct peaks in DTG curves of nano-composites. The first peak is attributed to polysulfide soft segment degradation occurring at lower temperatures. The second peak is associated with epoxy hard segments. As the amount of PSf content was increased both peaks shifted to lower temperatures. To elaborate the downshift of first peak, PSf interaction with GO needs to be considered. GO sheets can be regarded as a barrier to prevent PSf from degradation. The case of the second peak is related to the effect of PSf on degree of crosslinking of epoxy network. DSC and tensile results specify that the epoxy rigid network consist of lower CLD as a result of PSf increment.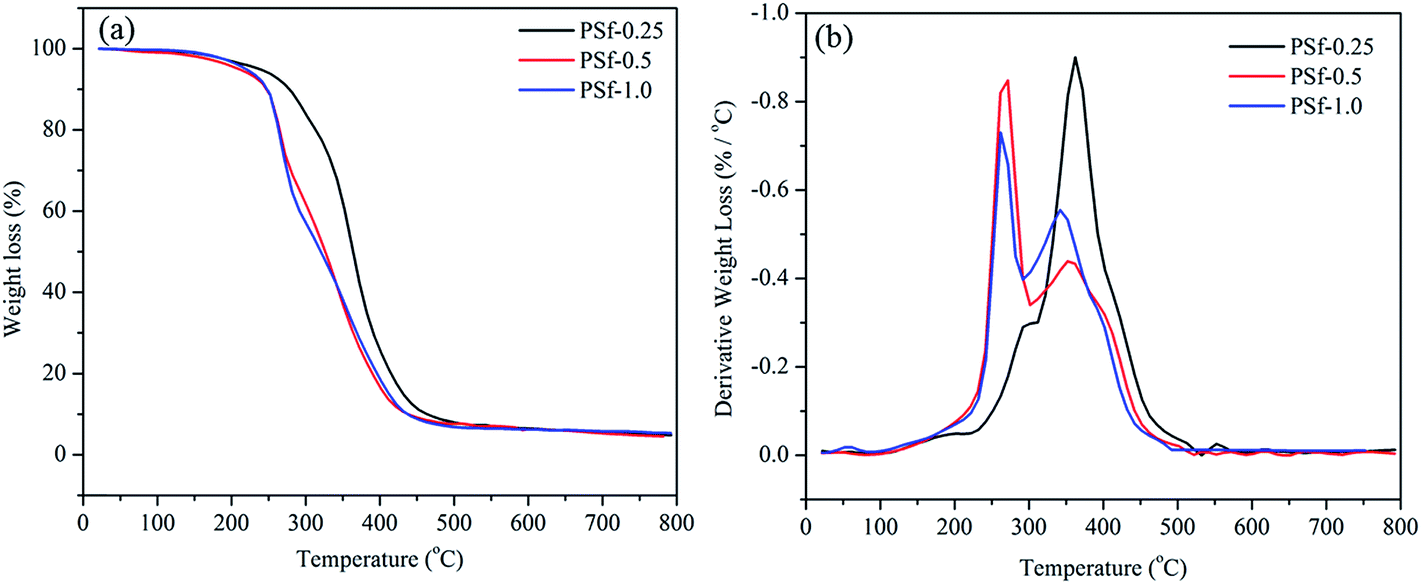 | ||
| Fig. 13 (a) TGA, and (b) DTG curves of PSf-0.25, PSf-0.5, and PSf-1.0 with a heating rate of 10 °C min−1 in nitrogen atmosphere. | ||
| Sample | First peak temp. (°C) | dm/dt at first peak (1/°C) | Second peak temp. (°C) | dm/dt at second peak (1/°C) |
|---|---|---|---|---|
| PSf-0.25 | 292 | −0.29 | 362 | −0.9 |
| PSf-0.5 | 272 | −0.84 | 352 | −0.44 |
| PSf-1.0 | 262 | −0.73 | 342 | −0.55 |
4. Conclusion
Epoxy/GO/PSf ternary nano-composites were successfully synthesized through a simple mixing method utilizing GO as an amphiphile substance.The current research also evaluated the role of PSf content on GO dispersion physical, thermal, and mechanical properties of nano-composites. The results are summarized as follow: rheological assessment showed solid-like behavior confirming network formation of GO sheets at very low content of 0.1%. The strength of this network was pronounced in PSf-1.0 sample. DSC results illustrated a phase separated morphology containing PSf-rich, epoxy-rich and GO/PSf domains inferred from three different Tgs in cured nano-composites. It was also found that Tg of epoxy-rich phase lowered due to plasticizing effect of PSf. XRD patterns confirmed successful intercalation of GO sheets in nano-composites owing to PSf presence. PSf-1.0 possessed highest d-spacing among others. Tensile and SEM measurements implied that as the PSf content increases, the WoF of nano-composites gets up as well. TGA analysis revealed that thermal degradation occurs at lower temperature for PSf-1.0 in comparison to PSf-0.5 and PSf-0.25.
References
- D. J. Hourston, J. M. Lane and H. X. Zhang, Toughening of Epoxy Resins with Thermoplastics: 3. An Investigation into the Effects of Composition on the Properties of Epoxy Resin Blends, Polym. Int., 1997, 42(4), 349–355 CrossRef.
- N. Y. Yuhana, et al., Morphological Study on Room-Temperature-Cured PMMA-Grafted Natural Rubber-Toughened Epoxy/Layered Silicate Nano-composite, J. Nanomater., 2012, 2012, 14 Search PubMed.
- M. Frounchi, M. Mehrabzadeh and M. Parvary, Toughening epoxy resins with solid acrylonitrile–butadiene rubber, Polym. Int., 2000, 49(2), 163–169 CrossRef CAS.
- T. Farajpour, et al., Viscoelastic and thermal properties of polysulfide modified epoxy resin: The effect of modifier molecular weight, Materialwiss. Werkstofftech., 2013, 44(12), 991–996 CrossRef CAS.
- D. Ratna and A. K. Banthia, Rubber toughened epoxy, Macromol. Res., 2004, 12(1), 11–21 CrossRef CAS.
- W. G. Potter, Epoxide resins, 1970 Search PubMed.
- C. May, Epoxy resins: chemistry and technology, CRC Press, 1987 Search PubMed.
- R. S. Bauer, Epoxy resin chemistry, American Chemical Society, 1979 Search PubMed.
- H. C. Kuan, J. B. Dai and J. Ma, A reactive polymer for toughening epoxy resin, J. Appl. Polym. Sci., 2010, 115(6), 3265–3272 CrossRef CAS.
- B. G. Soares, et al., Toughening of an epoxy resin with an isocyanate-terminated polyether, J. Appl. Polym. Sci., 2008, 108(1), 159–166 CrossRef CAS.
- J. Ma, et al., Study of epoxy toughened by in situ formed rubber nanoparticles, J. Appl. Polym. Sci., 2008, 110(1), 304–312 CrossRef CAS.
- S. J. Park and H. C. Kim, Thermal stability and toughening of epoxy resin with polysulfone resin, J. Polym. Sci., Part B: Polym. Phys., 2001, 39(1), 121–128 CrossRef CAS.
- R. Raghava, Development and characterization of thermosetting-thermoplastic polymer blends for applications in damage-tolerant composites, J. Polym. Sci., Part B: Polym. Phys., 1988, 26(1), 65–81 CrossRef CAS.
- T. Iijima, T. Tochimoto and M. Tomoi, Modification of epoxy resins with poly(aryl ether ketone)s, J. Appl. Polym. Sci., 1991, 43(9), 1685–1692 CrossRef CAS.
- K. R. Cranker and A. J. Breslau, Epoxy Casting Resins Modified with Polysulfide Liquid Polymer, Ind. Eng. Chem., 1956, 48(1), 98–103 CrossRef CAS.
- T. Farajpour, et al., Investigating the Effect of Modifier Chain Length on Insulation Properties of Polysulfide Modified Epoxy Resin, Iran. J. Chem. Chem. Eng., 2014, 33(1), 37–44 CAS.
- A. Wilford, T. Lee and T. Kemp, Phase separation of polysulphide polymers in epoxy adhesives, Int. J. Adhes. Adhes., 1992, 12(3), 171–177 CrossRef CAS.
- T. J. Kemp, et al., Structural and materials properties of a polysulphide-modified epoxide resin, Polymer, 1992, 33(9), 1860–1871 CrossRef CAS.
- M. Abdouss, T. Farajpour and M. Derakhshani, Investigating of polysulfide and epoxy-polysulfide copolymer curing. Untersuchungen zur Copolymer-Aushärtung von Polysulfiden und Epoxy-Polysulfiden, Materialwiss. Werkstofftech., 2010, 41(10), 884–888 CrossRef CAS.
- S. C. Tjong, Structural and mechanical properties of polymer nano-composites, Mater. Sci. Eng., R, 2006, 53(3–4), 73–197 CrossRef.
- M. A. Rafiee, et al., Enhanced Mechanical Properties of Nano-composites at Low Graphene Content, ACS Nano, 2009, 3(12), 3884–3890 CrossRef CAS PubMed.
- K. C. Chang, et al., Thermally and mechanically enhanced epoxy resin-silica hybrid materials containing primary amine-modified silica nanoparticles, J. Appl. Polym. Sci., 2008, 108(3), 1629–1635 CrossRef CAS.
- L. Schadler, S. Giannaris and P. Ajayan, Load transfer in carbon nanotube epoxy composites, Appl. Phys. Lett., 1998, 73(26), 3842–3844 CrossRef CAS.
- M. L. Karasek, et al., Effect of temperature and moisture on the impact behavior of graphite/epoxy composites. I: Impact energy absorption, J. Compos. Technol. Res., 1995, 17(1), 3–10 CrossRef CAS.
- T. Lan and T. J. Pinnavaia, Clay-reinforced epoxy nano-composites, Chem. Mater., 1994, 6(12), 2216–2219 CrossRef CAS.
- M. M. Gudarzi and F. Sharif, Enhancement of dispersion and bonding of graphene-polymer through wet transfer of functionalized graphene oxide, eXPRESS Polym. Lett., 2012, 6(12), 1017–1031 CrossRef CAS.
- A. Zandiatashbar, R. Picu and N. Koratkar, Mechanical behavior of epoxy-graphene platelets Nano-composites, J. Eng. Mater. Technol., 2012, 134(3), 031011 CrossRef.
- J. Kim, et al., Graphene oxide sheets at interfaces, J. Am. Chem. Soc., 2010, 132(23), 8180–8186 CrossRef CAS PubMed.
- F. Kim, L. J. Cote and J. Huang, Graphene Oxide: Surface Activity and Two-Dimensional Assembly, Adv. Mater., 2010, 22(17), 1954–1958 CrossRef CAS PubMed.
- D. R. Dreyer, et al., The chemistry of graphene oxide, Chem. Soc. Rev., 2010, 39(1), 228–240 RSC.
- M. M. Gudarzi and F. Sharif, Self assembly of graphene oxide at the liquid–liquid interface: A new route to the fabrication of graphene based composites, Soft Matter, 2011, 7(7), 3432–3440 RSC.
- M. M. Gudarzi and F. Sharif, Molecular level dispersion of graphene in polymer matrices using colloidal polymer and graphene, J. Colloid Interface Sci., 2012, 366(1), 44–50 CrossRef CAS PubMed.
- G. Mittal, et al., A review on carbon nanotubes and graphene as fillers in reinforced polymer nano-composites, J. Ind. Eng. Chem., 2015, 21, 11–25 CrossRef CAS.
- L.-C. Tang, et al., The effect of graphene dispersion on the mechanical properties of graphene/epoxy composites, Carbon, 2013, 60, 16–27 CrossRef CAS.
- B. Ramezanzadeh, et al., Characterization of covalently-grafted polyisocyanate chains onto graphene oxide for polyurethane composites with improved mechanical properties, Chem. Eng. J., 2015, 281, 869–883 CrossRef CAS.
- B. Ramezanzadeh, et al., Enhancement of barrier and corrosion protection performance of an epoxy coating through wet transfer of amino functionalized graphene oxide, Corros. Sci., 2016, 103, 283–304 CrossRef CAS.
- J. Liang, et al., Electromagnetic interference shielding of graphene/epoxy composites, Carbon, 2009, 47(3), 922–925 CrossRef CAS.
- A. S. Wajid, et al., High-Performance Pristine Graphene/Epoxy Composites With Enhanced Mechanical and Electrical Properties, Macromol. Mater. Eng., 2013, 298(3), 339–347 CrossRef CAS.
- M. M. Gudarzi, M. H. M. Moghadam and F. Sharif, Spontaneous exfoliation of graphite oxide in polar aprotic solvents as the route to produce graphene oxide–organic solvents liquid crystals, Carbon, 2013, 64, 403–415 CrossRef CAS.
- M. H. Mohamadzadeh Moghadam, et al., Graphene oxide-induced polymerization and crystallization to produce highly conductive polyaniline/graphene oxide composite, J. Polym. Sci., Part A: Polym. Chem., 2014, 52(11), 1545–1554 CrossRef CAS.
- J. Shen, et al., Synthesis of hydrophilic and organophilic chemically modified graphene oxide sheets, J. Colloid Interface Sci., 2010, 352(2), 366–370 CrossRef CAS PubMed.
- S. Naficy, et al., Graphene oxide dispersions: tuning rheology to enable fabrication, Mater. Horiz., 2014, 1(3), 326–331 RSC.
- R. Jalili, et al., Formation and processability of liquid crystalline dispersions of graphene oxide, Mater. Horiz., 2014, 1(1), 87–91 RSC.
- C. Vallés, et al., Solutions of negatively charged graphene sheets and ribbons, J. Am. Chem. Soc., 2008, 130(47), 15802–15804 CrossRef PubMed.
- U. Khan, et al., High-Concentration Solvent Exfoliation of Graphene, Small, 2010, 6(7), 864–871 CrossRef CAS PubMed.
- S. D. Kim, W. L. Zhang and H. J. Choi, Pickering emulsion-fabricated polystyrene-graphene oxide microspheres and their electrorheology, J. Mater. Chem. C, 2014, 2(36), 7541–7546 RSC.
- Y. He, et al., Factors that affect Pickering emulsions stabilized by graphene oxide, ACS Appl. Mater. Interfaces, 2013, 5(11), 4843–4855 CAS.
- A. D. Dinsmore, et al., Colloidosomes: Selectively Permeable Capsules Composed of Colloidal Particles, Science, 2002, 298(5595), 1006–1009 CrossRef CAS PubMed.
- S. Dubin, et al., A One-Step, Solvothermal Reduction Method for Producing Reduced Graphene Oxide Dispersions in Organic Solvents, ACS Nano, 2010, 4(7), 3845–3852 CrossRef CAS PubMed.
- J.-L. Shi, et al., Hydrothermal reduction of three-dimensional graphene oxide for binder-free flexible supercapacitors, J. Mater. Chem. A, 2014, 2(28), 10830–10834 CAS.
- H. Chen, et al., Reduction of free-standing graphene oxide papers by a hydrothermal process at the solid/gas interface, RSC Adv., 2013, 3(9), 2971–2978 RSC.
- Y. Zhou, et al., Hydrothermal Dehydration for the “Green” Reduction of Exfoliated Graphene Oxide to Graphene and Demonstration of Tunable Optical Limiting Properties, Chem. Mater., 2009, 21(13), 2950–2956 CrossRef CAS.
- E. Garboczi, et al., Geometrical percolation threshold of overlapping ellipsoids, Phys. Rev. E, 1995, 52(1), 819 CrossRef CAS.
- Y. Si and E. T. Samulski, Synthesis of water soluble graphene, Nano Lett., 2008, 8(6), 1679–1682 CrossRef CAS PubMed.
- K. M. Lee and C. D. Han, Rheology of organoclay nano-composites: effects of polymer matrix/organoclay compatibility and the gallery distance of organoclay, Macromolecules, 2003, 36(19), 7165–7178 CrossRef CAS.
- T. A. Witten, L. Leibler and P. A. Pincus, Stress relaxation in the lamellar copolymer mesophase, Macromolecules, 1990, 23(3), 824–829 CrossRef CAS.
- F. Azadimanesh and N. Mohammadi, A plasticizer index to universally correlate the normalized work of fracture and elastic modulus of plasticized cellulose triacetates, Carbohydr. Polym., 2015, 316–324 CrossRef CAS PubMed.
- V. I. Roldughin, et al., Effect of hybrid nanoparticles on glass transition temperature of polymer nano-composites, Polym. Compos., 2015 DOI:10.1002/pc.23376.
- Arundhati, R. Singhal and A. K. Nagpal, Effect of polysulfide modifier on mechanical and morphological properties of epoxy/phthalic anhydride system, Int. J. Plast. Technol., 2009, 13(2), 193–204 CrossRef CAS.
- L.-C. Tang, et al., Fracture mechanisms of epoxy-based ternary composites filled with rigid-soft particles, Compos. Sci. Technol., 2012, 72(5), 558–565 CrossRef CAS.
- B. Johnsen, et al., Toughening mechanisms of nanoparticle-modified epoxy polymers, Polymer, 2007, 48(2), 530–541 CrossRef CAS.
| This journal is © The Royal Society of Chemistry 2016 |