Unique nanotubes from polynorbornene derived graphene sheets†
Madhumita Mukherjee,
Mutyala Naidu Ganivada,
Parvathy Venu,
Pintu Kanjilal and
Raja Shunmugam*
Polymer Research Centre, Department of Chemical Sciences, Indian Institute of Science Education and Research Kolkata, Mohanpur-741246, India. E-mail: sraja@iiserkol.ac.in
First published on 14th April 2016
Abstract
Graphene functionalized polynorbornene nanohybrids (PNAGRs) have been synthesized successfully and their interesting self-aggregation in organic solvent, tetrahydrofuran (THF) has been investigated thoroughly for the 1st time in our present study. The unique hybrids have been fabricated by amide linkages between the activated carboxylic acid group of graphene carboxylic acid (GCOOH) and the pending amine group of synthesized homopolynorbornene (P1). Homopolynorbornene is synthesized by Ring Opening Metathesis Polymerization Technique (ROMP) and is characterized by custom analytical techniques. Formation of hybrid materials with varying GCOOH content is confirmed by Infrared spectroscopy, Raman spectroscopy and Powdered X-ray Diffractometry. The uniform nano-aggregates of the fabricated nanohybrids, PNAGRs in THF has been observed by a Differential Light Scattering study. These nano-aggregates appear as fine nanotubes under Field Emission Scanning Electron Microscope and High Resolution Transmission Electron Microscope. Further, iron encapsulation of PNAGRs is performed to produce PNFs and is confirmed by FESEM, Energy Dispersive X-ray Spectroscopy and Elemental analyses. We envision that this unique observation of the self-assembly of graphene functionalized norbornene polymer into the formed carbon nanotubes will open up new avenues in materials chemistry applications, such as contrast agents for MRI.
Introduction
Graphene is a two dimensional array of sp2 carbon atoms, that are arranged in a honeycomb-type structure. This single layer carbonaceous material possesses excellent thermal, mechanical and electrical properties owing to its unique structure.1 It is worth mentioning that graphene is being successfully used in various fields like electronics,2,3 electro motive shielding,4 polymer composites,5,6 biomedical applications like drug delivery,7 cell imaging,8 medicines,9 and also in catalysts10 and energy storage devices.11 The most potential disadvantages which restrict the application of graphene in various fields are its poor dispersibility in different organic solvents and scalable production. Multiple or single layered graphene sheets are first prepared by scotch tape method12,13 (by mechanical exfoliation). But mostly chemical functionalization has been performed to functionalize graphite to produce graphene to assure its dispersion in various organic solvents by avoiding agglomeration of graphene, which also ensures its scalable production.14–16 Chemical modification i.e. oxidation or acidification introduces defects in ordered graphitic layers due to the incorporation of carboxylic, epoxides, alcohols and ketone groups due to the increased interlayer spacing.17,18 This disruption increases the dispersion of graphene in organic solvents such as THF, DCM, and DMF19 by keeping the most of its physical properties intact. Thus chemical functionalization helps graphene to serve as potential nanofillers for various hybrid materials.5Besides the fabrication of graphene aided nanohybrid, considerable attempts have also been made to generate self assembled hierarchical graphene based nanomaterials,20–23 including co-assembly with organic monolayer.24,25 This type of self-assemblies have been achieved by intermolecular forces arising from π–π stacking, electrostatic interaction, van der Waals force and hydrogen bonding or metal–ligand interaction. Graphene has been effectively used as nanofillers for various polymer matrices5,26,27 by means of covalent and noncovalent interactions. Till date various polymerization techniques have been adopted for the synthesis of polymers to be used as matrices for different graphene aided polymer nanocomposites.28,29
Among all the polymerization techniques, ring opening metathesis polymerization (ROMP) has attracted immense interest in recent days due to its excellent functional group tolerance, mild reaction condition and livingness of the polymerization technique using Grubb's catalyst.30 ROMP has been successfully used as a tool for the polymerization of various polycycloolefins such as polynorbornenes.31 Polynorbornenes have some uniqueness in nature. Being strained systems they exhibited excellent tendency to ring opening and they do not show any inclination to the ring closing metathesis after ring opening. This unique property of norbornenes could give rise to polymers of wide functional groups and controlled poly dispersive index (PDI). With controlled PDI, and excellent functional group tolerance, polynorbornenes have potential application in drug delivery,32 aircraft,33 and industries.34,35 Besides, with biocompatibility, polynorbornenes possess excellent tendency to self-aggregate with various functionalities in to different structures like micelles, vesicles and rods. This type of self-aggregation has made the polynorbornenes to be applicable in drug delivery.36,37
Hence, from the above discussion, it is apparent that the combination of uniqueness of graphene along with polynorbornenes could give rise to a wide range of unique nanohybrids with excellent properties. Lee et al. have reported the fabrication of polynorbornene dicarboximide/amine functionalized graphene hybrids by post polymer modification38 and Zhang et al. have demonstrated the covalent modification of graphene oxide with polynorbornene by surface-initiated ring-opening metathesis polymerization.39
But, to best of our knowledge, the self assembly of the graphene aided norbornene nanohybrids has not been explored till date. Here, we have developed new polynorbornene derived graphene hybrid materials by a simple synthetic approach leading to the covalent interaction between polymer and the graphene. The newly developed hybrid polymer has self-assembled into the fine nanotubular aggregates in THF. We hypothesize that the observed nanotubular aggregation happens due to strong interaction of hydrophilic chains which directs the hydrophobic graphene sheets to fold. We have also envisioned the possible strong H-bonding interaction. To best of our knowledge, this is the first observation in this type of system so far.
Results and discussion
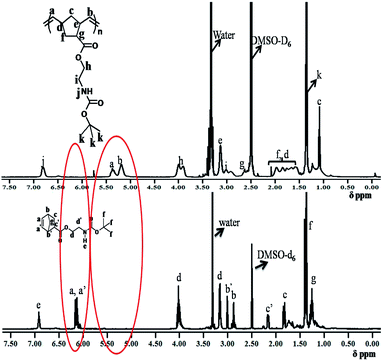
Towards the motivation of developing a graphene derived norbornene polymer, BOCM1 was synthesized and thoroughly characterized using standard analytical techniques (Scheme 1; Fig. S1–S4†).Then BOCM1 was polymerized using ROMP techniques to get the homopolymer P1. The formation of BOCP1 and P1 were confirmed by 1HNMR spectroscopic study and Gel Permeation Chromatogrphy (GPC). 1HNMR spectrum of BOCP1 showed disappearance of the norbornene peak at about δ 6.12 ppm and generation of a new peak at around δ 5.5–5.0 ppm (Fig. S5†). Comparison of the 1HNMR spectra of BOCM1 and BOCP1 has been displayed in Fig. 1.
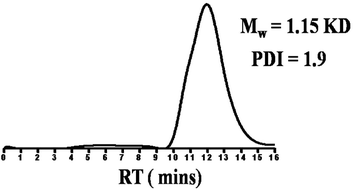
GPC profile of BOCP1 revealed the number average molecular weight of BOCP1 (Mn) was 1.15 kDa with PDI = 1.9 as shown in Fig. 2.
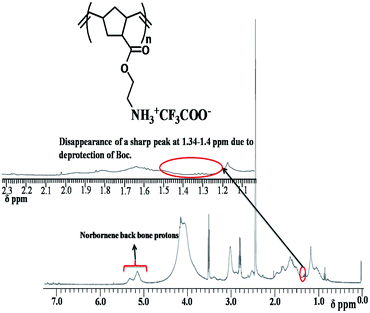
Formation of P1 after Boc deprotection of BOCP1 was confirmed by 1HNMR spectral study (Fig. 3).
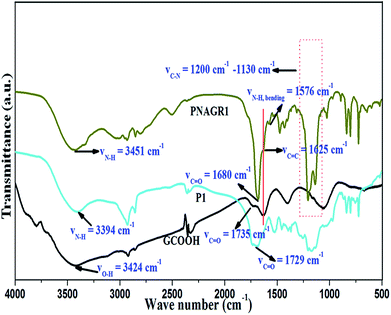
P1 was then functionalized with graphene carboxylic acid (GCOOH) via covalent functionalization to result in the new unique hybrid materials (PNAGR1). The formation of PNAGR1 was confirmed by IR spectroscopic techniques. The IR spectrum (Fig. 4) of GCOOH showed significant stretching bands at around νO–H = 3424 cm−1, νC![[double bond, length as m-dash]](https://www.rsc.org/images/entities/char_e001.gif) O = 1735 cm−1, νC
O = 1735 cm−1, νC![[double bond, length as m-dash]](https://www.rsc.org/images/entities/char_e001.gif) C = 1625 cm−1 arose due to the graphene moiety, O–H deformation band at νO–H = 1400 cm−1 and finally alkoxy C–O stretching band at νC–O = 1061 cm−1 respectively,40 due to the carboxylation of graphene moiety. On the other hand, homopolynorbornene, P1 (Fig. 4) exhibited a stretching band around νC
C = 1625 cm−1 arose due to the graphene moiety, O–H deformation band at νO–H = 1400 cm−1 and finally alkoxy C–O stretching band at νC–O = 1061 cm−1 respectively,40 due to the carboxylation of graphene moiety. On the other hand, homopolynorbornene, P1 (Fig. 4) exhibited a stretching band around νC![[double bond, length as m-dash]](https://www.rsc.org/images/entities/char_e001.gif) O = 1730–1690 cm−1 centring around 1729 cm−1,41 was responsible for the ester group. Along with this, a broad band in the range of 3500–3300 cm−1 having the maximum at about 3394 cm−1 appeared, which was the characteristic band of N–H stretching frequency (νN–H) indicating the presence of amine group in P1 backbone. In addition, frequencies around 2926 cm−1 and 2853 cm−1 suggested the presence alkyl C–H stretching frequency (νC–H). In case of PNAGR1 (Fig. 4), the band at 3394 cm−1 shifted to higher frequency range i.e. a broad band centring at around 3451 cm−1 as compared to virgin hompopolymer, P1. This is the characteristic band of N–H stretching frequency of amide bond (νN–H) formed between P1 and GCOOH in PNAGR1.42 Besides, the ester band around νC
O = 1730–1690 cm−1 centring around 1729 cm−1,41 was responsible for the ester group. Along with this, a broad band in the range of 3500–3300 cm−1 having the maximum at about 3394 cm−1 appeared, which was the characteristic band of N–H stretching frequency (νN–H) indicating the presence of amine group in P1 backbone. In addition, frequencies around 2926 cm−1 and 2853 cm−1 suggested the presence alkyl C–H stretching frequency (νC–H). In case of PNAGR1 (Fig. 4), the band at 3394 cm−1 shifted to higher frequency range i.e. a broad band centring at around 3451 cm−1 as compared to virgin hompopolymer, P1. This is the characteristic band of N–H stretching frequency of amide bond (νN–H) formed between P1 and GCOOH in PNAGR1.42 Besides, the ester band around νC![[double bond, length as m-dash]](https://www.rsc.org/images/entities/char_e001.gif) O = 1729 cm−1 in P1 showed a significant shifting to lower frequency range at around 1680 cm−1 showing a sharp and intense band, having a shoulder at about 1625 cm−1 in case of PNAGR1. Which are the characteristic bands of amide C
O = 1729 cm−1 in P1 showed a significant shifting to lower frequency range at around 1680 cm−1 showing a sharp and intense band, having a shoulder at about 1625 cm−1 in case of PNAGR1. Which are the characteristic bands of amide C![[double bond, length as m-dash]](https://www.rsc.org/images/entities/char_e001.gif) O (νC
O (νC![[double bond, length as m-dash]](https://www.rsc.org/images/entities/char_e001.gif) O) and νC
O) and νC![[double bond, length as m-dash]](https://www.rsc.org/images/entities/char_e001.gif) C of graphene backbone respectively. Hence, we could see clearly from Fig. 4 that amide linkage had been formed between P1 and GCOOH keeping the graphene moiety intact in the resulting hybrids. Another significant peak at around 1576 cm−1 assured the N–H bending frequency of amide group due to amide linkage between the GCOOH and P1 in the PNAGR1.43 Additionally PNAGR1 exhibited two intense bands at around 1200 cm−1 and 1130 cm−1 indicating the presence of amide linkage between P1 and GCOOH.44 From the IR spectral study, formation of PNAGR1 (hybrid material) through amide linkage between P1 and GCOOH was confirmed.
C of graphene backbone respectively. Hence, we could see clearly from Fig. 4 that amide linkage had been formed between P1 and GCOOH keeping the graphene moiety intact in the resulting hybrids. Another significant peak at around 1576 cm−1 assured the N–H bending frequency of amide group due to amide linkage between the GCOOH and P1 in the PNAGR1.43 Additionally PNAGR1 exhibited two intense bands at around 1200 cm−1 and 1130 cm−1 indicating the presence of amide linkage between P1 and GCOOH.44 From the IR spectral study, formation of PNAGR1 (hybrid material) through amide linkage between P1 and GCOOH was confirmed.
The PXRD patterns were further employed to investigate the microstructures of GCOOH, P1 and PNAGR1 as illustrated in Fig. 5.
GCOOH exhibited a (001)44 diffraction peak at about 11.06° with interlayer distance 0.80 nm calculated from Bragg's equation, which was due to the intercalation of oxygenated functional groups in between graphitic layer giving rise to exfoliation of the graphitic layers.38
P1 showed (Fig. 5) amorphous nature with one small peak at 7.7° and a broad peak at 19.66° which were the characteristic peak of polynorbornene.38,39 Upon functionalization of P1 with GCOOH (Fig. 5), i.e. in case of PNAGR1, merging of the peak of P1 at 7.7° and that of GCOOH peak at 11.06° took place to give rise a new peak at around 9.47° with the interlayer spacing of 0.935 nm, which was very significant observation in our study. It arose due to the intercalation of the polymer into graphitic layer and corresponding exfoliation of graphitic layer. The peak at 19.66° of P1 shifted a little bit towards higher diffraction angle (20.35°) in case of PNAGR1. Both the observations were very significant as they were proving the chemical interaction between GCOOH and P1.38,39 Another new peak at around 29.29° in case PNAGR1 which was very much significant and could be due to the core tubular structure of carbon nanotube45–47 resembling with the PXRD pattern of carboxylated multiwalled carbon nanotube (MCOOH) (Fig. S6b†). From this observation, it could be inferred that the hybrids were folded into tubular fashion keeping the graphitic layer intact in the core region. The observation was quiet corroborated with the tubular structure of PNAGR1 observed from the FESEM and HRTEM studies later.
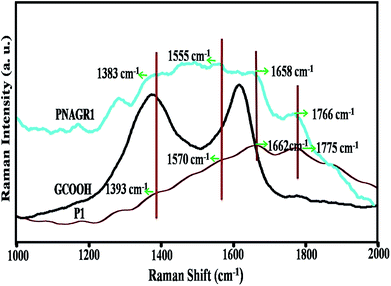
Next, to prove the strong chemical bonding of P1 and graphene, Raman studies were carried out. The Raman spectrum in Fig. 6 confirmed the strong interaction between P1 and GCOOH in the hybrid, PNAGR1.
The spectrum of GCOOH showed two distinct bands at 1374 cm−1 and 1618 cm−1 which were the D band and G band respectively. Among them, D band was the characteristic peak of disorders because of edge distortion of graphene moiety arose due to the carboxylation of graphene and G band originated from E2g in-plane vibration of sp2 carbon atoms of graphitic layers.38
In case of P1 several characteristic bands were observed as evidenced from Fig. 6, but bands at 1393 cm−1, 1570 cm−1, and 1775 cm−1 had been given emphasis as they were the strong evidence for the interaction between GCOOH and P1 forming –C–N–, –N–H, –C![[double bond, length as m-dash]](https://www.rsc.org/images/entities/char_e001.gif) O bonds.48 For PNAGR1 significant shifting of the aforesaid bands had been observed. This clearly showed the close interaction with GCOOH and P1. From Fig. 6 it was observed that for PNAGR1 the band position at 1393 cm−1 was shifted to 1383 cm−1. Similarly, the bands at 1570 cm−1 and 1775 cm−1 were shifted to 1555 cm−1 and 1766 cm−1 as compared to P1. Moreover, the intensities of the bands around 1384 cm−1 in case of PNAGR1, increased remarkably. The shifting of the band centring at 1662 cm−1 in case of P1 shifted to lower frequency region i.e. around 1658 cm−1 in case of PNAGR1 were observed with increased intensities. These might be due to the GCOOH incorporation into P1 in case of hybrids. This type of shifting and the change in intensities of bands in case of PNAGR1 clearly indicated the interaction between P1 and GCOOH through amide linkage.
O bonds.48 For PNAGR1 significant shifting of the aforesaid bands had been observed. This clearly showed the close interaction with GCOOH and P1. From Fig. 6 it was observed that for PNAGR1 the band position at 1393 cm−1 was shifted to 1383 cm−1. Similarly, the bands at 1570 cm−1 and 1775 cm−1 were shifted to 1555 cm−1 and 1766 cm−1 as compared to P1. Moreover, the intensities of the bands around 1384 cm−1 in case of PNAGR1, increased remarkably. The shifting of the band centring at 1662 cm−1 in case of P1 shifted to lower frequency region i.e. around 1658 cm−1 in case of PNAGR1 were observed with increased intensities. These might be due to the GCOOH incorporation into P1 in case of hybrids. This type of shifting and the change in intensities of bands in case of PNAGR1 clearly indicated the interaction between P1 and GCOOH through amide linkage.
After the successful demonstration of chemical bonding of the newly developed hybrids, their self-assembly prospects were explored as the hybrid molecules showed the amphiphilicity. First, self-aggregation study of P1 was carried out in THF. 1 mg of P1 was dissolved in 10 ml of THF and stirred until clear solution was obtained. From this solution 2.5 ml was taken and was mixed with 10 ml of THF with constant stirring. With this dilute solution, particle size was measured using DLS study (Fig. S7b†). It was observed that the particles were in the range of 400–500 nm with 0.34 PDI.
The unimodal distribution observed in DLS suggested the uniform nano-aggregates. Similarly, the PNAGR1 solution for DLS analysis was prepared as stated above. PNAGR1 showed unimodal aggregation in THF (Fig. 7a). The diameters of the agglomerates ranged from 60–100 nm for PNAGR1 with PDI 0.42 (Fig. 7a).
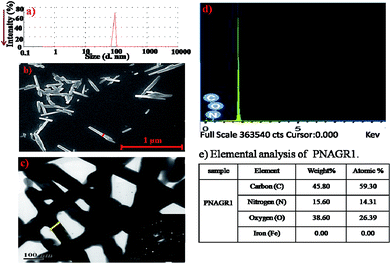 | ||
| Fig. 7 (a) DLS profile of PNAGR1, (b) FESEM micrograph of PNAGR1, (c) HRTEM micrograph of PNAGR1 (inset = SAED picture of PNAGR1), (d) EDX analysis of PNAGR1 and (e) elemental analysis of PNAGR1. | ||
It was very interesting to observe, such type of unimodal pattern of self aggregation for graphene aided polymeric systems. This type of unusual control over self-assembly has not been observed before.
To investigate the shapes of nano-aggregates, FESEM (Fig. 7b) and HRTEM were performed (Fig. 7c). Interestingly GCOOH showed thin sheet like pattern in THF (Fig. S7a†). However, FESEM micrograph of P1 (Fig. S7c†) displayed a vesicular pattern of the homopolymer (400–500 nm), which was in good agreement with the observation obtained from DLS study of the same. FESEM micrograph of PNAGR1 (Fig. 7b) showed rod-like aggregation. PNAGR1 (Fig. 7b) showed the rod-like aggregates of diameter 50–100 nm, which was quite in line with observation from DLS study.
From the FESEM and HRTEM micrographs, it was very evident that the homopolymer functionalized graphene sheets were folded into the nano-tubes. Presence of carbon, nitrogen and oxygen was observed by EDX (Fig. 7d) and elemental analysis (Fig. 7e) in case of PNAGR1.
This tubular structure of PNAGR1 could be possible because of the influence of polymer chains functionalized on graphene. We hypothesized that the chains on the PNAGR1 molecules self-assembled together due to their relative hydrophilicity. During this process, the possible hydrogen bonding influenced heavily for aggregation. Since the interaction of the polymer chains were very strong due to the hydrogen-bonding induced self-assembly, the graphene sheets were folded into unique nanotubes (Fig. 8). To best of our knowledge, the hydrogen bonding induced self-assembly of a polymer functionalized graphene sheets into nanotube has been observed for the first time. Interestingly, these tubular structures of the nanohybrid (PNAGR1) were also been supported the results obtained from PXRD study, where core tubular structure of graphene could be confirmed by the peak at around 29.29°. The tubular patterns of the nanoaggregates were further confirmed by the HRTEM studies.
 | ||
| Fig. 8 Cartoon representation of the self-assembly of the hydrophilic chains including the hydrophobic sheet to fold. | ||
SAED patterns of the fabricated hybrid (PNAGR1) (inset of Fig. 7c) showed polycrystalline nature of the hybrid material, which supported the results obtained from PXRD study.
After confirming the formation of the unique self-assembled structures from PNAGR1, their application in the field of hybrid material was explored. It is well documented in the literature that tubular nano-structures are promising and interesting due to their ability to penetrate easily to cells.49 In addition, their intrinsic stability in the biological environment along with internal space (to be filled with either drugs (or) contrast agent) is among the most attractive features for their biomedical applications. Hence, encapsulation of Fe3O4 particles into nanotubes of PNAGR1 was explored.
In order to achieve iron nanoparticle (Fe3O4) encapsulated nanotubes (PNF1), THF solution of PNAGR1 was sonicated with Fe3O4 solution for 1 h. For confirmation of the successful encapsulation, FESEM and EDX and elemental analysis were done in detail [Fig. 9(a)–(c)]. The relative rough surface of PNF1 compared to PNAGR1 suggested the encapsulation of Fe3O4 particles (Fig. 9a).
This was further confirmed by the EDX and elemental analyses of the corresponding nanohybrid as it showed the presence of Fe in case of PNF1 as compared to PNAGR1 [Fig. 9(b) and (c)]. From the EDX analysis, it was interesting to observe that the Fe3O4 particles were efficiently encapsulated (or) decorated on the top of the nanotubes. And the presence of Fe on the nanotubes was confirmed by the elemental analysis. This was done by electrostatic self-assembly of iron oxide nanoparticles.50 We strongly believed that the polymer chains over the nanotubes were crucial for the encapsulation (or) decoration process. This successful Fe nanoparticle encapsulation of the graphene functionalized polynorbornene nanotubes could be used as contrasting agent in case of MRI techniques.
We performed controlled experiments with the hybrid materials having 0.2 wt% and 0.5 wt% of GCOOH in P1 (PNAGR2 and PNAGR3) and observed same type of shifting in IR, PXRD analysis and Raman spectral studies, as in the case of PNAGR1 (Fig. S8–S10†). Both PNAGR2 and PNAGR3 also displayed unimodal aggregation in THF as evidenced from DLS study (Fig. S11a and S12a†). From FESEM and HRTEM studies confirmed the tubular aggregation for PNAGR2 and PNAGR3 [Fig. S11(b), (c) and S12(b), (c)†]. It is noteworthy that with increasing GCOOH loading the nanotubular structure started to disrupt due to agglomeration and 0.2 wt% GCOOH loading was the optimum condition for successful tubular self-assembly of the nano-hybrids (diameter of PNAGR2 is 50–70 nm, and of PNAGR3 is 100–110 nm). The iron particles encapsulated hybrid materials, PNF2 and PNF3, showed similar type of surface roughness due to iron encapsulation (Fig. S13a and S14a†) and the presence of iron were confirmed by EDX and elemental analysis [Fig. S13(b), (c) and S14(b), (c)†].
Morphology study of PNAGR1 in MeOH was carried out by means of FESEM and no tubular nano-aggregates were observed (Fig. S15†) rather graphene sheets were wrinkled in the polymer matrix, which confirmed that hydrogen bonding played the key role for such tubular morphology in case of nanohybrid in THF.
Moreover, iron encapsulation of GCOOH was done following the same manner stated earlier and was studied by FESEM, EDX and elemental analysis (Fig. S16a–c† respectively). From those study, it was apparent that very small amount of iron nanoparticle was decorated on the GCOOH surface (0.70 weight% and 0.16 atomic%) proving that graphene aided polynorbornene nanotubes were more efficient in iron encapsulation.
Conclusions
A simple method was proposed to fabricate a novel graphene based polynorbornene hybrid material (PNAGR) connected by amide linkages. Proton and carbon NMR, IR, mass spectral analyses and GPC study confirmed the formation of monomers and hompopolymer (P1). PXRD and Raman spectral analyses indicated close interaction between graphene (GCOOH) and P1 in PNAGRs. IR spectral studies confirmed the presence of amide groups in PNAGRs. Morphological characterizations like FESEM, HRTEM and DLS revealed unique aggregates of PNAGRs in THF. P1 self aggregated as vesicular or spherical structure and GCOOH showed thin sheet like aggregation in THF. But PNAGRs self assembled in to tube like structure in THF, which could be assigned as norbornene functionalized carbon nanotube as the nanotubular form of PNAGRs resembled carbon nanotube revealed from PXRD and Raman spectral studies owing to the strong hydrogen bonding between P1 and the graphene sheet (GCOOH). This type of self-assemblies of PNAGRs had been achieved for the 1st time in graphene–polynorbornene systems in our current study so far using a simple synthetic strategy. To evaluate the biological applications of the resulting nanotubes (PNAGRs), iron encapsulation of PNAGRs has been done to give rise to PNFs and was confirmed by FESEM and EDX analysis. These iron encapsulated nanotubes could be used as contrasting agent in MRI technique.Acknowledgements
M. M. thanks Department of Science and Technology, India for providing all financial help and support for FAST Track Young Scientist Grant, R. S. for using his laboratory and giving all supports and scientific suggestion, IISER Kolkata for endorsing the project and providing the infrastructure. R. S. thanks IISER Kolkata and Department of Science and Technology, India for Ramanujan Fellowship. G. N. M. thanks UGC for the fellowship. P. V. thanks IISER-Kolkata. P. K. thanks IISER Kolkata.Notes and references
- D. Chen, F. Hongbin and J. Li, Chem. Rev., 2012, 112, 6027–6053 CrossRef CAS PubMed.
- H. F. Xiang, Z. D. Li, K. Xie, J. Z. Jiang, J. J. Chen, P. C. Lian, J. S. Wu, Y. Yud and H. H. Wang, RSC Adv., 2012, 2, 6792–6799 RSC.
- M. Terrones, O. Martín, M. González, J. Pozuelo, B. Serrano, J. C. Cabanelas, S. M. Vega-Díaz and J. Baselga, Adv. Mater., 2011, 23, 5302–5310 CrossRef CAS PubMed.
- M. S. Cao, X. X. Wang, W. Q. Cao and J. Yuan, J. Mater. Chem. C, 2015, 3, 6589–6599 RSC.
- D. Cai and M. Song, J. Mater. Chem., 2010, 20, 7906–7915 RSC.
- L. Jianhua, A. Junwei, Z. Yecheng, M. Yuxiao, L. Mengliu, Y. Mei and L. Songmei, ACS Appl. Mater. Interfaces, 2012, 4, 2870–2876 Search PubMed.
- J. Liu, C. Liang and L. Dusan, Acta Biomater., 2013, 9, 9243–9257 CrossRef CAS PubMed.
- X. Bian, Z. L. Song, Y. Qian, W. Gao, Z. Q. Cheng, L. Chen, H. Liang, D. Ding, X. K. Nie, Z. Chen and W. Tan, Sci. Rep., 2014, 4, 6093–7001 CrossRef CAS PubMed.
- K. Yang, Y. Li, X. Tan, R. Peng and Z. Liu, Small, 2013, 9, 1492–1503 CrossRef CAS PubMed.
- B. F. Machado and P. Serp, Catal. Sci. Technol., 2012, 2, 54–75 CAS.
- R. Raccichini, A. Varzi, S. Passerini and B. Scrosati, Nat. Mater., 2015, 14, 271–279 CrossRef CAS PubMed.
- K. S. Novoselov, A. K. Geim, S. V. Morozov, D. Jiang, Y. Zhang, S. V. Dubonos, I. V. Grigorieva and A. A. Firsov, Science., 2004, 306, 666–669 CrossRef CAS PubMed.
- C. Berger, Z. Song, X. Li, X. Wu, N. Brown, C. Naud, D. Mayou, T. Li, J. Hass, A. N. Marchenkov, E. H. Conrad and W. A. Heer, Science, 2006, 312, 1191–1196 CrossRef CAS PubMed.
- H. J. Salavagione, G. Martínez and G. Ellis, Macromol. Rapid Commun., 2011, 32, 1771–1789 CrossRef CAS PubMed.
- V. Georgakilas, M. Otyepka, A. B. Bourlinos, V. Chandra, N. Kim, K. C. Kemp, P. Hobza, R. Zboril and K. S. Kim, Chem. Rev., 2012, 112, 6156–6214 CrossRef CAS PubMed.
- F. Hu, J. Du, Y. Fang, X. Ren, X. Liu and Y. B. Zheng, J. Macromol. Sci., Part A: Pure Appl.Chem., 2014, 51, 514–521 CrossRef CAS.
- C. Hontoria, P. A. Lopez, J. Lopez, C. M. Rojas and A. R. Martin, Carbon, 1995, 33, 15851592 Search PubMed.
- D. C. Marcano, D. V. Kosynkin, J. M. Berlin, S. Alexander, S. Zhengzong, L. B. Alemany, L. Wei and M. T. James, ACS Nano, 2010, 4, 4806–4814 CrossRef CAS PubMed.
- J. I. Paredes, S. Villar-Rodil, A. A. Martınez and J. M. D. Tascon, Langmuir, 2008, 24, 10560–10564 CrossRef CAS PubMed.
- J. Xu, K. Wang, S.-Z. Zu, B.-H. Han and Z. Wei, ACS Nano, 2010, 4, 5019–5026 CrossRef CAS PubMed.
- Q. H. Wang and M. C. Hersam, Nat. Chem., 2009, 1, 206–211 CrossRef CAS PubMed.
- Q. Zeng, J. Cheng, L. Tang, X. Liu, Y. Liu, J. Li and J. Jiang, Adv. Funct. Mater., 2010, 20, 3366–3372 CrossRef CAS.
- T. Zhang, Z. Cheng, Y. Wang, Z. Li, C. Wang, Y. Li and Y. Fang, Nano Lett., 2010, 10, 4738–4741 CrossRef CAS PubMed.
- Q. H. Wang and M. C. Hersam, MRS Bull., 2011, 36, 532–542 CrossRef CAS.
- K. H. Liao, S. Kobayashi, H. Kim, A. A. Abdala and C. W. Macosko, Macromolecules, 2014, 47, 7674–7676 CrossRef CAS.
- C. Bao, L. Song, C. A. Wilkie, B. Yuan, Y. Guo, Y. Hu and X. Gong, J. Mater. Chem., 2012, 22, 16399–16406 RSC.
- S. Bose, T. Kuila, M. E. Uddin, N. H. Kim, A. K. T. Laua and J. H. Lee, Polymer, 2010, 51, 5921–5928 CrossRef CAS.
- V. H. Pham, T. T. Dang, S. H. Hur, E. J. Kim and J. S. Chung, ACS Appl. Mater. Interfaces, 2012, 4, 2630–2636 CAS.
- R. Gu, W. Z. Xu and P. A. Charpentier, J. Polym. Sci., Part A: Polym. Chem., 2013, 51, 3941–3949 CrossRef CAS.
- (a) R. H. Grubbs, Handbook of Metathesis, Wiley-VCH, Weinheim, 2003 Search PubMed; (b) K. H. Mortell, M. Gingras and L. L. Kiessling, J. Am. Chem. Soc., 1994, 116, 12053–12054 CrossRef CAS; (c) H. D. Maynard, Y. O. Sheldon and R. H. Grubbs, Macromolecule, 2000, 33, 6239–6248 CrossRef CAS; (d) A. Som, A. O. Tezgel, G. J. Gabriel and G. N. Tew, Angew. Chem., Int. Ed., 2011, 50, 6147 CrossRef CAS PubMed; (e) K. Lienkamp, A. E. Madkour, K. N. Kumar, K. Neusslein and G. N. Tew, Chem.–Eur. J., 2009, 15, 11715–11722 CrossRef CAS PubMed; (f) Z. M. AL-Badri and G. N. Tew, Macromolecules, 2008, 41, 4173–4179 CrossRef CAS.
- (a) S. R. Mane, V. N. Rao and R. Shunmugam, ACS Macro Lett., 2012, 1, 482–484 CrossRef CAS; (b) S. F. Alfred, Z. M. Al-Badri, A. E. Madkour, K. Lienkamp and G. N. Tew, J. Polym. Sci., Part A: Polym. Chem., 2008, 46, 2640–2648 CrossRef CAS.
- V. N. Rao, H. Dinda, M. N. Ganivada, J. Das Sarma and R. Shunmugam, Chem. Commun., 2014, 50, 13540–13543 RSC.
- S. William, Justia Patent 416710, Anderson, United Technologies Corporation, Sunnyvale, CA, Hartford, CT, November 22, 1983.
- N. R. Grove, P. A. Kohl, S. A. B. Allen, S. Jayaraman and R. Shick, J. Polym. Sci., Part B: Polym. Phys., 1999, 37, 3003–3010 CrossRef CAS.
- W. Jeong and M. R. Kessler, Chem. Mater., 2008, 20, 7060–7068 CrossRef CAS.
- M. N. Ganivada, V. N. Rao, H. Dinda, P. Kumar, J. Das Sarma and R. Shunmugam, Macromolecules, 2014, 47, 2703–2711 CrossRef CAS.
- V. N. Rao, M. N. Ganivada, S. Sarkar, H. Dinda, K. Chatterjee, T. Dalui, J. Das Sarma and R. Shunmugam, Bioconjugate Chem., 2014, 25, 276–285 CrossRef PubMed.
- D. Lee, M.-C. Choi and C.-S. Ha, J. Polym. Sci., Part A: Polym. Chem., 2012, 50, 1611–1621 CrossRef CAS.
- Q. Zhang, Q. L. Li, S. Xiang, Y. Wang, C. Wang, W. Jiang, H. Zhou, Y. W. Yang and J. Tang, Polymer, 2014, 55, 6044–6050 CrossRef CAS.
- S. Bose, T. Kuila, A. K. Mishra, N. H. Kim and J. H. Lee, J. Mater. Chem., 2012, 22, 9696–9703 RSC.
- B. H. Stuart, Infrared Spectroscopy: Fundamentals and Applications, John Wiley and Sons Ltd., New York City, United States, 2004 Search PubMed.
- B. C. Smith, Infrared Spectral Interpretation: A synthetic Appoach, CRC Press, Boca Raton, FL, United States of America, 1998 Search PubMed.
- T. Kuila, P. Khanra, S. Bose, N. H. Kim, B. C. Ku, B. Moon and J. H. Lee, Nanotechnology, 2011, 22, 305710–305717 CrossRef PubMed.
- F. P. Du, J. J. Wang, C. Y. Tang, C. P. Tsui, X. P. Zhou, X. L. Xie and Y. G. Liao, Nanotechnology, 2012, 23, 475704 CrossRef PubMed.
- M. Endo, K. Takeuchi, T. Hiraoka, T. Furuta, T. Kasai, X. Sun, C.-H. Kiang and M. S. Dresselhaus, J. Phys. Chem. Solids, 1997, 58, 1707–1712 CrossRef CAS.
- A. Cao, C. Xu, J. Liang, D. Wu and B. Wei, Chem. Phys. Lett., 2001, 344, 13–17 CrossRef CAS.
- C. Zhang, S. Huang, W. W. Tiju, W. Fan and T. Lu, J. Mater. Chem., 2012, 22, 2427–2434 RSC.
- D. L. Pavia, G. M. Lampman, G. S. Kriz and W. B. Saunders, Introduction to Spectroscopy: A Guide for Students of Organic Chemistry, Philadelphia, 1979 Search PubMed.
- K. Kostarelos, A. Bianco and M. Prato, Nat. Nanotechnol., 2009, 4, 627–633 CrossRef CAS PubMed.
- C. Gao, H. Morimoto, Y. Nagaoka and T. Maekawa, J. Phys. Chem. B, 2006, 110, 7213–7220 CrossRef CAS PubMed.
Footnote |
| † Electronic supplementary information (ESI) available. See DOI: 10.1039/c6ra05840j |
| This journal is © The Royal Society of Chemistry 2016 |


