Sol–gel synthesis of a series of first row d-block ferrites via the epoxide addition method†
Deóis C. UaCearnaigh‡
,
Roya Baghi‡ and
Louisa J. Hope-Weeks*
Department of Chemistry & Biochemistry, Texas Tech University, Lubbock, TX 79409, USA. E-mail: Louisa.hope-weeks@ttu.edu; Tel: +1 806 742 3067
First published on 11th May 2016
Abstract
Ferrite spinels of the late first-row d-block metals were synthesized in a uniform manner via the epoxide addition method. Cobalt, nickel, copper and zinc ferrites were generated under mild and favorable conditions and analyzed for trends in the series. All ferrites follow a pronounced trend in particle size and are generally identical beyond the identity of the cation. A crystalline copper ferrite phase is not obtainable under identical annealing procedures, but is obtained at high temperature and amorphous material is obtainable for catalytic testing and comparison within the set. The results indicate that while the epoxide addition method is a powerful and facile synthetic procedure to obtain metal-oxide aerogels, individual metal properties can complicate its use in catalyst comparisons. With the exception of copper ferrite, the other spinels in the series are ideally suited to functional comparisons and exploration of the catalytic parameter space for these materials. All of these ferrites are high surface area and highly porous materials, with uniform particle size modes ranging from 4–8 nm.
1. Introduction
Aerogels are ideal materials for catalysts,1 supports,2 adsorbents,3 insulators,4 gas filters,5 and chemical sensors.6 These metal-oxide frameworks are formed from the interconnection of particles in a three dimensional network synthesized by generating a suspension of solid particles in a solvent, and then removing the solvent with supercritical extraction. They possess desirable characteristics such as high specific surface area, high porosity, low dielectric constant, and low bulk density.7The epoxide addition method for the synthesis of gels was first described by Gash et al.,8 and has allowed the synthesis of a large number of transition metal-oxide gels not previously obtainable.9 While diverse synthetic methods already exist,10 the epoxide addition method allows mild but rapid and irreversible epoxide ring opening conditions to strip a proton from hydrated metal cations in solution, acting as an irreversible base, while trapping the anion and leading to sol particle growth through olation and oxolation reactions.8,11 The gel forms as the particles within solution interconnect to form a network in the sol. Supercritical extraction removes the solvent from the pores resulting in aerogel formation. Aerogels are typified by interconnected nanoparticles with large pore volume.12 Annealing drives off the residual coordinated waters and hydroxides to form an anhydrous, interconnected metal-oxide gel.13
The epoxide addition technique allows the synthesis of metal oxides composed of both simple and complex metal oxide structures which have been historically difficult to obtain, and often with smaller particle sizes when compared to other methods.9b,11,14 A variety of metal salts, concentrations, solvents, and other orthogonal synthetic parameters are available to tune the physical properties of the obtained gels.11,14,15 Thus this approach supplies material science with a “synthetic toolbox”:16 allowing the synthesis of series of materials with interesting properties by modifying the synthetic parameters. The ability to tune the characteristics of the materials can improve the application of the aerogels in different areas. This helps to advance the understanding of catalysis17 and inform the design of novel catalysts.18
In synthesizing a series of materials across the periodic table, varying activities and reduction potentials can pose a problem to the use of the same synthetic method. This introduces an additional variable into the analysis of a large series of materials. However, due to the simple and direct protocol of the epoxide addition method, it is possible to synthesize a complete series of metal-oxide gels. This ideally allows comparisons of the obtained materials to be made without regard to differences in the synthetic method.
Ferrites are a class of spinels formed by oxides of mixed valence metals in +2 and +3 oxidation\ states in the cubic crystal system; with nominal formula MFe2O4, where M denotes any metal. The crystal structure is composed of one occupied octahedral site and two tetrahedral sites per unit cell.20 At least in part due to ionic radii, the smaller ion typically occupies half of the octahedral sites and the larger ion occupies every eighth tetrahedral site, the others remain unoccupied.
Ferrite spinels can be broadly categorized into three structure classes: (1) those in the “normal spinel” structure, in which the +2 ion occupies the tetrahedral site, (2) the “mixed spinel” in which there is some degree of +2 and +3 ion in each the tetrahedral and the octahedral sites, and (3) the “inverse spinel”, in which the +2 ion occupies octahedral sites only.
In the present work, a series of late transition metal ferrite spinels were synthesized. These materials are of interest as carbonate absorbents and to industrial petroleum catalysis such as Fischer–Tropsch, water–gas-shift, etc. Cobalt, nickel, copper, and zinc ferrites were all synthesized according to the same method, which has been previously refined.13,15a To the authors' knowledge, there are only a few examples of a series of ferrites being successfully synthesized in a systematic manner via an identical procedure.19
2. Experimental
2.1 Synthesis of ferrite gels
All reagents in this procedure were used as received: FeCl3·6H2O (Alfa Aesar), anhydrous ZnCl2 (Fluka), CuCl2·2H2O (Alfa Aesar), CoCl2·6H2O (Mallinckrodt), NiCl2·6H2O (Alfa Aesar), acetone (ACS grade, Mallinck-rodt), absolute ethanol (Pharmco Products), and propylene oxide (TCI America). All water used was deionized to 18.4 MΩ cm using an ultrapure water system (Easy Pure II, Barnstead International). All syntheses described were performed under ambient conditions.All ferrites were synthesized from starting materials in the same cation stoichiometry as the target product and with approximately unity yield. Large batches were synthesized to limit error and variation. In a typical synthesis, 1.34 g (8.25 mmol) FeCl3·6H2O was added to a beaker and hydrated by adding water drop-wise in an appropriate amount to total 99 mmol total water, including waters of hydration in the salt precursors. The hydration is exothermic. Then 4.13 mmol of the relevant divalent metal chloride salt was added to the FeCl3 solution, and the metal salts were subsequently dissolved and diluted in absolute ethanol in a volumetric flask until the total volume reached 50 mL. After the metal chloride solution was thoroughly stirred for several minutes, 2.0 mL of the solution was added to a 3 mL glass scintillation vial. Next 0.33 mL (4.7 mmol) of propylene oxide was added to the vial and the reaction mixture was stirred on a minivortex for several seconds. As the reaction is mildly exothermic it was necessary to vent each vial by removing the cap and then replacing it. Each vial was set aside and allowed to gel unperturbed.
After the gels were aged for 1 day, the caps on the vials were removed, and they were subsequently washed by submersion in an acetone bath for a period of approximately 2 weeks. The acetone in the bath was changed frequently to facilitate diffusion of water and other by-products from the gels' pores. Aerogels were made by transferring the wet gels to a SPI-DRY model critical point dryer and exchanging acetone with CO2(l) at 10 °C and ∼850 psi (5.9 MPa). Acetone was removed over a period of approximately 3–4 days. Once all acetone had been removed, the autoclave was heated past the critical point of CO2: approximately 32 °C and 1200 psi (8.3 MPa). The vessel was returned to atmospheric pressure and temperature overnight with incremental venting.
Samples were prepared for X-ray diffraction analysis by annealing in a programmable oven at 350 °C to induce the formation of crystalline ferrite material, except in the case of CuFe2O4, which was annealed at 700 °C. The oven was programmed to heat at a rate of 1 °C min−1 to 350 °C (or 700 °C) and then held for 6 h before returning to room temperature at the same rate.
2.2 Physical characterization
Porosimetry data were collected using a Nova 4200e model surface area analyser (Quantachrome Instrument Corp.). Nitrogen adsorption/desorption isotherms were collected at 77 K using an equilibration time of 5 minutes. As-prepared aerogel specimens were degassed at 80 °C for 20 h. Surface areas were calculated using the Brunauer–Emmett–Teller (BET) method from five data points in the relative pressure range of 0.05 and 0.3 P/P0. The average pore diameters and pore volumes were calculated using the Barrett–Joyner–Halenda (BJH) method using the desorption branch of the isotherm.As-synthesized aerogel powders were analyzed by thermogravimetric analysis (TGA) on a Shimadzu TGA-50. The thermal program raised the specimen to 100 °C at a ramp rate of 10 °C min−1, held at 100 °C for one hour to remove residual volatile materials, and then the temperature was raised to 600 °C at a ramp rate of 5 °C min−1.
Temperature programmed reduction (TPR) was carried out with a ChemBET TPR/TPD Analyzer (Quantachrome Instrument Corp.) equipped with a thermal conductivity detector (TCD). A 100 mg sample was reduced in a gaseous mixture of 5% H2–95% N2 at a flow rate of 70 mL min−1. The sample was heated from room temperature to 700 °C at a heating rate of 5 °C min−1. The hydrogen consumption was monitored using a TCD detector.
Low resolution scanning electron microscopy (LR-SEM) analysis was conducted on each ferrite-based aerogel after annealing. Analysis was performed on a Hitachi S4300 electron microscope operating at 3 kV accelerating voltage. Aerogel powders were gently applied onto a carbon adhesive tape, which had been previously affixed to an aluminium stub. The specimens were sputter-coated with Au–Pt at 10 V and 5 mA for 30 s. Energy Dispersive X-ray (EDX) analysis to determine elemental composition was conducted on the same instrument at an accelerating voltage of 20 kV.
High resolution scanning electron microscopy (HR-SEM) analysis was conducted on annealed aerogel ferrites in a Hitachi S5000 electron microscope operating at 10 kV accelerating voltage in scanning and transmission modes. Samples were prepared by introducing an ultrathin carbon coated Cu-TEM grid into a vial containing annealed samples; excess sample was removed by passing a gentle stream of air over the grid. After preparation, the samples were sputter-coated with Ir to allow charge dispersal and improve image quality under similar conditions described above.
Transmission electron microscopy (TEM) analysis was performed on each annealed ferrite aerogel using a Hitachi 8100 electron microscope operating at an accelerating voltage of 75 kV. Samples were prepared by introducing an ultrathin carbon coated grid into a vial containing annealed aerogel powders; excess sample was removed by passing a gentle stream of air over the grid. Particle analysis and statistics were conducted using the ImageJ® software package blind, on unlabelled micrographs.
The crystalline phase present in both the as-synthesized and the annealed ferrite-based powders was evaluated by powder X-ray diffraction (XRD) analysis. Analysis was performed by a Rigaku Ultima III X-ray diffractometer equipped with a monochromator using Cu Kα radiation as the X-ray source. The Jade® 9.1 software program was used to analyse the resultant X-ray diffraction patterns, index reflections, and calculate the crystallite size. The International Center for Diffraction Data Joint Committee on Diffraction Data (JCPDS) database was used to statistically match diffraction patterns matching EDX composition.
For the in situ high temperature powder X-ray diffraction investigation of CuFe2O4, the as-prepared aerogel was placed in the heating stage and was heated from room temperature to 850 °C with a heating rate of 5 °C min−1. The PXRD patterns were collected at room temperature and for every 100 °C interval in the 450–850 °C range. The temperature was held at each step for 60 minutes before collecting the PXRD patterns.
3. Results and discussion
3.1 Gel formation studies
A total of four distinct gels were synthesized from ethanol solution: cobalt-, nickel-, copper-, and zinc-ferrites. All gels formed rapidly, consistently in ∼40 replicates each and without problem, provided they were not agitated after the initial mixing which prevents gelation. Cobalt–iron salt solutions were a dark green brown, which rapidly darkened to blue-green upon the addition of propylene oxide. Nickel–iron solution is a light yellow, which gradually darkens to a reddish-black. Copper–iron solution in ethanol is a light green, and quickly darkened to reddish-brown with the addition of propylene oxide. Zinc containing solutions were red-orange prior to the addition of propylene oxide and afterwards darkened to red-brown. All colors lighten in hue following washing and again after supercritical drying. Gelation followed the pattern as previously reported.13,15a A single scintillation vial of each gel was used to test the gelation, which was judged to be complete when the reaction vial could be gently tilted without causing a visible disturbance in the meniscus. In all cases an abrupt lightening color change indicated the gelation was complete after approximately 30 minutes. The observation was confirmed approximately ∼20 times for each gel, with a range of 30–34 minutes for all ferrites and no immediately discernible trends from one divalent cation to another.All gels were dried under supercritical conditions to produce aerogels. The resulting aerogels were monolithic and robust. The materials obtained are shown in Fig. 1 for each ferrite.
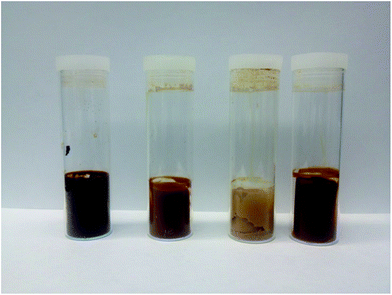 | ||
| Fig. 1 Ferrite aerogels from left to right: cobalt ferrite, nickel ferrite, copper ferrite and zinc ferrite. | ||
3.2 Porosimetry results
All ferrite aerogels were analysed by nitrogen adsorption/desorption analysis to characterize their respective surface areas and pore volumes (Table 1: porosimetry results for ferrite series). The isotherms are displayed in the ESI (Fig. S1†).| Aerogel | BET S.A. (m2 g−1) as-prepared (calcineda) | Pore volume (cm3 g−1) as-prepared (calcineda) | Pore radius (nm) as-prepared (calcineda) |
|---|---|---|---|
| a The porosimetry results for ferrite series annealed at 350 °C. | |||
| CoFe2O4 | 560(151) | 2.0(0.5) | 6.0(5) |
| NiFe2O4 | 519(273) | 2.7(0.9) | 7.7(3) |
| CuFe2O4 | 505(170) | 1.7(0.6) | 1.5(2) |
| ZnFe2O4 | 539(184) | 3.0(0.9) | 6.1(5) |
All materials were found to be highly porous. Special effort was taken to rapidly measure the materials' gas desorption, as previous results suggested a strong sensitivity to atmospheric moisture. The BJH calculation of pore volume and radius does indicate that the copper ferrite is significantly less porous than the others in the series, and this relates well to other observations of the copper ferrite. However, based on these results there is no clear trend in the data, except that the materials are all mesoporous and have high surface area on the order of 500–600 m2 g−1. Annealing the as-prepared aerogels led to lowering the surface area, pore volume and pore radius. This shrinkage is attributed to the surface coarsening, sintering and aggregation of the particles. Densification reduces the porosity of the samples as illustrated by the reduction in pore volume and pore radius. The porosimetry results for CuFe2O4 annealed at 700 °C are summarized in the ESI (Table S1†).
3.3 Powder X-ray diffraction analysis
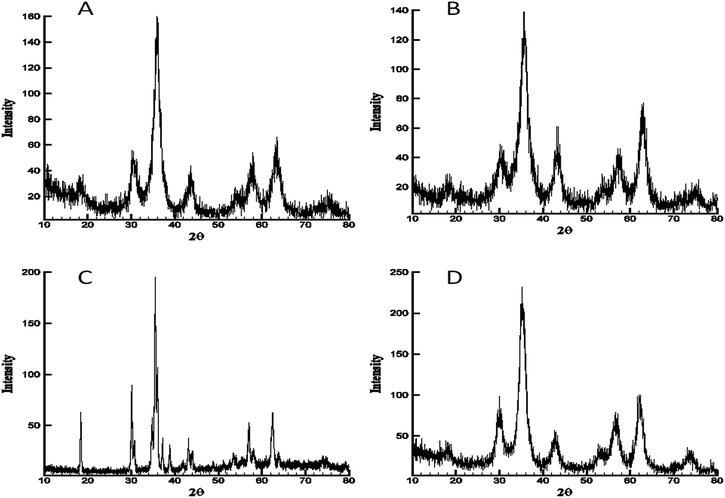
The four materials were analysed by powder X-ray diffraction analysis. Unannealed aerogels exhibited little to no crystallinity indicating the amorphous nature of the as-prepared materials. Annealing the as-prepared cobalt, nickel, and zinc ferrite at 350 °C resulted in formation of crystalline phases and had perfect database matches via Jade® 10 to the JCPDS database for the nominal ferrite, with no impurities detectable by XRD. Cobalt ferrite, JCPDS # 97-018-4063, nickel ferrite JCPDS # 97-0246894, zinc ferrite JCPDS # 97-016-3781 (Fig. 2). Scherrer fits to the principle reflection (311) in the obtained patterns for these three materials calculated crystalline domain sizes of 5 nm (cobalt ferrite), 5 nm (nickel ferrite), and 6 nm (zinc ferrite). However, after annealing at 350 °C, the copper ferrite sample did not show a well-defined crystalline copper ferrite phase (ESI Fig. S2†), and instead was mainly amorphous with minor component matches to CuO and Cu2Cl(OH)3.So-called cuprospinel, the copper derivative of the ferrite ceramic, is known to transform to the tetragonal structure after formation, and to form an unstable cubic spinel at elevated temperatures.20 Therefore, in order to obtain the diffraction pattern in Fig. 2C, a special, high-temperature PXRD stage was used, which allows the collection of diffraction patterns at elevated temperature. When the diffraction pattern was obtained at high temperature using the high temperature stage as shown in Fig. 2C, the copper ferrite signature dominated the pattern and yet still shows minor contributions from hematite and copper oxide, as well as the majority component copper ferrite reflections. For experiments not using the high-temperature apparatus, in which annealing was done in a programmable oven at 700 °C and the PXRD was obtained after cooling to ambient temperature (Fig. 3), the copper ferrite phase was much less dominant than that shown in Fig. 2C, and copper oxide and hematite become large components. The matching database JCPDS numbers are 97-018-8855, 98-000-0429, and 99-000-4448, respectively.
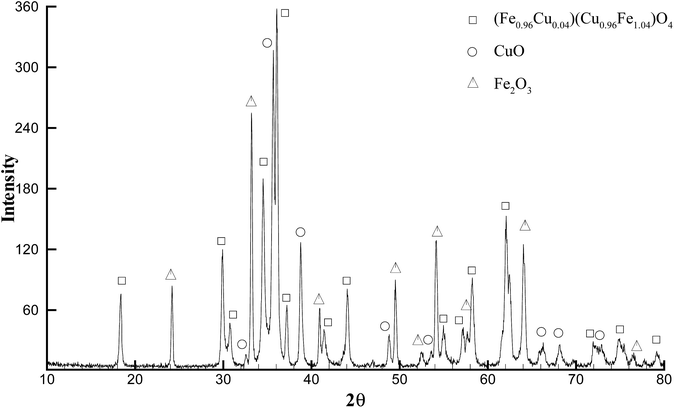 | ||
| Fig. 3 PXRD pattern of initially cubic CuFe2O4 (Fig. 2C) after cooling to ambient temperature at 1 °C min−1 following crystallization at 700 °C for 6 h; showing a complex pattern with contributions from tetragonal CuFe2O4, CuO, and Fe2O3. | ||
Reference to literature indicates that the cubic spinel phase of CuFe2O4 is not stable at low temperature.20
The cubic structure forms at higher temperatures (as in Fig. 2C), and when the material is cooled to ambient temperature CuFe2O4 dynamically shifts into the tetragonal crystal structure. Furthermore, it has also been found that the nominal copper ferrite materials obtained by mechanical milling, combustion, etc., are normally a mixture of copper oxide, iron oxide and copper ferrite phases if confirmed by XRD.21 This instability is understood to be due to the decomposition of the cubic copper ferrite through grain growth of copper oxide and hematite during the shift of cubic CuFe2O4 into the tetragonal crystal structure.20,21b,21c Due to Ostwald ripening at the elevated temperature and time held, Scherrer fit on the (211) reflection finds a crystallite size of 70 nm for the material in Fig. 3. Manual measurement of TEM results via ImageJ® also yields 70 nm for the mode particle size (ESI Fig. S3†).
While zinc ferrite is a normal spinel structure with the M2+ ion uniformly occupying only tetrahedral sites in the crystal lattice, cobalt and nickel ferrites are inverse spinels. This means that in cobalt and nickel ferrites the M2+ species occupies only octahedral sites, along with half of the M3+ ion species in a slightly disordered fashion.22,23 Copper ferrite is a material which has received some attention due to its interesting properties, which include not forming below 700–800 °C, not being obtainable in pure form below 1000 °C, gradual decomposition to the tetragonal form and grain segregation into hematite and copper oxide at ambient temperature, and being highly disordered in the copper ion site selection (i.e., it is not a “normal” or “inverse spinel”, but a “mixed spinel”).21b,24 Experimental and theoretical work find that metastable forms in the cubic spinel and tetragonal forms in varying purities can be obtained by rapidly cooling from high temperature, but that while the Fe3+ containing cells are ordered and standard with respect to other ferrite spinels, the Cu2+ containing cells experience a “Jahn–Teller-like” distortion in the solid state, and this introduces spatial disordering also to the randomly aligned Fe3+ cells.21b This disordering has significant impact on XRD analyses.
3.4 Electron microscopy of ferrite aerogels
The morphologies of annealed gel were investigated by low resolution scanning electron microscopy. At the bulk level, the aerogels appear to have minimal differentiation and are indistinct. All the materials are visibly porous and rough at this resolution. This is shown in Fig. 4. Zinc ferrite (Fig. 4D) appears slightly denser and less roughly textured.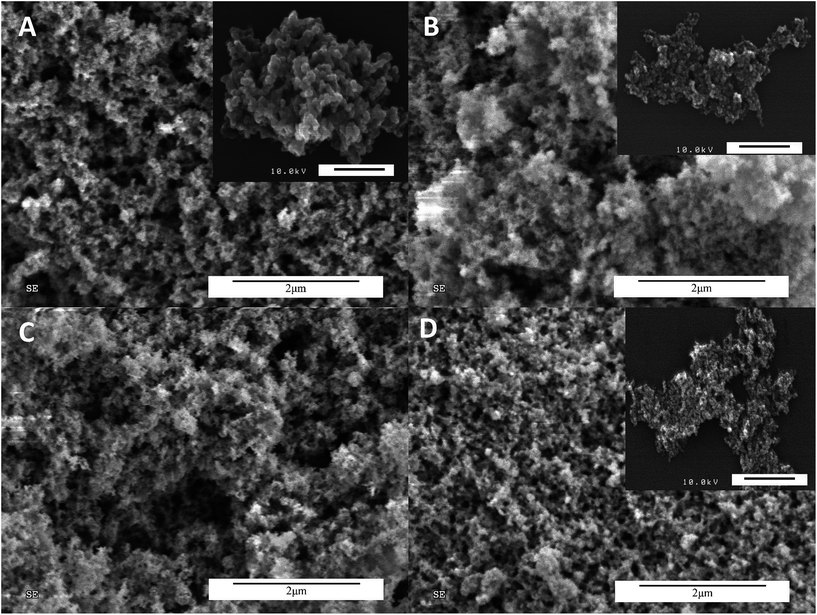 | ||
| Fig. 4 SEM micrographs of ferrite gels at 2 μm. (A) CoFe2O4; (B) NiFe2O4; (C) CuFe2O4; (D) ZnFe2O4. Insets are high resolution SEM micrographs of ferrite gels at 200 nm. | ||
High resolution SEM was also conducted on the aerogels, as shown in the insets in Fig. 4. An iridium sputtercoat allowed charge dispersal, but the copper materials did not have high enough contrast to generate a quality image. It is possible to say form HR-SEM that the materials generally possess the “pearl necklace”13,15a morphology with spherical particles, and that the particle or agglomeration size decreases while going from left to right across images.
Energy dispersive X-ray analysis was conducted to determine elemental composition of the annealed materials. Averaging over multiple measurements, elemental analysis indicates Fe![[thin space (1/6-em)]](https://www.rsc.org/images/entities/char_2009.gif) :
:![[thin space (1/6-em)]](https://www.rsc.org/images/entities/char_2009.gif) M2+ atomic ratios indicate an excess of iron in all cases except cobalt ferrite: cobalt ferrite: 1.90Fe
M2+ atomic ratios indicate an excess of iron in all cases except cobalt ferrite: cobalt ferrite: 1.90Fe![[thin space (1/6-em)]](https://www.rsc.org/images/entities/char_2009.gif) :
:![[thin space (1/6-em)]](https://www.rsc.org/images/entities/char_2009.gif) Co; nickel ferrite: 2.28Fe
Co; nickel ferrite: 2.28Fe![[thin space (1/6-em)]](https://www.rsc.org/images/entities/char_2009.gif) :
:![[thin space (1/6-em)]](https://www.rsc.org/images/entities/char_2009.gif) Ni; copper ferrite: 4.46Fe
Ni; copper ferrite: 4.46Fe![[thin space (1/6-em)]](https://www.rsc.org/images/entities/char_2009.gif) :
:![[thin space (1/6-em)]](https://www.rsc.org/images/entities/char_2009.gif) Cu; zinc ferrite: 2.99Fe
Cu; zinc ferrite: 2.99Fe![[thin space (1/6-em)]](https://www.rsc.org/images/entities/char_2009.gif) :
:![[thin space (1/6-em)]](https://www.rsc.org/images/entities/char_2009.gif) Zn. 1–2 atomic percent Cl was present in all samples, as well as less than 1% atomic Au.
Zn. 1–2 atomic percent Cl was present in all samples, as well as less than 1% atomic Au.
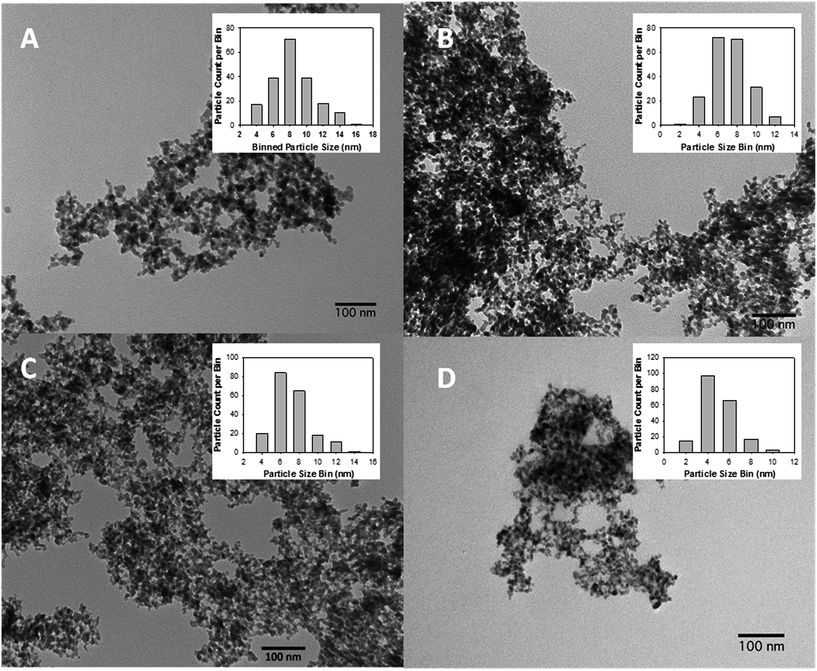
Transmission electron microscopy (TEM) analysis was performed on several areas of each annealed ferrite aerogel synthesized. The TEM morphology of all ferrite aerogels on the nanometer scale is aptly described as the “pearl necklace” morphology, as seen in SEM, and a decreasing particle size mode is observed (Fig. 5). All images are at 100 nm scale bar.
The particle size distributions of all materials were analyzed using ImageJ®, with a manual count of approximately 200 individual particles and binned into 2 nm classes. Graphs of particle size distribution are inset in each image.
In the case of cobalt ferrite, the particle distribution after annealing has a peak particle size of 8 nm and is unimodal, monodisperse, and near Gaussian distribution about a mean of 9.4 nm and a standard deviation of 2.5 nm (1σ). All annealed ferrite TEMs show materials which maintain good isolation despite annealing, are nanoparticulate and have porous properties on the nanoscale. In nickel ferrite TEM results the particle size distribution shows a peak-shift to smaller particle sizes, with a mode in the range of 6–8 nm and a mean of 8.3 ± 2.0 nm.
For the purposes of TEM analysis, CuFe2O4 annealed at 350 °C was used. While the PXRD was wholly nondescript at this annealing temperature, the particulate nature of this material is just as apparent as it is with the other three materials. Moreover, its morphology is in keeping with the morphology observed for the other materials (pearl necklace, well isolated and porous), and the particle size distribution (inset) follows the exact same pattern, with a slight decrease in particle size to a mode of 6 nm, a mean of 7.2 ± 2.0 nm, and positive tailing. While disorder within the crystallite prevents useful diffractometry, the physical dimension and morphology of the amorphous material is in keeping with the series.
In the case of zinc ferrite, the dominant particle size is in the range of 4 nm, the mean is 6.0 ± 1.8 nm, and otherwise very similar to both results of the other materials and to the ZnFe2O4 obtained previously.13
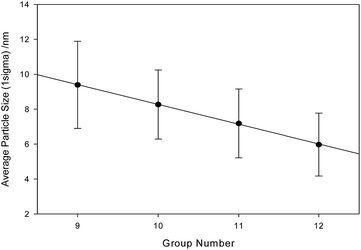
TEM results clearly indicate a strong trend in the series cobalt-, nickel-, copper-zinc ferrites with decreasing particle size and finer structure in the obtained material. As shown in Fig. 6, when particle size is plotted against the group number of the divalent cation, the trend in decreasing physical particle dimension across the four samples is linear with a correlation coefficient of r2 = 0.9995.
Ionic radius does not follow such a linear pattern across the series, and thus cannot be used to explain the very tight trend.25 Although unit cell dimensions have been long shown to have a strong dependence on ionic radius and electronegativity,26 there is no obvious connection to the crystalline domain dimensions (which in this case is not correlated within Scherrer resolution) nor in the bulk particle size. The relationship with the particle size is very interesting and worthy of further investigation. Particle measurement was conducted in random order and blind.
3.5 Thermal analysis
Thermogravimetric analyses (TGA) of the aerogels of all materials indicate a rapid mass loss due to dehydration condensation around 300–350 °C, in the magnitude of approximately ∼33% (ESI Fig. S4†). Any adsorbed water is driven off by holding the temperature at 100 °C for 1 h. This amounted to a loss of not more that ∼2%. These are in the range of appropriate loss of product water formed from the metal hydroxide precursors during annealing into the ferrite materials.13The most salient feature of the TGA to be noted is that of CuFe2O4, which despite being invisible to XRD, undergoes the dehydration reaction at roughly the same temperature and to the same magnitude as all the other materials. As a result, it is reasonable to conjecture that the material obtained at 350 °C is in fact a metal oxide based network, which is simply too disordered to diffract.
3.6 Temperature programmed reduction
Temperature programmed reduction (TPR) experiments were carried out for each of the ferrite samples to study the reducibility of the materials prepared with the epoxide addition method. H2-TPR profiles of the calcined ferrites are depicted in Fig. 7. The Co, Ni and Zn ferrites displayed definable reduction edges. In accordance with literature, the first peak is assigned to the reduction of the divalent cations in CoFe2O4, NiFe2O4, and ZnFe2O4 (Co2+, Ni2+, and Zn2+ resp.) to the corresponding metallic Co°, Ni°, and Zn°, with the formation of hematite (Fe2O3). The second peak is ascribed to the reduction of Fe2O3 (hematite) to Fe3O4 (magnetite). The third signal is attributed to the reduction of Fe3O4 to metallic Fe° via FeO.27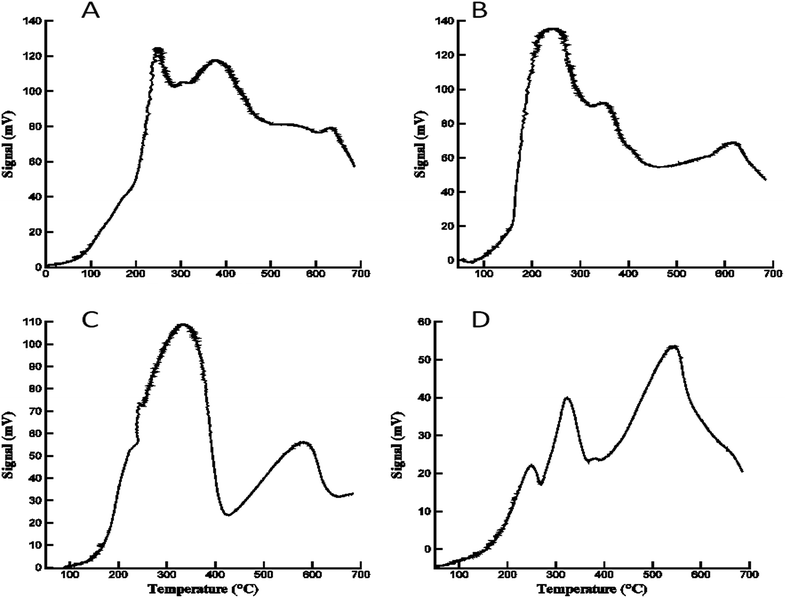 | ||
| Fig. 7 Temperature programmed reduction of the series of ferrites. (A) CoFe2O4; (B) NiFe2O4; (C) CuFe2O4; (D) ZnFe2O4. | ||
However, CuFe2O4 exhibits two distinctive peaks which is consistent with previous reports.21a,21d,28,29
The first, broad peak is ascribed to both the reduction of CuFe2O4 to metallic Cu° and Fe2O3; and to the subsequent reduction of Fe2O3 to Fe3O4. The second peak is attributed to the reduction of Fe3O4 to metallic Fe°. The different reduction behavior of CuFe2O4 can also be due to the presence of the reducible CuO and Fe2O3 as two additional, separate phases in the copper ferrite sample.30 This results in an overlap between the reduction peaks of these metal oxides in the mixture, which is unresolvable by TPR.
4. Conclusions
In conclusion, the series trends well according to particle size reduction from cobalt to zinc ferrites, although all materials are generally highly comparable in terms of morphology, porosity and habit. In the materials characterizations carried out within this work, there is very little difference from one to the next of these materials. Future works will focus on the catalytic analyses of these materials and the role of the specific metal ion in the catalyst material. However, the copper ferrite material stands out in most respects as being specifically noteworthy.Copper ferrite doesn't crystallize under similar conditions to the other members of the series, despite the power of the epoxide addition approach at forming the mixed-hydroxide precursors to the ferrites and the appearance that the mixed copper hydroxides—iron hydroxides likely follow an acceptably similar path up to this point. At the point of dehydration to form the metal-oxide network, however, copper is sufficiently unstable in the spinel matrix that the material partially segregates into copper oxide and hematite. The material is also otherwise highly amorphous. This is believed to be due to (1) the unique structure of the copper ferrite material, which is a so-called mixed spinel, (2) due to the instability of cubic copper ferrite at room temperature,24 (3) copper ionic diffusivity within the crystal structure,24 (4) Jahn–Teller-like distortions in the copper ion containing cells,21b and (5) temperature dependence of the crystal parameters31 all lead to dynamic and real-time rapid distortion and disorder within the copper ferrite lattice structure.
This aside, it has been demonstrated that these materials form highly porous, high surface area, nanoparticulate materials which are easily and directly comparable across the series, and are ideally suited to catalytic study when generated by the epoxide addition method in the uniform manner used within. Further work will address application of these materials in the water–gas shift, low-temperature low-pressure Fischer–Tropsch, and carbon monoxide oxidation reaction.
Acknowledgements
The Texas Tech University Imaging Center is gratefully acknowledged: NSF MRI 04-511, A&S EOX Imaging Facility. The expert assistance of Dr Bo Zhao is gratefully acknowledged for assistance with high-resolution SEM micrographs. The X-ray facility at the Texas Tech Chemistry department was invaluable. Daniel Unruh is gratefully acknowledged for assistance with the high temperature XRD analysis. This material is based upon work supported by the U.S. Department of Homeland Security under Award Number 2008-ST-061-ED0001. The views and conclusions contained in this document are those of the authors and should not be interpreted as necessarily representing the official policies, either expressed or implied, of the U.S. Department of Homeland Security.References
- (a) S. Bali, F. E. Huggins, G. P. Huffman, R. D. Ernst, R. J. Pugmire and E. M. Eyring, Energy Fuels, 2009, 23, 14 CrossRef CAS; (b) R. J. Davis and Z. F. Liu, Chem. Mater., 1997, 9, 2311 CrossRef CAS; (c) Z. Hao, Q. Zhu, Z. Jiang, B. Hou and H. Li, Fuel Process. Technol., 2009, 90, 113 CrossRef CAS.
- (a) Z. Ma, B. C. Dunn, G. C. Turpin, E. M. Eyring, R. D. Ernst and R. J. Pugmire, Fuel Process. Technol., 2007, 88, 29 CrossRef CAS; (b) F. Duarte, F. J. Maldonado-Hodar and L. M. Madeira, Ind. Eng. Chem. Res., 2012, 51, 9218 CrossRef CAS; (c) S. K. Gill, P. Brown, M. T. Ogundiya and L. J. Hope-Weeks, J. Sol-Gel Sci. Technol., 2010, 53, 635 CrossRef CAS; (d) Y. Mizushima and M. Hori, Appl. Catal., A, 1992, 88, 137 CrossRef CAS.
- J. Mrowiec-Bialon, A. B. Jarzebski, A. I. Lachowski and J. J. Malinowski, J. Non-Cryst. Solids, 1998, 225, 184 CrossRef CAS.
- Z. S. Deng, J. Wang, A. M. Wu, J. Shen and B. Zhou, J. Non-Cryst. Solids, 1998, 225, 101 CrossRef CAS.
- B. Hosticka, P. M. Norris, J. S. Brenizer and C. E. Daitch, J. Non-Cryst. Solids, 1998, 225, 293 CrossRef CAS.
- M. R. Ayers and A. J. Hunt, J. Non-Cryst. Solids, 1998, 225, 343 CrossRef CAS.
- (a) N. Husing, U. Schubert, K. Misof and P. Fratzl, Chem. Mater., 1998, 10, 3024 CrossRef; (b) W. Volksen, R. D. Miller and G. Dubois, Chem. Rev., 2010, 110, 56 CrossRef CAS PubMed.
- A. E. Gash, T. M. Tillotson, J. H. Satcher, J. F. Poco, L. W. Hrubesh and R. L. Simpson, Chem. Mater., 2001, 13, 999 CrossRef CAS.
- (a) T. M. Tillotson, A. E. Gash, R. L. Simpson, L. W. Hrubesh, J. H. Satcher and J. F. Poco, J. Non-Cryst. Solids, 2001, 285, 338 CrossRef CAS; (b) Y. P. Gao, C. N. Sisk and L. J. Hope-Weeks, Chem. Mater., 2007, 19, 6007 CrossRef CAS.
- (a) B. C. Tappan, M. H. Huynh, M. A. Hiskey, D. E. Chavez, E. P. Luther, J. T. Mang and S. F. Son, J. Am. Chem. Soc., 2006, 128, 6589 CrossRef CAS PubMed; (b) D. J. Suh and T. J. Park, Chem. Mater., 1996, 8, 509 CrossRef CAS; (c) S. Mulik, C. Sotiriou-Leventis and N. Leventis, Chem. Mater., 2007, 19, 6138 CrossRef CAS; (d) D. Loche, M. F. Casula, A. Falqui, S. Marras and A. Corrias, J. Nanosci. Nanotechnol., 2010, 10, 1008 CrossRef CAS PubMed; (e) S. K. Gill and L. J. Hope-Weeks, Chem. Commun., 2009, 4384 RSC.
- A. E. Gash, J. H. Satcher and R. L. Simpson, Chem. Mater., 2003, 15, 3268 CrossRef CAS.
- S. S. Kistler, Nature, 1931, 127, 741 CrossRef CAS.
- P. Brown, D. U. Cearnaigh, E. K. Fung and L. J. Hope-Weeks, J. Sol-Gel Sci. Technol., 2012, 61, 104 CrossRef CAS.
- A. M. Shobe, S. K. Gill and L. J. Hope-Weeks, J. Non-Cryst. Solids, 2010, 356, 1337 CrossRef CAS.
- (a) P. Brown and L. J. Hope-Weeks, J. Sol-Gel Sci. Technol., 2009, 51, 238 CrossRef CAS; (b) J. Eid, A. C. Pierre and G. Baret, J. Non-Cryst. Solids, 2005, 351, 218 CrossRef CAS; (c) C. N. Chervin, B. J. Clapsaddle, H. W. Chiu, A. E. Gash, J. H. Jr Satcher and S. M. Kauzlarich, Chem. Mater., 2006, 18, 4865 CrossRef CAS.
- L. R. D'Souza, in In Synthesis, Properties, and Applications of Oxide Nanomaterials, ed. J. A. R. M. F.-G, John Wiley & Sons, Inc, Hoboken, NJ, 2007 Search PubMed.
- Y. M. Jin and A. K. Datye, J. Catal., 2000, 196, 8 CrossRef CAS.
- (a) X. Zhou, W. Xu, G. Liu, D. Panda and P. Chen, J. Am. Chem. Soc., 2010, 132, 138 CrossRef CAS PubMed; (b) S. H. Joo, J. Y. Park, J. R. Renzas, D. R. Butcher, W. Huang and G. A. Somorjai, Nano Lett., 2010, 10, 2709 CrossRef CAS PubMed; (c) B. R. Cuenya, Thin Solid Films, 2010, 518, 3127 CrossRef CAS; (d) H. Yu, Y. Liu and S. L. Brock, ACS Nano, 2009, 3, 2000 CrossRef CAS PubMed; (e) A. Corrias, M. F. Casula, A. Falqui and G. Paschina, Chem. Mater., 2004, 16, 3130 CrossRef CAS.
- A. Khan and P. G. Smirniotis, J. Mol. Catal. A: Chem., 2008, 280, 43 CrossRef CAS.
- H. S. C. Oneill and A. Navrotsky, Am. Mineral., 1983, 68, 181 CAS.
- (a) T. Tsoncheva, E. Manova, N. Velinov, D. Paneva, M. Popova, B. Kunev, K. Tenchev and I. Mitov, Catal. Commun., 2010, 12, 105 CrossRef CAS; (b) E. Prince and R. G. Treuting, Acta Crystallogr., 1956, 9, 1025 CrossRef CAS; (c) R. P. Barany and L. B. Pankratz, in Thermodynamic properties of cuprous and cupric ferrites, US Dept. of the Interior, Bureau of Mines, Washington, D.C, 1964 Search PubMed; (d) X. Lin, Y. Zhang, L. Yin, C. Chen, Y. Zhan and D. Li, Int. J. Hydrogen Energy, 2014, 39, 6424 CrossRef CAS.
- M. G. S. Naseri and E. B. Saion, in Advances in Crystallization Processes, ed. Y. Mastai, InTech, Rijeka, Croatia ed, 2012 Search PubMed.
- P. Laokul, V. Amornkitbamrung, S. Seraphin and S. Maensiri, Curr. Appl. Phys., 2011, 11, 101 CrossRef.
- L. Weil, F. Bertaut and L. Bochirol, J. Phys. Radium, 1950, 11, 208 CrossRef CAS.
- R. D. Shannon, Acta Crystallogr., Sect. A: Found. Crystallogr., 1976, 32, 751 CrossRef.
- F. S. Vermaas, Beiträge zur Mineralogie und Petrographie, 1959, 6, 219 CrossRef.
- (a) R. Benrabaa, A. Loefberg, J. G. Caballero, E. Bordes-Richard, A. Rubbens, R.-N. Vannier, H. Boukhlouf and A. Barama, Catal. Commun., 2015, 58, 127 CrossRef CAS; (b) C. C. Xu, W. Sun, L. M. Cao and J. Yang, Chem. Eng. J., 2016, 289, 231 CrossRef CAS.
- J. E. Tasca, C. E. Quincoces, A. Lavat, A. M. Alvarez and M. Gloria Gonzalez, Ceram. Int., 2011, 37, 803 CrossRef CAS.
- R. Baghi, G. R. Peterson and L. J. Hope-Weeks, J. Mater. Chem. A, 2013, 1, 10898 CAS.
- (a) K. Faungnawakij, N. Shimoda, T. Fukunaga, R. Kikuchi and K. Eguchi, Appl. Catal., B, 2009, 92, 341 CrossRef CAS; (b) K. Faungnawakij, Y. Tanaka, N. Shimoda, T. Fukunaga, R. Kikuchi and K. Eguchi, Appl. Catal., B, 2007, 74, 144 CrossRef CAS.
- R. Pauthenet and L. Bochirol, J. Phys. Radium, 1951, 12, 249 CrossRef CAS.
Footnotes |
| † Electronic supplementary information (ESI) available. See DOI: 10.1039/c6ra05831k |
| ‡ These authors contributed equally. |
| This journal is © The Royal Society of Chemistry 2016 |

