DOI:
10.1039/C6RA05811F
(Paper)
RSC Adv., 2016,
6, 47212-47219
Single step synthesis of a polymer supported palladium composite: a potential anode catalyst for the application of methanol oxidation†
Received
4th March 2016
, Accepted 5th May 2016
First published on 6th May 2016
Abstract
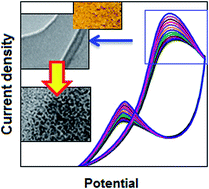
Polymer supported ionic palladium has been synthesized using a single step, in situ polymerization and composite formation route from the corresponding monomer and metal salt precursors. The composite has been characterized using various optical, microscopic and surface characterization techniques. The synthesized material was successfully used as the electrocatalyst for the methanol oxidation reaction in alkaline media, suggesting a potential candidate for methanol fuel cells application. During the reaction, the in situ transformation from ionic palladium to palladium nanoparticles has been noticed and this plays a major role for the significant improvement of the oxidation process.
1. Introduction
In general, two different classes of materials, such as, inorganic and organic molecules or polymers, have been applied as hosts to stabilise two different kinds of palladium species, ionic palladium and metallic palladium. Due to the unique properties of the polymer, they are often used in depositing appropriate palladium species for various application purposes. The well-known application of palladium as a catalyst is carbon–carbon bond formation reactions which are commonly used for the synthesis of natural products, pharmaceutical products, fine chemicals and the manufacturing of long chain organic molecules for organo-electronics applications.1,2 The use of palladium nanoparticles in catalysis is not only industrially important3 but also scientifically interesting since they provide details of the sensitive relationship between the catalytic activity and the nanoparticle size and shape as well as the nature of the surrounding media.4 The incorporation of palladium in polymers has attracted attention because the composite architectures provide synergistically useful functionality and mechanical stability. Many investigations have been published regarding the incorporation of the palladium into a polymer matrix for versatile applications.5–10
Electro-oxidation of small organic molecules, particularly alcohol, has attracted considerable attention for to the development of liquid fuel cells due to high energy densities, low operating temperature and low pollutant emission.11 Though platinum is the most efficient electrocatalyst for methanol fuel cell application but the platinum based catalysts are less tolerant for carbon monoxide poisoning that restrict the catalyst from the widespread application in fuel cells. Among the various replacement of platinum based catalysts, palladium with different support materials received considerable attention because of their superior activity and greater resistance to carbon monoxide poisoning.12 Nanostructured palladium catalyst on multi-walled carbon nanotubes,13 active carbon fibers,13 carbon microspheres and hollow spheres14,15 using PdCl2 salt as the metal precursor has been reported as the promising anode catalysts for the oxidation of methanol. Among them Pd–carbon nanotube system are considered as the highly active catalyst due to the smaller size and higher dispersion of the metal. In another study, the performance of Pd–multi-walled carbon nanotube was tested for the oxidation of methanol, ethanol and glycerol and the results exhibited high activity of the catalyst for the oxidation reactions of all alcohols.16 Reduced graphene oxide in combination with Nafion as a support for the nanostructured palladium has been reported as a promising electrocatalyst for ethanol oxidation.17 Dispersed palladium nanoparticles on the surface of vanadium oxide nanotubes18 and β-MnO2 (ref. 19) have been exhibited excellent electrocatalytic methanol oxidation reaction under alkaline medium. Palladium nanoparticles decorated graphene was utilized for the efficient electro-oxidation of methanol under strong alkaline condition.20
Very few examples are available in the literature regarding the polymer based catalyst for the electrooxidation of alcohol. Palladium nanoparticles supported on polypyrrole-functionalized graphene was reported as a very active catalyst for the electro-oxidation of methanol.21 The poly(diphenylbutadiene) polymer nanofiber supported metallic palladium showed the catalytic activity for the oxidation of ethanol.22 Reports are also available for the polyaniline, a conducting polymer, supported Pt–Ru and Pt–Sn binary catalyst for the electrochemical oxidation of methanol and ethanol, where binary system performed better catalytic activity than the Pt alone.23 The conducting polymers also serve as an excellent component for the various energy related applications.24–26
In this current study, we report the formation of a palladium–polymer composite material, Pd(I)–poly[4-(thiophen-3yl)-aniline], Pd–pTA, by using the in situ polymerization and composite formation (IPCF) approach.27–31 We have chosen 4-(thiophen-3yl)-aniline for this experiment because the molecule has nicely responded for the IPCF type of reaction for the synthesis of Pd–pTA composite. IPCF technique for the synthesis of composite material have potential advantages in the field of ‘synthetic material science’ because the reaction produces both the polymer and the metal component simultaneously and thus facilitates an intimate contact between them through functionalization. The composite material was characterized using various optical and microscopic techniques. Surface characterization techniques have also been employed to extract further information about the composite material. The synthesized material has been used as a catalyst for the electro-oxidation of methanol.
2. Experimental section
2.1. Materials
All the chemicals and the solvents used for this experiment were of analytical purity and used without further purification. Ultra-pure water (specific resistivity > 17 MΩ cm) was used in this experiment wherever required.
2.2. Material characterization
TEM studies were performed at an acceleration voltage of 197 kV by using a Philips CM200 TEM instrument equipped with a LaB6 source. The TEM samples were prepared by depositing small amount of synthesized material onto a TEM grid (200 mesh size Cu-grid) coated with a lacy carbon film. The SEM studies were performed at 5 kV by using an FEI Quanta 400 instrument. As a precaution to prevent possible charging, the samples were sputter-coated with a thin, uniform layer of Au–Pd. The X-ray diffraction (XRD) patterns were recorded on a Shimadzu XD-3A X-ray diffractometer operating at 20 kV using Cu-Kα radiation (k = 0.1542 nm). The measurements were performed over a diffraction angle range of 2θ = 10° to 90°. X-ray photoelectron spectra (XPS) were collected in a UHV chamber attached to a Physical Electronics 560 ESCA/SAM instrument. Fourier transform infrared spectroscopy (FTIR) spectra were collected utilizing a Shimadzu IRAffinity-1 with a spectral resolution of 0.5 cm−1. The UV-vis spectra were measured using a Shimadzu UV-1800 spectrophotometer using with a quartz cuvette. To measure the fluorescence property of the material a spectrofluorophotometer (RF-5301PC, Shimadzu), attached with a light source of 150 W Xenon lamp, was used for this study. The surface areas were calculated by the Brunauer–Emmett–Teller (BET) method, and the pore size distribution was calculated by applying the Barrett–Joyner–Halenda (BJH) theory. Electrochemical studies was carried out with a, Bio-Logic, SP-200, potentiostat connected to a data controller. A three-electrode system was used in the experiment with a glassy carbon electrode (GCE) as the working electrode. Ag/AgCl electrode (saturated KCl) and a Pt-electrode were used as the reference and counter electrodes, respectively.
2.3. Preparation of Pd–pTA composite catalyst
In a typical experiment, 0.350 g of 4-(thiophen-3-yl)-aniline was dissolved in 10 mL of methanol and a separate stock solution of K2PdCl4 (0.0326 g of K2PdCl4 in 10 mL of water) were prepared. In a small glass beaker, 3.5 mL of K2PdCl4 stock solution was added drop wise to the 10 mL of methanolic solution of the 4-(thiophen-3-yl)-aniline under continuous stirring conditions. During the addition, the solution took on a yellow colour, while at the end, a yellowish precipitation, Pd–pTA, was formed at the bottom of the beaker. Entire reaction was performed under ambient condition. The material was allowed to settle for 30 min after which the colloidal solution was taken from the bottom of the beaker and pipetted onto lacey, carbon-coated, copper mesh grids for TEM study and after the TEM study the same grid was sputter coated with a conducting layer a few nanometres thick of Au–Pd for SEM study. The required amount of material was used for UV-vis, IR and PL spectroscopy studies. The remaining portion of the compound was dried under vacuum at 60 °C and used for XRD, XPS and BET measurements as well as the studies for the electrochemical oxidation of methanol. For the comparative study, poly[4-(thiophen-3yl)-aniline], pTA, has been synthesized using ammonium persulfate (APS) as an oxidizing agent.
2.4. Electrochemical measurements
A GCE was carefully polished with alumina powder and subsequently cleaned with ethanol and deionized water. The synthesized composite material (Pd–pTA) was dropped onto the GCE surface, dried in the air at room temperature and used for electrochemical measurements at room temperature. For the electro-oxidation study of methanol, the cyclic voltammograms were recorded at a scan rate of 50 mV s−1 in a mixture of KOH (0.5 mol dm−3) and methanol (1.0 mol dm−3).
3. Result and discussion
3.1. Characterization of the compound
The TEM image (Fig. 1A) indicates a thin film-like morphology with a smooth surface of Pd–pTA, whereas, the low magnification SEM image (Fig. 1B) shows the fiber-like morphology of the synthesized metal–polymer composite material. The XRD pattern of polyaniline and the derivatives of polyaniline generally depend on the length of the polymeric chains and the oxidation states. The pattern also depend on the synthetic routes, solvent and oxidizing agent used for the synthesis. In this current study the XRD spectrum (Fig. 1C) for Pd–pTA shows three major peaks at 17.0, 23.5 and 27.8 which correspond to (011), (020) and (200) crystal planes. The XRD pattern also confirmed the crystalline character of the material and no evidence of the formation of metallic palladium species. A comparative XRD image (ESI, Fig. S1†) shows the difference of crystalline behaviour between the samples (pTA and Pd–pTA).
 |
| Fig. 1 (A) TEM and (B) SEM image of the Pd–pTA composite. (C) The XRD patterns of the Pd–pTA composite and the XPS signal (D) indicates the presence of characteristic ionic palladium species in the sample. | |
To investigate the oxidation state of palladium in Pd–pTA the XPS technique was employed. The characteristic XPS peaks (Fig. 1D) correspond to curve-fitting for palladium 3d spectra consisting of the Pd 3d5/2 and Pd 3d3/2 spin-orbital splitting. In this work we have used only the binding energy value of the Pd 3d5/2 line to determine the oxidation state of palladium. In general, the peak positioned at 335.7 eV indicates the metallic state of palladium whereas the peak at approximately 337.75 eV can be assigned to the Pd(II) state.32 In the present experiment the synthesized Pd–pT3A shows an asymmetric broad spectrum within the range 335.0–340.0 eV and after deconvolution two separate peaks appeared at 336.75 and 337.55 eV. The peak at 337.55 eV is due to the presence of unreacted Pd(II) whereas the new peak that appeared at 336.75 eV is due to the presence of Pd(I) in the sample.32,33 Both the palladium species could coordinate and stabilize with chain nitrogen of the polymer.34
The optical property of the synthesized composite material (Pd–pTA) and the polymer alone (pTA) were characterized using UV-visible and photoluminescence (PL) spectroscopy methods.
In the spectrum (a) and (b), Fig. 2A, a broad band within the range of 380–520 nm can be assigned for polaron–bipolaron transition for pTA and Pd–pTA, respectively. In spectrum (b), a sharp absorption peak at 300 nm is clearly visible which are due to the π–π* transition of the benzenoid rings. Photoluminescence spectra for the pure polymer and Pd–polymer were measured in the range of 310–440 nm (Fig. 2B) and the wavelength of excitation for the samples was chosen 300 nm. In the current experiment, the emission peaks for both the samples were observed at about 370 nm and it is also evident from the figure that the intensity of the spectra for Pd–pTA is higher than that of the pure polymer. It has been well documented that benzenoid unit present in the polymer backbone demonstrate the fluorescence property.35 The photoluminescence property of polymer is caused by the benzenoid unit (amine group) and it is quenched when such a group is adjacent to the quinoid unit (imine group) or converted to a quinoid unit.35 For both samples in the present work the benzenoid groups are predominant as compared with the quinoid units. The presence of both amine group (electron donating group) and ionic species, Pd(I), enhances the electron mobility in the Pd–pTA composite, which in turn favours the formation of singlet excitons. The singlet exciton states decay radiatively to the ground state resulting in enhanced photoluminescence.36 A broad spectrum appeared for Pd–pTA composite and may be attributed due to the formation of more density of states due to the presence of ionic palladium. For the pure polymer, the fluorescence spectrum shows that emission occurs at 368 nm with a shoulder at 381 nm originate from single chain or intra-chain excitons and inter-chain excitons, respectively.37
 |
| Fig. 2 (A) The UV-visible spectra of (a) pTA and (b) Pd–pTA. (B) The photoluminescence spectra for (a) pTA and (b) Pd–pTA. | |
The presence of quinoid unit in the Pd–pTA composite has been confirmed from the Fourier transform infrared spectrum (Fig. 3), where the vibrational signature at 1660 cm−1 indicates the presence of N
Q
N (Q represents a quinoid ring structure). A doublet band with the peak positions at 1447 and 1410 cm−1 can be assigned to the ν3 mode of thiophene.38 The ν3 mode is a ring vibration that consists primarily of the symmetric stretching of the C
C bonds of thiophene.39 The vibration bands at 1108 and 1023 cm−1 are due to the aromatic C–H in-plane bending modes.
 |
| Fig. 3 FTIR spectra of Pd–pTA. | |
The mechanism of the IPCF type of polymerization process comprises the release of electrons during the reaction between monomer and metal salt (oxidizing agent). In general, the released electrons reduce the metal ions, such as, gold, silver and palladium, to their respective atomic state, which ultimately forms their corresponding nanoparticles.40–42 However, in the present experiment we found the reaction between 4-(thiophen-3yl)-aniline and K2PdCl4 evidences the formation of Pd(I) and poly[4-(thiophen-3yl)-aniline]. The polymer is an aniline derivatives have several amine as well as imine moieties which can act as a macro ligand,34 that coordinate with the Pd(I) species. The electron microscopy characterization also showed no evidence for the formation of palladium nanoparticles. The TEM result also corroborate with the previously described XPS data. Therefore, to explain our data, the partial reduction of Pd(II) to Pd(I) species becomes an attractive proposal. This would lead similar to, though not identical, the formation of Pd(I)–carbonyl carboxylate complex43 which can be envisaged as a model for such Pd(I) intermediates. The chemistry of Pd(I) complexes has been intensively developed with the special interest due to both the unusual oxidation state of Pd and the potentially important role of Pd(I) complexes in catalytic processes.44
The Fig. 4 is the nitrogen adsorption and desorption isotherm for both the samples, pTA (a) and Pd–pTA (b), and are follows type II isotherm with a typical H3-type hysteresis loop according to the IUPAC (International Union of Pure and Applied Chemistry) classification. The BET surface areas of the pTA and Pd–pTA are 30.26 m2 g−1 and 9.32 m2 g−1, respectively, and the average pore diameter for both the samples are 40 nm. Impedance spectroscopy is an effective method for probing the features of surface-modified electrodes. The complex impedance can be presented as the sum of the real, Z′, and imaginary, Z′′, components that originate mainly from the resistance and capacitance of the cell, respectively. A typical shape of a faradaic impedance spectrum, presented in the form of a Nyquist plot in Fig. 5 (main panel), includes a semicircle region lying on the Z′-axis followed by a straight line. The semicircle portion, observed at higher frequencies, corresponds to the electron-transfer-limited process, whereas the linear part is characteristic of the lower frequencies range and represents the diffusion-limited electron-transfer process. From the figure it is clear that almost similar slope values for both the samples which indicate the identical ion diffusion rate. The semicircle diameter equals to the electron transfer resistance values at the electrode surface for pTA (a) and Pd–pTA (b) are 68.60 ohm and 58.30 ohm, respectively (Fig. 5A). For the sample pTA, the electron transfer resistance was expanded which indicated the polymer performs as a kinetic barrier for the electron transfer process, whereas, in Pd–pTA the electron transfer resistance value was decreased due to the presence of ionic palladium species that participate for a better charge transfer mechanism. The electrochemical cell equivalent circuit for both the samples are identical in nature (Fig. 5B is for Pd–pTA), where RCt represents the charge transfer resistance of the modified electrode and RW is the diffusion coefficient of the electroactive species. The term, RS represents the total ohmic resistance of solution and electrode whereas QC designate the capacitance of the double layer. The electrochemical active surface area of the as synthesized composite material Pd–pTA was 0.70 m2 g−1 in alkaline media, which is the comparable value as referred in the literature45 and calculated from the Fig. S2 (ESI†).
 |
| Fig. 4 The optical images of (a) pTA and (b) Pd–pTA. (A) Nitrogen adsorption and desorption isotherms and (B) pore size distribution of the (a) pTA and (b) Pd–pTA. | |
 |
| Fig. 5 The electrochemical impedance spectroscopy analysis for the (a) pTA and (b) Pd–pTA in 0.50 M KOH within the frequency ranges from 3 MHz to 10 Hz. The electron transfer resistance values for (a) pTA and (b) Pd–pTA are 68.60 Ohm and 58.30 ohm, respectively. (B) The electrochemical cell equivalent circuit for Pd–pTA. | |
3.1.1. Performance of Pd–pTA as an electrocatalyst for methanol oxidation reaction. The composite material, Pd–pTA, has been tested as an electrocatalyst towards the oxidation of methanol and was monitored by cyclic voltammetric technique. We have also checked the performance of bare electrode and pTA modified electrode in the presence and absence of methanol. In Fig. 6A, two cyclic voltammetric signatures, ‘a’ and ‘b’, are for bare and pTA modified electrode, respectively, in 0.5 mol dm−3 KOH solution. Due to the addition of 1.0 mol dm−3 of methanol in the presence of 0.5 mol dm−3 KOH solution, the current density values, as obtained from voltammogram signals, for both bare and pT3A modified electrodes have been slightly improved, designated as ‘c’ and ‘d’, respectively. In the main panel (Fig. 6B), cyclic voltammogram of Pd–pTA modified glassy carbon electrode (curve ‘e’), in absence of methanol, shows the maximum current density value of 1.70 mA cm−1 at 0.2 V but when the GC electrode was modified with Pd–pT3A, in the presence of 1.0 mol dm−3 methanol, during the forward scan, the current density value reached at 2.12 mA cm−1 at 0.09 V, curve ‘f’, in 0.5 mol dm−3 KOH under the scan rate of 50 mV s−1. The CV curves consist of two well-defined peaks at the forward and reverse scans. The peak in the forward scan is attributed to the oxidation of methanol molecules while the one in the reverse scan is related to the oxidation of intermediate products, mainly carbon monoxide.20 It is also important to mention that a gradual increase of current density values has been observed during the repeated scan with the decreasing of peak potential value (Fig. 7A). The magnified figure, marked by an arrow, of the methanol oxidation peaks indicates the decrease of potential values from 0.090 V (point ‘a’) to 0.065 V (point ‘b’) along with the increase of current density values from 2.12 to 2.54 mA cm−1. The phenomenon of the above event could be explained in the light of nanoparticle catalyzed reaction where the transformation of ionic palladium to palladium atoms which leads to the formation of polymer stabilized nanoparticles, as evidenced by the TEM image of the recovered material from the working electrode (Fig. 7B), that expedite the catalytic performance of the composite for the methanol oxidation process by lowering the potential values with the increase of current density values. The histogram, the particle frequency as a function of particle size, (ESI, Fig. S5†) shows that 85% of the palladium nanoparticles are approximately within the range between 2 and 3 nm. The characteristic XPS peak with the binding energy value 335.25 eV for the Pd 3d5/2 line indicates the presence of metallic palladium with in the polymer matrix (Fig. 7C).
 |
| Fig. 6 (A) Cyclic voltammogram of bare GCE (curve ‘a’), pTA modified GCE (curve ‘b’) in the absence of methanol, whereas, the curve ‘c’ and curve ‘d’ represent the voltamogramme for bare GCE and pTA modified GCE, respectively, in the presence of 1.0 mol dm−3 methanol and 0.5 mol dm−3 KOH under the scan rate of 50 mV s−1. (B) Cyclic voltammogram of Pd–pTA modified GCE, in the absence of methanol (curve ‘e’) and in the presence of 1 mol dm−3 methanol (curve ‘f’), in 0.5 mol dm−3 KOH under the scan rate of 50 mV s−1. | |
 |
| Fig. 7 (A) Represents 10 consecutive scans (cyclic voltammograms) in the presence of 1.0 mol dm−3 methanol and 0.5 mol dm−3 KOH. The magnified section shows, from ‘a’ (first scan) to ‘b’ (tenth scan), the increase of current density (peak height) with the shifting of peak position towards lower potential direction. (B) Polymer stabilized palladium nanoparticles (sample collected from the working electrode at the end of the experiment). (C) The characteristic XPS peak with the binding energy value 335.23 eV for the Pd 3d5/2 line indicates the presence of metallic state of palladium. | |
The highest current density achieved by using Pd–pTA modified glassy carbon electrode in the presence of 1.0 mol dm−3 methanol and 0.5 mol dm−3 KOH was 5.03 mA cm−1 at 0.065 V (Fig. 8A). The electrocatalytic cycling stability of Pd–pTA modified electrode in other words the deactivation of the catalyst has also been studied in this experiment and we have found that the net decrease of current density was 0.69 mA cm−1 after 500 cycles, which indicate a stable catalyst for the methanol oxidation reaction (Fig. 8A). Fig. S4 (ESI†) shows the normalized cyclic voltammogram, during the stability study of Pd–pTA catalyst, in the presence of 1.0 mol dm−3 methanol in 0.5 mol dm−3 of KOH and the highest current density achieved was 250 mA cm−1 per mg of Pd under the scan rate of 50 mV s−1.
 |
| Fig. 8 (A) The stability study of Pd–pTA catalyst on glassy carbon electrode in the presence of 1.0 mol dm−3 methanol in 0.5 mol dm−3 KOH under the scan rate of 50 mV s−1 for 500 cycles. (B) The chronoamperometric response for the Pd–pTA catalyst in the presence of 1.0 mol dm−3 methanol and 0.5 mol dm−3 KOH at 30 °C at the fixed potential of 0.07 V for the period of 3000 seconds. (C) Shows the linear relation between the current density (anodic peak during the forward scan) and the cycle number; obtained from the cyclic voltammogram data (A). (D) A fraction of the liner plot; shown by an arrow and (E) current retention graph of the catalyst. | |
The long-term stability and durability of the polymer based catalyst was further examined by chronoamperometric measurements. For methanol oxidation reaction, the catalyst modified electrode was biased at the fixed potential of 0.07 V and the changes of the oxidation current with time (for 3000 seconds) were monitored. Fig. 8B shows the chronoamperometric response of the catalyst (Pd–pTA) for 1.0 mol dm−3 methanol in 0.5 mol dm−3 KOH at 30 °C. For the catalyst, a gradual decay for a period of 750 s, possibly suggesting catalyst poisoning by chemisorbed carbonaceous species formed during the oxidation of methanol, and after that the current appears to be fairly stable within the rest of the time period for the experiment, suggesting the better tolerance of the catalyst at the later stage. A similar incident has also been observed when we have performed the stability study of the catalyst (Fig. 8A). After achieving the highest current density, which is 5.03 mA cm−1, we had allow the instrument to run 500 cycles and we found the net decrease of current density was 0.69 mA cm−2 with the IF/IB ratio for the first scan and the last scan (500th) were 1.939 and 2.011, respectively, has corroborate with the chronoamperometric study. The IF/IB ratio evaluating the tolerance efficiency of the catalyst, higher is the ratio better is the tolerance of the catalyst, which reveal that methanol can be more effectively oxidized on Pd–pTA modified electrode during the forward potential scan to generate relatively less carbon monoxide.
In the Fig. 8C, main panel, a liner plot, obtained from the Fig. 8A, using the peak potential values of the forward scan as a function of cycle number and a small fraction of the plot, has been magnified and marked by an arrow (Fig. 8D), indicates the steadiness of the reaction. Fig. 8E shows the long term performance of the catalyst, with the current retention value of 86.4% (based on the forward peak potential value) after 500 cycles.
A comparative survey on the electro-oxidation of methanol for various palladium based catalysts is incorporated in this report as a ready ref. 46–53 (Table 1, based on the achieved current densities, mA cm−2). From the table we have found that three component MnO2–graphene oxide–Pd nanoparticles catalyst system48 shows the highest performance in terms of current density value (20.4 mA cm−2) for the electro-oxidation of methanol followed by carbon (Vulcan XC-72)–Pd (20 wt%) system (current density: 10 mA cm−2),47 where the Pd loading is very high as compared with the current polymer based system, Pd–pT3A (1.02 wt% of Pd), where we have achieved the highest current density value 5.03 mA cm−2. Other comparable systems, for the electro-oxidation of methanol, are Pd nanoparticles–carbon nanodots49 and palladium selenides50 showed the current density values 3.42 and 3.18 mA cm−2, respectively.
Table 1 A comparative data on the Pd-based catalyst for the electro-oxidation of methanol
Entry |
Catalyst |
Current density (mA cm−2) |
Reference |
1 |
Commercial Pd/C catalyst |
0.36 |
41 |
2 |
Pd-nanoparticles on graphene oxide |
1.6 |
41 |
3 |
Carbon (Vulcan XC-72)–Pd (Pd = 20 wt%) |
10 |
42 |
4 |
MnO2–graphene oxide–Pd nanoparticles |
20.4 |
43 |
5 |
Pd nanoparticles–carbon nanodots |
3.42 |
44 |
6 |
Palladium selenides |
3.18 |
45 |
7 |
Pd–SnO2–TiO2–MWCNT |
0.285 |
46 |
8 |
Electrodeposited Pd on polyaniline |
0.82 |
47 |
9 |
Palladium–polystyrene composite |
0.17 |
48 |
10 |
Pd(I)–poly[4-(thiophen-3yl)-aniline] (Pd = 1.02 wt%) |
5.03 |
Current work |
4. Conclusion
The present article reports a single step synthesis route of Pd–polymer composite material with an excellent performance on methanol oxidation reaction in alkaline media. The simple preparation method as well as the stability and the recyclability performance indicate that the material could have potential in direct methanol fuel cell application. To the best of our knowledge, this is the first kind of report where polymer supported ionic palladium has been used as a catalyst for the electro-oxidation of methanol. But it is also important to mention that during the electrochemical reaction the in situ formation of the palladium nanoparticles has been observed and that could play the role as an efficient catalyst for the significant improvement of the electro-oxidation process of methanol.
Acknowledgements
The author SS acknowledge financial support from the Faculty of Science and Global Excellence and Stature fellowship from the University of Johannesburg. MC acknowledges financial support from the National Research Foundation (NRF), South Africa. KM also acknowledges financial support from Faculty of Science, University of Johannesburg and National Research Foundation (NRF), South Africa.
References
- J. Hassan, M. Sevignon, C. Gozzi, E. Schulz and M. Lemaire, Chem. Rev., 2002, 102, 1359 CrossRef CAS PubMed.
- N. Miyaura and A. Suzuki, Chem. Rev., 1995, 95, 2457 CrossRef CAS.
- A. J. Bard, Science, 1980, 207, 139 CAS.
- Y. Mizukoshi, K. Okitsu, Y. Maeda, T. A. Yamamoto, R. Oshima and Y. Nagata, J. Phys. Chem. B, 1997, 101, 7033 CrossRef CAS.
- S. Scalzullo, K. Mondal, M. Witcomb, A. Deshmukh, M. Scurrell and K. Mallick, Nanotechnology, 2008, 19, 075708 CrossRef PubMed.
- M. Choudhary, R. Islam, M. Witcomb and K. Mallick, Dalton Trans., 2014, 43, 6396–6405 RSC.
- M. Choudhary, S. Siwal, D. Nandi and K. Mallick, New J. Chem., 2016, 40, 2296–2303 RSC.
- S. Mahato, R. Islam, C. Acharya, M. Witcomb and K. Mallick, ChemCatChem, 2014, 6, 1419–1426 CAS.
- R. Islam, S. Mahato, S. Sukla, M. Witcomb and K. Mallick, ChemCatChem, 2013, 5, 2453–2461 CrossRef.
- M. Choudhary, R. Islam, M. Witcomb, M. Phali and K. Mallick, Appl. Organomet. Chem., 2013, 27, 523 CrossRef CAS.
- H. J. Huang and X. Wang, Phys. Chem. Chem. Phys., 2013, 15, 10367–10375 RSC.
- N. Hoshi, K. Kida, M. Nakamura, M. Nakada and K. Osada, J. Phys. Chem. B, 2006, 110, 12480–12484 CrossRef CAS PubMed.
- H. T. Zheng, Y. Li, S. Chen and P. K. Shen, J. Power Sources, 2006, 163, 371 CrossRef CAS.
- C. W. Xu, L. Cheng, P. K. Shen and Y. L. Liu, Electrochem. Commun., 2007, 9, 997 CrossRef CAS.
- F. P. Hu, Z. Y. Wang, Y. L. Li, C. M. Liu, X. Zhang and P. K. Shen, J. Power Sources, 2008, 177, 61 CrossRef CAS.
- V. Bambagioni, C. Bianchini, A. Marchionni, J. Filippi, F. Vizza, J. Teddy, P. Serp and M. Zhiani, J. Power Sources, 2009, 190, 241 CrossRef CAS.
- S. Ghosh, H. Remita, P. Kar, S. Choudhury, S. Sardar, P. Beaunier, P. Roy, S. Bhattacharya and S. Pal, J. Mater. Chem. A, 2015, 3, 9517–9527 CAS.
- K. Zhang, D. Guo, X. Liu, J. Li, H. Li and Z. Su, J. Power Sources, 2006, 162, 1077–1081 CrossRef CAS.
- M. Xu, G. Gao, W. Zhou, K. Zhang and H. Li, J. Power Sources, 2008, 175, 217–220 CrossRef CAS.
- R. Singh and R. Awasthi, Catal. Sci. Technol., 2011, 1, 778–783 Search PubMed.
- Y. Zhao, L. Zhan, J. Tian, S. Nie and Z. Ning, Electrochim. Acta, 2011, 56, 1967–1972 CrossRef CAS.
- S. Ghosh, A. Teillout, D. Floresyona, P. de Oliveira, A. Hagège and H. Remita, Int. J. Hydrogen Energy, 2015, 40, 4951–4959 CrossRef CAS.
- C. Hable and M. Wrighton, Langmuir, 1993, 9, 3284–3290 CrossRef CAS.
- S. Ghosh, M. Thandavarayan and R. Basu, Nanoscale, 2016, 8, 6921–6947 RSC.
- S. Ghosh, K. Natalie, S. Remita, L. Ramos, F. Goubard, P. Aubert, A. Deniset-Besseau and H. Remita, Sci. Rep., 2015, 5, 18002 CrossRef CAS PubMed.
- Z. Yin and Q. Zheng, Adv. Energy Mater., 2012, 2, 179–218 CrossRef CAS.
- K. Mallick, M. Witcomb, A. Dinsmore and M. Scurrell, Langmuir, 2005, 21, 7964–7967 CrossRef CAS PubMed.
- K. Mallick, M. Witcomb, A. Dinsmore and M. Scurrell, Macromol. Rapid Commun., 2005, 26, 232–235 CrossRef CAS.
- K. Mallick, M. Witcomb and M. Scurrell, Eur. Phys. J. E, 2006, 19, 149–154 CrossRef CAS PubMed.
- K. Mallick, M. Witcomb and M. Scurrell, Eur. Polym. J., 2006, 42, 670–675 CrossRef CAS.
- K. Mallick, M. Witcomb and M. Scurrell, Eur. Phys. J. E, 2006, 20, 347–353 CrossRef CAS PubMed.
- J. P. Mathew and M. Srinivasan, Eur. Polym. J., 1995, 31, 835 CrossRef CAS.
- A. K. Zharmagambetova, V. A. Golodov and Y. P. Saltykov, J. Mol. Catal., 1989, 55, 406 CrossRef CAS.
- P. R. Likhar, M. Roy, S. Roy, M. S. Subhas, M. L. Kantam and B. Sreedhara, Adv. Synth. Catal., 2008, 350, 1968 CrossRef CAS.
- J. Y. Shimano and A. G. MacDiarmid, Synth. Met., 2001, 123, 251 CrossRef CAS.
- D. L. Wise, G. E. Wnek, D. Trantlolo, T. M. Cooper and J. D. Gresser, Photonic polymer systems-Fundamentals, methods and applications, Marcel Dekker, Inc, 1998, New York, ISBN: 9780824701529 Search PubMed.
- J. Liu, Y. Shi and Y. Yang, Appl. Phys. Lett., 2001, 79, 578 CrossRef CAS.
- A. A. El-Azhary and R. H. Hilal, Spectrochim. Acta, 1997, 53, 1365 CrossRef.
- D. W. J. Scott, J. Mol. Spectrosc., 1969, 31, 451 CrossRef CAS.
- K. Mallick, M. Witcomb and M. Scurrell, J. Phys.: Condens. Matter, 2007, 19, 196225 CrossRef.
- K. Mallick, M. Witcomb, R. Erasmus and A. Strydom, J. Appl. Phys., 2009, 106, 074303 CrossRef.
- A. Taher, D. Nandi, M. Choudhary and K. Mallick, New J. Chem., 2015, 39, 5589–5596 RSC.
- O. Shishilov, T. Stromnova, J. Cámpora, P. Palma, M. Ángeles-Cartes and L. Martínez-Prieto, Dalton Trans., 2009, 33, 6626–6633 RSC.
- J. M. Davidson and C. Triggs, J. Chem. Soc. A, 1968, 1324–1330 RSC.
- M. Prodromidis, E. Zahran, A. Tzakos and L. Bachas, Int. J. Hydrogen Energy, 2015, 40, 6745–6753 CrossRef CAS.
- H. Li, G. Chang, Y. Zhang, J. Tian, S. Liu, Y. Luo, A. Asiri, A. Al-Youbi and X. Sun, Catal. Sci. Technol., 2012, 2, 1153–1156 CAS.
- G. Hu, F. Nitze, H. Barzegar, T. Sharifi, A. Mikolajczuk, C. Tai, A. Borodzinski and T. Wågberg, J. Power Sources, 2012, 209, 236–242 CrossRef CAS.
- R. Liu, H. Zhou, J. Liu, Y. Yao, Z. Huang, C. Fu and Y. Kuang, Electrochem. Commun., 2013, 26, 63–66 CrossRef CAS.
- W. Wei and W. Chen, J. Power Sources, 2012, 204, 85–88 CrossRef CAS.
- Madhu and R. Singh, Int. J. Hydrogen Energy, 2011, 36, 10006–10012 CrossRef CAS.
- H. An, L. Pan, H. Cui, B. Li, D. Zhou, J. Zhai and Q. Li, Electrochim. Acta, 2013, 102, 79–87 CrossRef CAS.
- D. Hatchett, N. Millick, J. Kinyanjui, S. Pookpanratana, M. Bar, T. Hofmann, A. Luinetti and C. Heske, Electrochim. Acta, 2011, 56, 6060–6070 CrossRef CAS.
- N. Zhang, B. Guo, H. Liu, P. Liu, G. Liu and J. Cheng, RSC Adv., 2016, 6, 1376–1379 RSC.
Footnote |
† Electronic supplementary information (ESI) available. See DOI: 10.1039/c6ra05811f |
|
This journal is © The Royal Society of Chemistry 2016 |
Click here to see how this site uses Cookies. View our privacy policy here.