Enzymatic manipulation of a DNA-mediated ensemble for sensitive fluorescence detection of glucose†
Yaoping Jianga,
Wenhao Luoa,
Xiaopei Wanga,
Youhui Lin*a and
Xiang Yang Liuab
aResearch Institute for Biomimetics and Soft Matter, Fujian Provincial Key Laboratory for Soft Functional Materials Research, Department of Physics, Xiamen University, Xiamen 361005, China. E-mail: linyouhui@xmu.edu.cn
bDepartment of Physics, National University of Singapore, 2 Science Drive 3, Singapore, 117542, Singapore
First published on 30th March 2016
Abstract
Recently small molecules with fluorescence properties sensitive to DNA have been identified as efficient fluorescent probes. Herein, controllable turn off/on fluorescent sensors for label-free detection of glucose have been successfully developed by designing different DNA/ligand-based ensembles and using the enzyme-catalyzed Fenton reaction. The sensing approach is essentially based on enzymatic manipulation of a DNA-mediated ensemble through cascade reactions, including oxidation of glucose by oxygen to yield hydrogen peroxide, the Fenton reaction of H2O2 resulting in the formation of aggressive hydroxyl radicals (˙OH), and then the oxidative cleavage of ssDNA with ˙OH. Interestingly, the fact that the properties of DNA-mediated ensembles are highly dependent on the nature of ligands opens the opportunity to modulate the response patterns of fluorescent probes to glucose simply by choosing some appropriate ligands. Additionally, the protocol shows excellent selectivity, and visual detection is possible with the aid of an UV transilluminator. Moreover, this method can also be extended as a novel analytical platform for other reactions that involve the H2O2 concentration evolution.
Introduction
There is considerable interest in the development of sensors owing to their broad utility in a wide range of practical applications such as biomedical detection and diagnostics.1–4 Among the various reported methods, fluorescent biosensors is a particularly active research field owing to their ultrasensitivity, operation convenience, wide dynamic ranges, and multiplicity of measurable parameters.5 On the basis of fluorescence resonance energy transfer, photo-induced electron transfer, excited-state intramolecular proton transfer, and internal charge transfer mechanisms, a variety of fluorescent probes based on quantum dots,6,7 upconversion nanostructures,8,9 fluorescent dye-doped silica nanoparticle,10 small-molecule fluorophores,11–13 and conjugated polymers14,15 have been successfully developed. Especially, many small molecules with fluorescence properties sensitive to DNA are identified as efficient fluorescent probes.16–21 They show strong or negligible fluorescence in solution; whereas in the presence of DNA, they become very weak or intensely fluorescent as a result of the strong interaction between these complexes and DNA. Consequently, effective control of the interaction of ligands and DNA by analytes can yield a facile but powerful strategy to fabricate fluorescent sensors. Since the fluorescence changes of DNA-mediated ensembles are crucially dependent on the properties of ligands, the response patterns of fluorescent probe to a specific analyte can be easily modulated by changing ligands. So far, a number of these complexes have been used to detect metal ions, DNA and protein.16–21 On the other hand, glucose detection plays a vital role in controlling various food and biotechnological processes as well as in clinical diagnosis of diabetes and some other metabolic disorders.22 Therefore, until now, a number of glucose sensors including fluorescence,23–27 colorimetry,28,29 electrochemical techniques,30–32 and Raman scattering,33 have been reported. Recently, fluorescent glucose sensors have attracted particular attention due to their high sensitivity, multiplicity of measurable parameters, excellent spatial and temporal resolution, and little or no damage to the host system.34Herein, by taking advantage of enzymatic manipulation of DNA-mediated ensemble through cascade reactions, we report controllable turn off/on fluorescent sensors for sensitive and selective detection of glucose (Scheme 1). In our study, ligand 1 (thiazole orange) and ligand 2 (a perylene derivative) were chosen as fluorescence indicators in DNA-templated ensembles. The interactions between ligands and DNA result in remarkable fluorescence change; and interestingly, different ensembles could have distinct response patterns towards the same analyte, i.e. turn-off pattern or turn-on pattern. For ligand 1, it is one of popular asymmetric cyanines, which consists of two aromatic ring systems. It is weakly fluorescent, but exhibits a dramatic increase in its fluorescence after binding with single-stranded DNA (ssDNA).35 The mechanism of fluorescence enhancement the channel for non-radiative decay has been closed by restricting the rotation around the bond between the aromatic systems. In the presence of glucose, ssDNA is cleaved into small fragments through cascade reactions, which include glucose oxidation by oxygen to yield hydrogen peroxide (H2O2), the Fenton reaction of H2O2 resulting in the formation of aggressive hydroxyl radicals (˙OH), and then the oxidative cleavage of ssDNA with ˙OH. Since the interaction between ligand 1 and the fragmented DNA becomes negligible, the released ligand 1 spontaneously returns to the non-fluorescent state. By contrast, ligand 2 is strong in solution, but become weakly fluorescent after aggregation through self-assembly on DNA. Upon cleavage of ssDNA, the fluorescence of ligand 2 can be restored.18,21 In both cases, the resulting changes in fluorescence intensity enable label-free and convenient detection of glucose.
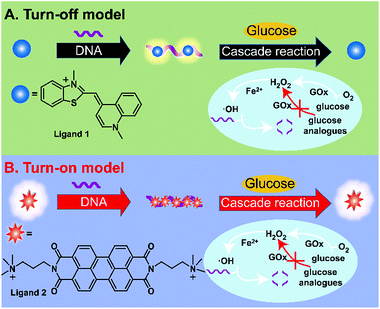 | ||
| Scheme 1 Schematic representation of turn-on and turn-off fluorescent detection of glucose based on enzyme-catalyzed Fenton reaction. The molecular structures of ligand 1 and ligand 2 are shown. | ||
Experimental section
Reagents and materials
Ligand 1 (thiazole orange) was purchased from Aldrich and used without further purification. The concentration of ligand 1 was determined using an extinction coefficient of 63![[thin space (1/6-em)]](https://www.rsc.org/images/entities/char_2009.gif) 000 M−1 cm−1 at 500 nm. Ligand 2 (a perylene derivative) was prepared as previous reported.18 Glucose and FeCl2·4H2O were purchased from Sinopharm Chemical Reagent Co. (Shanghai, China). Hydrogen peroxide was obtained from Beijing Chemicals (Beijing, China). DNA and glucose oxidase (EC 1.1.3.4) was obtained from by Shanghai Sangon Biological Engineering Technology & Services (Shanghai, China). The sequences of DNA are as follows:
000 M−1 cm−1 at 500 nm. Ligand 2 (a perylene derivative) was prepared as previous reported.18 Glucose and FeCl2·4H2O were purchased from Sinopharm Chemical Reagent Co. (Shanghai, China). Hydrogen peroxide was obtained from Beijing Chemicals (Beijing, China). DNA and glucose oxidase (EC 1.1.3.4) was obtained from by Shanghai Sangon Biological Engineering Technology & Services (Shanghai, China). The sequences of DNA are as follows:
ssDNA: 5′-TTT-ACT-CTT-CAC-ATG-CTA-GAT-3′;
G-quadruplex: 5′-GGG-TTT-TGG-GTT-TTG-GGT-TTT-GGG-3′.
All other reagents were of analytical reagent grade, and used as received. Nanopure water (18.2 MΩ; Millipore Co., USA) was used throughout the experiment.
Measurements and characterizations
The fluorescence spectra were recorded using a JASCO FP6500 spectrophotometer (JASCO International Co., LTD., Tokyo, Japan). The concentration of DNA was determined using a JASCO V-550 UV/visible spectrophotometer, equipped with a temperature-controlled cuvette holder.Fluorescence assay of glucose detection
In a typical procedure, solutions of ligand 1 (or 2)/DNA/Fe2+, (ligand 1 = 0.1 μM, ligand 2 = 1 μM, DNA = 0.15 μM, Fe2+ = 30 μM) were prepared in 400 μl of Tris–HCl buffer. The GOx solutions were mixed with different concentrations of glucose in Tris–HCl buffer. After the mixtures incubated for 1 h at room temperature, the mixtures were added into above solutions containing ligand 1 (or 2)/DNA/Fe2+ in portions. For ligand 1 based samples, they were excited at 490 nm, and emission spectra were collected from 500 to 650 nm. For ligand 2 based samples, they were excited at 500 nm, and emission spectra were collected from 510 to 650 nm.Results and discussion
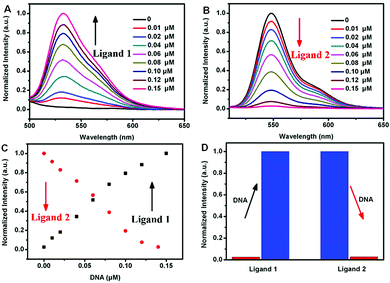
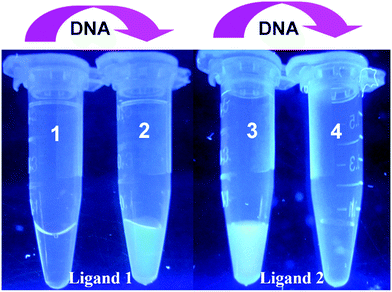
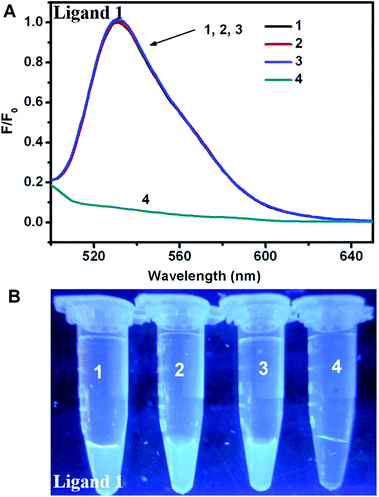
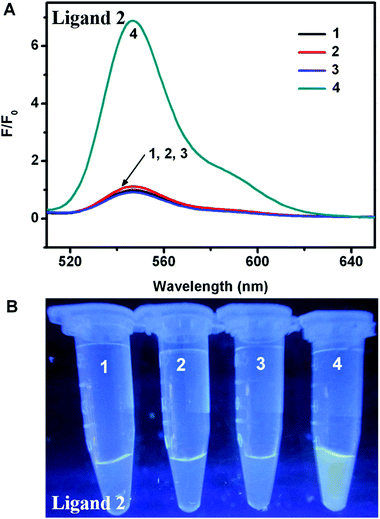
To optimize the concentration of DNA, the fluorescence changes from the interaction of different ligands and DNA were firstly evaluated. As seen in Fig. 1, distinct fluorescent response patterns toward ssDNA occurred by employing different ligands. The fluorescence signal of ligand 1 raised promptly with increasing of the DNA concentration, however, the fluorescence decrease of ligand 2 was observed under the same conditions. The above results showed that ligand 1 and ligand 2 had different fluorescence response patterns to ssDNA. Moreover, under UV illumination, we could readily distinguish the fluorescence difference for the ligand solution in the presence or absence of DNA by the naked eye (Fig. 2). The solution containing ligand 1 alone or the ligand 2-DNA complex exhibited no emission, however the solution containing ligand 2 alone or the ligand 1-DNA complex exhibited bright yellow light (Fig. 2). The result of the fluorescence image was consistent with the change in the fluorescence spectra.Next, we evaluated the fluorescence changes of different DNA-mediated ensembles in the presence of Fenton reagents. As shown in Fig. S1,† the fluorescence of bioprobes can be enhanced or quenched in the presence of ssDNA and Fe2+. Upon addition of H2O2 to the mixture, the Fenton reaction can generate aggressive ˙OH from H2O2 by reduction with Fe2+, and then ssDNA can be cleaved by ˙OH into small fragments.28 Owing to the weak interaction between ligands and the fragmented DNA, each released dye molecule spontaneously returns to their initial state. That is, fluorescence enhancement was observed for ligand 2, whereas reduced fluorescence was seen for ligand 1 (Fig. S1†). As H2O2 is the main product of glucose oxidase (GOx)-catalyzed reaction, fluorescence monitoring of glucose could also be realized. As expected, when Fe2+ and GOx–glucose incubation solutions were added to DNA/ligand-based ensembles, the different fluorescence changes were observed (Fig. 3 and 4). By comparison, neither glucose nor GOx alone could introduce any fluorescence changes. Controlled experiment with G-quadruplex and N-methyl mesoporphyrin IX dye (NMM, a specific G-quadruplex binder)36 further confirmed the generality of our method (Fig. S2†). The above results imply that the ligand/DNA complexes might act as simple fluorescent probes for sensing glucose.
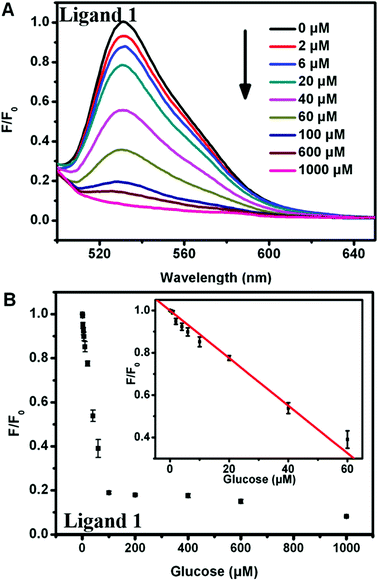
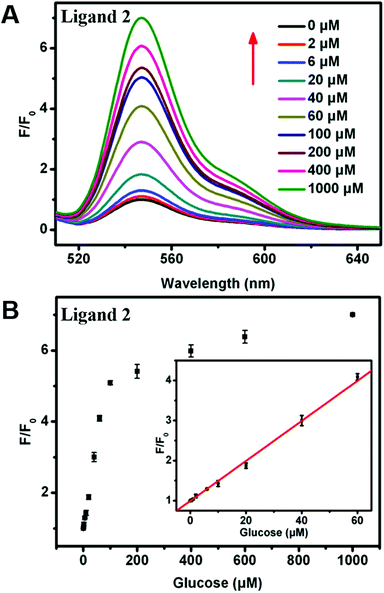
To assess the sensitivity of our sensing systems, the fluorescence changes were further monitored by adding increasing glucose concentrations. For the turn-off sensor, the fluorescence intensity of the ligand 1-ssDNA complex gradually declined when the concentration of glucose was increased from 0 to 1 mM, indicating that the DNA cleavage and ligand 1 release were highly dependent on the concentration of glucose (Fig. 5A and B). Through monitoring the fluorescence change at the emission maximum of 530 nm (I530), a good linear relationship between the fluorescence intensity and glucose concentration can be seen over the range of 0–60 μM, with a detection limit of 0.8 μM. By contrast, a fluorescence turn-on assay for glucose with high sensitivity was realized by choosing ligand 2-DNA complex. As shown in Fig. 6A and B, the fluorescence of the ligand 2-ssDNA complex is activated by glucose, and the fluorescence intensity increased with the increasing of glucose content. The fluorescence intensity at 548 nm (I548) was plotted as a function of glucose concentration, and the value of I548 increased with increasing of the glucose content before reaching a plateau. A linear response of fluorescence intensity vs. [glucose] in the range of 0–60 μM was obtained, with a detection limit of 0.4 μM. Taken together, the fluorescence response in both cases proved to be sensitive; our detection limit is better than or at least comparable to the values obtained by those fluorescence assay using Mn-doped ZnS, CdSe/ZnS, or Si quantum dots as sensing element.25–27 Certainly, this method could also be used to directly assay H2O2 with high sensitivity (Fig. S3† and S4†). This approach avoids the need of oligonucleotide modification, which provides the advantages of cost efficiency and simplicity. Therefore, these observations demonstrate that our sensing systems can be an additional facile but sensitive method for glucose and H2O2 detection.
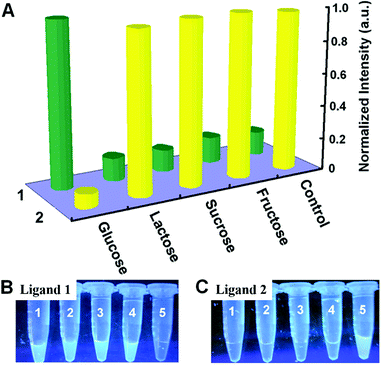
To investigate whether this assay platform is selective towards glucose, the influence of glucose analogues, such as fructose, lactose, and maltose, was also tested. As shown in Fig. 7A, only the presence of 1 mM glucose yielded a dramatic fluorescence changes (i.e. an obvious decrease for ligand 1-based sensing system and a remarkable increase for ligand 2-based sensing system). Whereas even when glucose analogues were added at concentrations as high as 5 mM, no significant fluorescence changes were occurred. Furthermore, with or without glucose, the differences for both systems could be easily distinguished by the naked eye with the help of an UV transilluminator (Fig. 7B and C). These results demonstrated both turn off/on biosensing systems are highly selective for glucose. And the excellent selectivity is attributed to the enzymatic specificity of GOx. In the presence of O2, GOx can catalytically oxidize glucose, producing gluconic acid and H2O2. However, they cannot catalytically oxidize glucose analogues under the same conditions. As a result, only in the presence of glucose, ssDNA can be cleaved into small fragments through cascade reactions.
Conclusions
In summary, label-free and controllable turn off/on fluorescent sensors for detection of glucose have been demonstrated. Our approach presented here is essentially based on enzymatic manipulation of DNA-mediated ensemble through cascade reactions. At this stage, low stability of GOx might limit the effectiveness of our strategy, future work need to continue to resolve the low stability of GOx by enzyme immobilization.37 The sensing approach here is simple, convenient, sensitive, and highly selective, without any special steps such as oligonucleotide labeling and separation. In addition, the detection and discrimination process can be simply identified by the naked eye under UV illumination. Moreover, these proof-of-concept examples offer a rich opportunity to modulate the response patterns of sensing systems to a specific analyte through changing suitable ligands. We envisage that this method can also be extended as a novel analytical platform for other reactions that involves the H2O2 concentration evolution, such as the detection of lactic acid (catalyzed with lactate oxidase), glutamate (catalyzed with glutamate oxidase), and choline (catalyzed with choline oxidase).38,39Acknowledgements
This work is financially supported by 111 project (B16029), National Nature Science Foundation (No. 21401154, U1405226), Guangdong Natural Science Foundation (No. 2014A030310005), the Fundamental Research Funds for the Central Universities of China (No. 20720140528), Fujian Provincial Department of Science & Technology (2014H6022).Notes and references
- J. Kirsch, C. Siltanen, Q. Zhou, A. Revzin and A. Simonian, Chem. Soc. Rev., 2013, 42, 8733–8768 RSC.
- W. C. W. Chan, D. J. Maxwell, X. Gao, R. E. Bailey, M. Han and S. Nie, Curr. Opin. Biotechnol., 2002, 13, 40–46 CrossRef CAS PubMed.
- E. Hendry, T. Carpy, J. Johnston, M. Popland, R. V. Mikhaylovskiy, A. J. Lapthorn, S. M. Kelly, L. D. Barron, N. Gadegaard and M. Kadodwala, Nat. Nanotechnol., 2010, 5, 783–787 CrossRef CAS PubMed.
- R. Bonomi, A. Cazzolaro, A. Sansone, P. Scrimin and L. J. Prins, Angew. Chem., Int. Ed., 2011, 50, 2307–2312 CrossRef CAS PubMed.
- C. Li, T. Wu, C. Hong, G. Zhang and S. Liu, Angew. Chem., Int. Ed., 2012, 51, 455–459 CrossRef CAS PubMed.
- M. Bruchez, M. Moronne, P. Gin, S. Weiss and A. P. Alivisatos, Science, 1998, 281, 2013–2016 CrossRef CAS PubMed.
- M. Han, X. Gao, J. Z. Su and S. Nie, Nat. Biotechnol., 2001, 19, 631–635 CrossRef CAS PubMed.
- F. Wang and X. G. Liu, Chem. Soc. Rev., 2009, 38, 976–989 RSC.
- F. Wang, D. Banerjee, Y. S. Liu, X. Y. Chen and X. G. Liu, Analyst, 2010, 135, 1839–1854 RSC.
- S. W. Bae, W. H. Tan and J. I. Hong, Chem. Commun., 2012, 48, 2270–2282 RSC.
- K. Wang, Z. Tang, C. J. Yang, Y. Kim, X. Fang, W. Li, Y. Wu, C. D. Medley, Z. Cao, J. Li, P. Colon, H. Lin and W. Tan, Angew. Chem., Int. Ed., 2009, 48, 856–870 CrossRef CAS PubMed.
- J. D. Luo, Z. L. Xie, J. W. Y. Lam, L. Cheng, H. Y. Chen, C. F. Qiu, H. S. Kwok, X. W. Zhan, Y. Q. Liu, D. B. Zhu and B. Z. Tang, Chem. Commun., 2001, 1740–1741 RSC.
- Y. Hong, J. W. Y. Lam and B. Z. Tang, Chem. Soc. Rev., 2011, 40, 5361–5388 RSC.
- X. L. Feng, L. B. Liu, S. Wang and D. B. Zhu, Chem. Soc. Rev., 2010, 39, 2411–2419 RSC.
- L. Wang, K.-Y. Pu, J. Li, X. Qi, H. Li, H. Zhang, C. Fan and B. Liu, Adv. Mater., 2011, 23, 4386–4391 CrossRef CAS PubMed.
- Y. Hong, M. Häußler, J. W. Y. Lam, Z. Li, K. K. Sin, Y. Dong, H. Tong, J. Liu, A. Qin, R. Renneberg and B. Z. Tang, Chem.–Eur. J., 2008, 14, 6428–6437 CrossRef CAS PubMed.
- M. Wang, D. Zhang, G. Zhang, Y. Tang, S. Wang and D. Zhu, Anal. Chem., 2008, 80, 6443–6448 CrossRef CAS PubMed.
- B. Wang and C. Yu, Angew. Chem., Int. Ed., 2010, 49, 1485–1488 CrossRef CAS PubMed.
- Y. Zhou, M. Deng, Y. Du, S. Yan, R. Huang, X. Weng, C. Yang, X. Zhang and X. Zhou, Analyst, 2011, 136, 955–961 RSC.
- S. Yan, R. Huang, Y. Zhou, M. Zhang, M. Deng, X. Wang, X. Weng and X. Zhou, Chem. Commun., 2011, 47, 1273–1275 RSC.
- X. J. Yang, F. Pu, J. S. Ren and X. G. Qu, Chem. Commun., 2011, 47, 8133–8135 RSC.
- Y. Tatsu and S. Yamamura, J. Mol. Catal. B: Enzym., 2002, 17, 203–206 CrossRef CAS.
- Y. Liu, C. Deng, L. Tang, A. Qin, R. Hu, J. Z. Sun and B. Z. Tang, J. Am. Chem. Soc., 2011, 133, 660–663 CrossRef CAS PubMed.
- H.-B. Wang, H.-D. Zhang, Y. Chen, Y. Li and T. Gan, RSC Adv., 2015, 5, 77906–77912 RSC.
- Y. Yi, J. Deng, Y. Zhang, H. Li and S. Yao, Chem. Commun., 2013, 49, 612–614 RSC.
- P. Wu, Y. He, H.-F. Wang and X.-P. Yan, Anal. Chem., 2010, 82, 1427–1433 CrossRef CAS PubMed.
- L. Bahshi, R. Freeman, R. Gill and I. Willner, Small, 2009, 5, 676–680 CrossRef CAS PubMed.
- Y. Jiang, H. Zhao, Y. Lin, N. Zhu, Y. Ma and L. Mao, Angew. Chem., Int. Ed., 2010, 49, 4800–4804 CrossRef CAS PubMed.
- Y. Song, K. Qu, C. Zhao, J. Ren and X. Qu, Adv. Mater., 2010, 22, 2206–2210 CrossRef CAS PubMed.
- Y. Xiao, F. Patolsky, E. Katz, J. F. Hainfeld and I. Willner, Science, 2003, 299, 1877–1881 CrossRef CAS PubMed.
- P. Si, Y. Huang, T. Wang and J. Ma, RSC Adv., 2013, 3, 3487–3502 RSC.
- C. Chen, Q. Xie, D. Yang, H. Xiao, Y. Fu, Y. Tan and S. Yao, RSC Adv., 2013, 3, 4473–4491 RSC.
- K. E. Shafer-Peltier, C. L. Haynes, M. R. Glucksberg and R. P. Van Duyne, J. Am. Chem. Soc., 2003, 125, 588–593 CrossRef CAS PubMed.
- J. C. Pickup, F. Hussain, N. D. Evans, O. J. Rolinski and D. J. S. Birch, Biosens. Bioelectron., 2005, 20, 2555–2565 CrossRef CAS PubMed.
- F. Pu, Z. Huang, J. Ren and X. Qu, Anal. Chem., 2010, 82, 8211–8216 CrossRef CAS PubMed.
- D. Hu, Z. Huang, F. Pu, J. Ren and X. Qu, Chem.–Eur. J., 2011, 17, 1635–1641 CrossRef CAS PubMed.
- L. Cao, J. Ye, L. Tong and B. Tang, Chem.–Eur. J., 2008, 14, 9633–9640 CrossRef CAS PubMed.
- K. M. Mitchell, Anal. Chem., 2004, 76, 1098–1106 CrossRef CAS PubMed.
- J. J. Burmeister, M. Palmer and G. A. Gerhardt, Biosens. Bioelectron., 2005, 20, 1772–1779 CrossRef CAS PubMed.
Footnote |
| † Electronic supplementary information (ESI) available. See DOI: 10.1039/c6ra05701b |
| This journal is © The Royal Society of Chemistry 2016 |

