Tuning the composition of gold–silver bimetallic nanoparticles for the electrochemical reduction of hydrogen peroxide and nitrobenzene

N. S. K. Gowthaman, Bharathi Sinduja and S. Abraham John*
Centre for Nanoscience and Nanotechnology, Department of Chemistry, Gandhigram Rural Institute, Gandhigram-624302, Dindigul, Tamilnadu, India. E-mail: abrajohn@yahoo.co.in; s.abrahamjohn@ruraluniv.ac.in; Fax: +91 451 245 3031; Tel: +91 451 245 2371

Received 3rd March 2016 , Accepted 27th June 2016

First published on 29th June 2016


Abstract

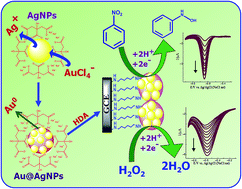
This paper reports the synthesis of gold–silver bimetallic nanoparticles (Au–AgNPs) with different Ag[thin space (1/6-em)]:[thin space (1/6-em)]Au compositions in an aqueous medium and their attachment on a glassy carbon electrode (GCE) via a 1,6-hexadiamine (HDA) linker for the electrochemical reduction of hydrogen peroxide (HP) and nitrobenzene (NB). Initially, silver nanoparticles (AgNPs) were synthesized by the reduction of silver nitrate using trisodium citrate as a capping agent and sodium borohydride as a reducing agent. Then, the Au–AgNPs were prepared by the galvanic displacement of Ag(0) by AuCl4 ions. The composition of the Au–AgNPs was varied by changing the mole ratio of Ag[thin space (1/6-em)]:[thin space (1/6-em)]Au in the range of 1[thin space (1/6-em)]:[thin space (1/6-em)]0 to 1[thin space (1/6-em)]:[thin space (1/6-em)]0.16. TEM images show that the Au–AgNPs were spherical in shape with a diameter of ∼16 nm. The prepared colloidal solution of Au–AgNPs were then attached on a HDA modified GCE through the Michael's addition reaction and were confirmed by UV-vis diffuse reflectance spectroscopy (DRS), atomic force microscopy (AFM), line scanning analysis, cyclic voltammetry (CV) and electrochemical impedance spectroscopy (EIS). The AFM image shows that the Au–AgNPs were densely packed on the electrode surface. The Au–AgNPs modified electrode exhibits a higher heterogeneous electron transfer rate constant of 2.77 × 10⁻⁷ cm s−1 when compared to Ag and AuNPs modified electrodes. Furthermore, the electrocatalytic activity of the Au–AgNPs modified electrode was examined by studying the reduction of HP and NB. It was found that the Au–AgNPs with the Ag[thin space (1/6-em)]:[thin space (1/6-em)]Au mole ratio of 1[thin space (1/6-em)]:[thin space (1/6-em)]0.12 showed excellent electrocatalytic activity towards the reduction of both HP and NB by not only shifting their reduction potentials toward less negative potentials but also enhanced their currents compared to the bare GCE, Ag and AuNPs modified electrodes and Au–AgNPs of other molar ratios. The present modified electrode shows the limit of detection of 0.12 and 0.23 μM (S/N = 3) for HP and NB, respectively.


Introduction

Bimetallic nanoparticles (BMNPs) composed of two different metal elements exhibit higher catalytic, electronic, optical and surface enhanced Raman scattering (SERS) properties than the corresponding monometallic particles due to the bi-functional or synergistic effect induced by charge transfer from one metal to the other.1–3 The structure of BMNPs is defined by the distribution modes of two elements that can be oriented in different ways including a random alloy or an alloy with an inter-metallic compound, cluster-in-cluster and core–shell structure.1 The properties of BMNPs can vary significantly with respect to their size, shape and chemical composition.3–5 Therefore, synthesis of BMNPs with controlled morphology and composition are the important tasks for the researchers. Although few methods are available in the literature for the synthesis of BMNPs, they either involved tedious procedure or several steps.4,6–9 Therefore, development of a simple method is still required for specific applications. Among the wide range of bimetallic systems, gold–silver (Au–Ag) BMNPs with different structures and compositions have gained considerable attention in the fields of catalysis, photonics, electronics, plasmonics, optical sensing, biosensing, drug delivery and SERS.4,6–10 Since the lattice constants and the face centered crystal structure of the Au and AgNPs are similar, synthesis of Au–AgNPs is quite facile.9 Generally, the plasmonic absorption for spherical Au and AgNPs is restricted to around 520 and 400 nm, respectively.8,9 In contrast, by combining these two metals into a single entity the localized surface plasmon resonance (SPR) can be tuned continuously.8 However, the concentrations of Au and Ag salts must be carefully controlled to avoid the formation of insoluble halide precipitations because they contaminate the alloy NPs.11

In recent years, several methods have been used to synthesize Au–AgNPs which include co-reduction of metal ion precursors,12 galvanic replacement reaction,13,14 sonochemistry15 and laser ablation16 both in organic and aqueous solutions stabilized with various capping agents. Among these methods, galvanic replacement method gains considerable attention due to ease of handling, cost effectiveness, high throughput and simple experimental set up.13,14 This method is driven by an electroless mechanism, which involves spontaneous reduction of metal ions to metallic particles and films in the absence of external sources of electric current and reducing agent. The electrons involved in the reduction are derived from the bonding electrons of the surface lattice and the deposition proceeds as long as ions can permeate and electrons can transfer through the film.17 The Au–AgNPs modified electrodes have fascinating potential applications in many fields such as sensing and detection of toxic chemicals, tunable catalysis, drug delivery and SERS.6–10

Nowadays, considerable attention has been paid to the detection of hydrogen peroxide (HP), owing to its wide applications in food process, pulp and paper bleaching, textile industry, pharmaceutical industry, clinical laboratory, medical diagnostics and biochemistry.18,19 Electrochemical method is obviously a good choice for the accurate and sensitive detection of HP.20,21 Even though the enzyme based biosensors show good sensitivity, they have several drawbacks which include complicated immobilization procedure and easily affected by the environment besides they are more expensive.22 Therefore, development of a non-enzymatic HP sensor is highly desirable. Recently, Yang et al. prepared Au–Ag core@shell nanorods by seed mediated method for the determination of HP.21 Li et al. synthesized Au@AgNPs by seed mediated method for the reduction of HP.23 On the other hand, nitrobenzene (NB) is a lipophilic bipolar compound that can be hydrolysed to form various nitrophenols and phenol or it can be reduced to phenylhydroxylamine and then converted into aniline.24 It is widely used to produce aniline, dyes, pesticides and drugs in the chemical industry.25,26 The presence of strong electron affinity nitro group in NB makes it stable.27 However, NB is harmful when its concentration is 0.11 mgL−1 and it attacks nervous and blood system leading to liver cancer.25 Therefore, quantitative determination of NB is highly essential.

The objective of the present study is to synthesize Au–AgNPs and their electrocatalytic activity towards the reduction of nitrobenzene (NB) and hydrogen peroxide (HP) after attached on glassy carbon electrode (GCE). The present method involves the synthesis of AgNPs using sodium borohydride as a reducing agent and trisodium citrate as a capping agent followed by galvanic replacement reaction between Ag atom and AuCl4 ions. The ease of handling, less time consumption and the absence of reducing agent, heating and electric current are the main advantages of the present method of Au–AgNPs synthesis. The as synthesized colloidal Au–AgNPs were characterized by UV-vis spectroscopy, transmission electron microscopy (TEM) and X-ray diffraction method (XRD). The TEM image shows that the formed BMNPs were spherical with an average size of ∼16 nm and having core–shell structure. Then, the colloidal solution of Au–AgNPs were attached on GCE through Michael's addition reaction using 1,6-hexadiamine as a linker. The attached Au–AgNPs modified electrode was characterized by cyclic voltammetry (CV), scanning electron microscopy (SEM), atomic force microscopy (AFM) and energy dispersive X-ray analysis (EDAX). Finally, the electrocatalytic activity of the Au–AgNPs modified electrode was examined by studying the reduction of hydrogen peroxide (HP) and nitrobenzene (NB). It shows better electrocatalytic activity towards the reduction of both HP and NB by shifting their reduction potentials to less negative potentials with enhanced reduction currents when compared to bare GCE.

Experimental

Chemicals

Hydrogen tetrachloroaurate (HAuCl4), silver nitrate (AgNO3) and sodium borohydride (NaBH4) were purchased from Sigma Aldrich. Trisodium citrate (Na3C6H5O7), hydrogen peroxide (H2O2), nitrobenzene (C6H5NO2), sodium dihydrogen phosphate dihydrate (NaH2PO4·2H2O) and disodium hydrogen phosphate dihydrate (Na2HPO4·2H2O) were purchased from Merck, India and were used as received. 1,6-Hexadiamine (HDA) was purchased from Alfa Aesar and was used as received. Indium tin oxide (ITO) plates were purchased from Asahi Beer Optical Ltd., Japan. Glassy carbon (GC) plates were purchased from Alfa-Aesar. Na2HPO4 and Na2H2PO4 were used to prepare phosphate buffer (PB) solution (pH 7.2). Double distilled water was used to prepare the solutions used in the present work. All glassware used in the preparation of Au–AgNPs were cleaned with freshly prepared aqua regia and rinsed thoroughly with water.

Instrumentation

Absorption spectra were measured using Perkin-Elmer lambda 35 and JASCO V-550 UV-visible spectrophotometer. The reflectance measurements were carried out using Ocean Optics, Inc. Maya 2000 PRO spectrometer. Electrochemical measurements were carried out with CHI model 643B (Austin, TX, USA) Electrochemical analyzer. The measurements were performed in a conventional two-compartment three electrode cell with a polished 3 mm glassy carbon electrode (GCE) as a working electrode, a platinum wire as a counter electrode and NaCl saturated Ag/AgCl electrode as a reference electrode. All the electrochemical experiments were carried out under nitrogen atmosphere at room temperature. High resolution transmission electron microscopy (HR-TEM) images of Au–Ag nanoparticles were obtained from a JEOL JEM 3010 operating at 200 kV. The samples were prepared by dropping 2 μL of Au–Ag solution on to a carbon-coated copper grid. X-ray diffraction analysis was carried out with a Rigaku X-ray diffraction unit using Ni-filtered Cu Kα (λ = 1.5406) radiation. A large volume (500 ml) of Au–AgNPs was synthesized and centrifuged (10[thin space (1/6-em)]000 rpm) and then particles were separated. They repeatedly washed with water and dried in vacuum. The dried Au–AgNPs powder was used for XRD measurements. Scanning electron microscope (SEM) measurements were carried at VEGA3 TESCAN, USA. Atomic force microscope (AFM) measurements were carried out using A100, APRESEARCH, Italy. Energy dispersive X-ray analysis and line scanning analysis were carried out using Bruker Nano, Germany. For SEM, AFM and line scanning measurements, ITO was used as a substrate and GC plate was used as substrate for EDAX analysis with similar modification as used for GCE.

Synthesis of monometallic Ag and AuNPs

The citrate capped AgNPs and AuNPs were prepared by the following procedure. 0.5 ml of 5 mM AgNO3 (0.1 ml of 31.7 mM HAuCl4·3H2O) and 0.2 ml of 38.8 mM TSC were added to 9 ml of water with constant stirring for 20 min. To this solution, 0.2 ml of ice cold 20 mM NaBH4 was added drop by drop and the stirring was continued for another 20 min. The colour of the solution turns into dark yellow and wine red immediately after the final addition, indicating the formation of AgNPs and AuNPs, respectively.

Synthesis of bimetallic Au–AgNPs

The citrate capped Au–AgNPs were prepared by the following procedure. 100–900 μL of 0.03 mM of HAuCl4·3H2O was added drop by drop to the cit-AgNPs with constant stirring. The colour of the solution was changed from dark yellow to reddish brown gradually by the addition of various concentrations of HAuCl4, indicates the formation of Au–AgNPs and the stirring was continued for another 20 min. The preparation and plausible mechanism for the formation of Au–AgNPs are schematically shown in Scheme 1.
image file: c6ra05658j-s1.tif
Scheme 1 Schematic representation for the synthesis of Au@AgNPs.

Fabrication of Au–AgNPs on GCE

GCE was polished with 0.05 μm alumina powder and sonicated in double distilled water for 5 min. The monolayer of 1,6-hexadiamine (HDA) was prepared on the GCE by immersing the well cleaned GCE into an aqueous solution of HDA for 6 h. The attachment of amine on GCE follows the Michael's nucleophilic addition of amine group on the olefinic bond present in GCE.28 The HDA modified electrode was then immersed into the colloidal solution of Au–AgNPs for 6 h. The resultant electrode was washed with double distilled water. This electrode is termed as GCE/HDA/Au–AgNPs. Scheme 2 illustrates the attachment of Au–AgNPs on GCE.
image file: c6ra05658j-s2.tif
Scheme 2 Fabrication of Au@AgNPs on GCE.

Results and discussion

Characterization of Au–AgNPs by UV-visible spectroscopy

The electronic spectroscopy is one of the simplest techniques to characterize the metal nanoparticles because it exhibits characteristic absorption band due to the surface plasmon resonance (SPR) for the metal nanoparticles in the visible region.8 Fig. S1 shows the absorption spectra recorded for citrate capped AgNPs and AuNPs. The absorption spectra of AgNPs and AuNPs show an absorption maximum at 397 (Fig. S1A) and 520 nm (Fig. S1B) corresponding to the SPR bands of AgNPs and AuNPs, respectively. This confirms the successful formation of AgNPs and AuNPs.8 The color of the formed AgNPs and AuNPs was found to be yellow and wine red, respectively (inset, Fig. S1A and B). While adding HAuCl4 to AgNPs, the yellow color of the solution is turned to reddish brown. This may be due to the formation of Au–AgNPs. Further, the formation Au–AgNPs with various molar ratios was monitored by UV-vis spectroscopy. Fig. 1A shows the absorption spectra recorded for the Au–AgNPs with different mole ratios of Ag and Au. The SPR band due to AgNPs at 397 nm was red shifted to 482 nm while increasing Ag[thin space (1/6-em)]:[thin space (1/6-em)]Au mole ratio by 1[thin space (1/6-em)]:[thin space (1/6-em)]0, 1[thin space (1/6-em)]:[thin space (1/6-em)]0.02, 1[thin space (1/6-em)]:[thin space (1/6-em)]0.04, 1[thin space (1/6-em)]:[thin space (1/6-em)]0.06, 1[thin space (1/6-em)]:[thin space (1/6-em)]0.08, 1[thin space (1/6-em)]:[thin space (1/6-em)]0.10 and 1[thin space (1/6-em)]:[thin space (1/6-em)]0.12 (Fig. 1A, curves (a)–(g)). Further, the color of the solution gradually turns into reddish brown from dark yellow (Fig. 1B(a)–(g)). While increasing the mole ratio of Ag[thin space (1/6-em)]:[thin space (1/6-em)]Au from 1[thin space (1/6-em)]:[thin space (1/6-em)]0.12 to 1[thin space (1/6-em)]:[thin space (1/6-em)]0.14 and 1[thin space (1/6-em)]:[thin space (1/6-em)]0.16, the color of the solution was changed to violet and black, respectively (Fig. 1B(h) and (i)). The SPR band was vanished at the mole ratio of 1[thin space (1/6-em)]:[thin space (1/6-em)]0.16 due to aggregation and the solution becomes colorless after few minutes. The formation of Au–AgNPs depends on the mole ratio of Ag[thin space (1/6-em)]:[thin space (1/6-em)]Au. The obtained spectral and color changes clearly suggest the successful formation of Au–AgNPs. The mechanism for the formation of Au–AgNPs will be discussed in the next section.
image file: c6ra05658j-f1.tif
Fig. 1 (A) UV-vis spectra obtained for Au–AgNPs with the various Ag[thin space (1/6-em)]:[thin space (1/6-em)]Au ratios of (a) 1[thin space (1/6-em)]:[thin space (1/6-em)]0, (b) 1[thin space (1/6-em)]:[thin space (1/6-em)]0.02, (c) 1[thin space (1/6-em)]:[thin space (1/6-em)]0.04, (d) 1[thin space (1/6-em)]:[thin space (1/6-em)]0.06, (e) 1[thin space (1/6-em)]:[thin space (1/6-em)]0.08, (f) 1[thin space (1/6-em)]:[thin space (1/6-em)]0.10, (g) 1[thin space (1/6-em)]:[thin space (1/6-em)]0.12, (h) 1[thin space (1/6-em)]:[thin space (1/6-em)]0.14 and (i) 1[thin space (1/6-em)]:[thin space (1/6-em)]0.16 and (B) corresponding photographs.

Mechanism for the formation of Au–AgNPs

The formation of Au–AgNPs is due to the galvanic replacement reaction, which is driven by an electroless mechanism involving spontaneous reduction of Au3+ ions to Au(0) by Ag(0) in the absence of external sources of electric current. Since the standard reduction potential of Au3+/Au (+0.99 V vs. NHE) is larger than that of Ag+/Ag (+0.80 V vs. NHE), the surface of AgNPs seeds serve as reducing agent and electron source for the reduction of AuCl4 supplied by HAuCl4.14,17 Once the reaction begins on the active site of each seed, the silver would start dissolving and a hole would be generated on the facets (anodic reaction). This reaction resembles a corrosion process, in which silver being oxidized at the anode. The released electrons can easily migrate to the surface of the nanoparticle to reduce AuCl4 into Au atoms (cathodic reaction). The shell deposition can continue as long as silver ions can permeate and electrons can transfer through the shell. In general, the stoichiometric reaction is given below (1).29
 
3Ag(s) + AuCl4 → Au(s) + 3Ag+ + 4Cl (1)

Characterization of Au–AgNPs by HR-TEM and XRD

The size and morphology of the Au–AgNPs were examined by HR-TEM. Fig. 2A and B shows the TEM image of Au–AgNPs at the Ag[thin space (1/6-em)]:[thin space (1/6-em)]Au mole ratio of 1[thin space (1/6-em)]:[thin space (1/6-em)]0.12. It shows that they are roughly spherical in shape with a size of ∼16 nm (Fig. 2A) and the lattice images were originated from a single crystal (Fig. 2B). Fig. 2C shows the selected area electron diffraction (SAED) pattern of Au–AgNPs. The discrete dot in the diffraction pattern illustrates the crystalline nature of Au–AgNPs.
image file: c6ra05658j-f2.tif
Fig. 2 (A and B) TEM images and (C and D) SAED and XRD patterns obtained for Au@AgNPs (Ag[thin space (1/6-em)]:[thin space (1/6-em)]Au = 1[thin space (1/6-em)]:[thin space (1/6-em)]0.12).

Fig. 2D shows the XRD pattern of Au–AgNPs (Ag[thin space (1/6-em)]:[thin space (1/6-em)]Au-1[thin space (1/6-em)]:[thin space (1/6-em)]0.12). It illustrates the diffraction features appearing at 38.17°, 44.34°, 64.52°, 77.48° and 82.10° corresponding to (111), (200), (220), (311) and (222) planes, respectively. Among these, the peak corresponding to the (111) plane is more intense than the other planes. The ratio between the intensity of the (200) and (111) diffraction peaks was much lower, indicating that (111) plane is a predominant orientation. The width of (111) peak was employed to calculate the average crystalline size of the Au–AgNPs using the Scherrer equation.30 The calculated average size of Au–AgNPs is ∼18 nm, which closely matches with the particle size obtained from HR-TEM. Moreover, the peak intensities of Ag planes are comparatively higher with respect to Au planes, suggesting that Ag is present in the outer layer and Au is in the inner layer as in the form of Au (core) and Ag (shell).

Characterization of Au–AgNPs modified electrode by DRS, SEM, AFM, XRD and EDAX

The modification of AgNPs, AuNPs and Au–AgNPs on GCE was first characterized by DRS. Fig. S2 shows the DRS of AgNPs, AuNPs and Au–AgNPs modified GCEs. The AgNPs modified GCE shows the absorption maximum at 416 nm (Fig. S2a) whereas the AuNPs modified GCE shows the absorption maximum at 529 nm (Fig. S2b). On the other hand, the Au–AgNPs (Ag[thin space (1/6-em)]:[thin space (1/6-em)]Au-1[thin space (1/6-em)]:[thin space (1/6-em)]0.12) modified GCE shows the absorption maximum at 498 nm (Fig. S2c). The obtained absorption band is closely matching with the absorption band of colloidal BMNPs. This confirms the successful attachment of Au–AgNPs on GCE.

Further, the morphology of Au–AgNPs modified substrate with the Ag[thin space (1/6-em)]:[thin space (1/6-em)]Au mole ratio of 1[thin space (1/6-em)]:[thin space (1/6-em)]0.12 was characterized by SEM and AFM. Fig. S3 shows the SEM image obtained for Au–AgNPs modified ITO substrate. It shows that the attached Au–AgNPs were spherical in shape and the size was found to be ∼20 nm. Further, it illustrates that the particles were distributed throughout the surface uniformly. Fig. 3 shows the AFM images obtained for ITO/HDA/AgNPs and ITO/HDA/Au–AgNPs substrates. The AFM image of AgNPs modified substrate shows that the AgNPs were spherical in shape and the size of AgNP was found to be ∼10 nm (Fig. 3A and C). On the other hand, the AFM image of Au–AgNPs modified substrate shows that the Au–AgNPs were densely packed and were mostly spherical in shape (Fig. 3B and D). The size of the Au–AgNPs is ∼19 nm, which implies that the size of the Au–AgNPs remains same after attached on the ITO/HDA surface.


image file: c6ra05658j-f3.tif
Fig. 3 AFM images obtained for (A and B) 2-D and (C and D) 3-D views of AgNPs and Au–AgNPs, modified substrates. (E and F) Line spectra obtained for Au–AgNPs and CV obtained for GC/HDA/Au–AgNPs (Ag[thin space (1/6-em)]:[thin space (1/6-em)]Au = 1[thin space (1/6-em)]:[thin space (1/6-em)]0.12) electrode in 0.2 M PB solution (pH 7.2) at a scan rate of 50 mV s−1.

The Au–AgNPs modified ITO substrate was further characterized by XRD. Fig. S4 shows the XRD pattern obtained for AgNPs, AuNPs and Au–AgNPs with various mole ratios of Ag[thin space (1/6-em)]:[thin space (1/6-em)]Au modified ITO substrates. Fig. S4a and b show the XRD pattern obtained for AgNPs and AuNPs modified substrates. It shows the diffraction features at 38.17°, 44.34°, 64.52°, 77.48° and 82.10° corresponding to (111), (200), (220), (311) and (222) planes, respectively for Ag and AuNPs. When the Au–AgNPs were modified on the electrode surface there is no change in the diffraction angle. This suggests that the crystalline nature of the formed Au–AgNPs remains same (Fig. S4c–e). Among these, the peak corresponding to the (111) plane is more intense than the other planes. The ratio between the intensity of the (200) and (111) diffraction peaks was much lower, indicating that (111) plane is a predominate orientation. In addition, four characteristic peaks for Au and Ag marked by their indices ((111), (200), (220), and (311)) indicated that the resultant bimetallic nanoparticles having face centered cubic (fcc) structure.

Fig. S6 shows the EDAX spectra of AgNPs, AuNPs and Au–AgNPs with different mole ratios modified GC plates. The morphology and size of the Au–AgNPs attached on both GC and ITO substrates are almost identical. While scanning the peripheral region of the AgNPs, AuNPs and Au–AgNPs modified GC plates, the appearance of Ag and Au peaks confirms the successful attachment of AgNPs, AuNPs and Au–AgNPs on the GC plate. Fig. S6a and b show the EDAX spectra of AgNPs and AuNPs modified GC plates. It shows the peaks at 2.98 and 2.123 keV corresponding to Ag and 2.21 and 9.71 keV corresponding to Au along with carbon, nitrogen and oxygen at 0.27, 0.39 and 0.53 keV, respectively. When the Au–AgNPs was modified on the substrate, the spectrum shows both Ag and Au peaks, which confirms the successful modification of the Au–Ag bimetallic NPs (Fig. S5c–f). Moreover, when the ratio of Ag[thin space (1/6-em)]:[thin space (1/6-em)]Au varied to form Au–AgNPs, the intensity of the Au peak was increased linearly. The weight percentage of the elements present in the EDAX analysis is given in Table S1. It was found that the weight percentage of Au–AgNPs at Ag[thin space (1/6-em)]:[thin space (1/6-em)]Au = 1[thin space (1/6-em)]:[thin space (1/6-em)]0.12 ratio is 5.76 and 1.48% of Ag and Au, respectively, matching with the stoichiometric formation of Au–AgNPs (Ag[thin space (1/6-em)]:[thin space (1/6-em)]Au = 3[thin space (1/6-em)]:[thin space (1/6-em)]1) (Fig. S5e, Table S1). The remaining peaks are due to the HDA linker and the GC plate. The Au–AgNPs with 1[thin space (1/6-em)]:[thin space (1/6-em)]0.12 mole ratio of Ag[thin space (1/6-em)]:[thin space (1/6-em)]Au was further characterized by line scanning analysis. Qualitative information on elemental distributions can be obtained by line-scanning analysis on the EDAX analyzer, in which the diffusion profile of elements at an interface can be plotted as number of X-ray quanta being counted vs. the spatial location along a line. Further, the normalised intensity scales simply make comparison of major and minor elements. Hence, it is very much useful in the bimetallic system. Fig. 3E shows the line scanning of Au–AgNPs modified substrate at the Ag[thin space (1/6-em)]:[thin space (1/6-em)]Au mole ratio of 1[thin space (1/6-em)]:[thin space (1/6-em)]0.12. It confirms that the particles present on the substrate were Au–AgNPs and the intensity of AgNPs (Fig. 3E red line) was higher than AuNPs (Fig. 3E blue line), implying that the AuNPs were covered with AgNPs. This clearly demonstrates that the AgNPs were in the outer shell and the AuNPs were in the inner core. Hence, it is proposed that the formed Au–AgNPs were in the form of Au(core)@Ag(shell) structure.

Characterization by cyclic voltammetry

Fig. S6 shows the cyclic voltammograms (CVs) obtained for GCE/HDA/AgNPs and GCE/HDA/AuNPs in 0.2 M PB solution (pH = 7.2) at a scan rate of 50 mV s−1. The AgNPs modified electrode shows an anodic peak at 0.25 V and a cathodic peak at 0.05 V corresponding to the formation of silver oxide and reduction peaks, respectively (Fig. S6A). The formation of gold oxide peak at 0.90 V and the subsequent reduction peak at 0.45 V at the AuNPs modified electrode confirm the successful modification of AuNPs on GCE (Fig. S6B). Fig. 3F shows the CVs obtained for GCE/HDA/Au–AgNPs in 0.2 M PB solution (pH = 7.2) at a scan rate of 50 mV s−1. It exhibits anodic peaks at 0.25 and 0.90 V corresponding to the formation of silver and gold oxidation peaks, respectively. In the cathodic scan, it shows cathodic peaks at 0.45 and 0.05 V corresponding to the subsequent reduction of gold and silver oxides, respectively.31 This once again confirms the successful attachment of Au–AgNPs on GCE/HDA. It is to be noted here that the peak currents obtained for gold oxide formation and reduction were less than silver, suggesting that silver occupied in the outer layer and gold occupied in the inner layer. The obtained electrochemical results are consistent with the results obtained from the line scanning analysis. Thus, the formed BMNPs were Au@AgNPs.

Characterization by electrical impedance spectroscopy (EIS)

In order to investigate the conducting nature of Au–AgNPs electrode, EIS study was carried out. Fig. 4 shows the Nyquist and Bode plots obtained for AgNPs, AuNPs and Au–AgNPs with different molar ratios modified electrodes in 1 mM K3[Fe(CN)6] containing 0.2 M PB solution (pH 7) at scanning frequencies from 0.01 to 100[thin space (1/6-em)]000 Hz. A Randles circuit model [RS(CPE − RCT)] (Fig. 4D) was used to fit the impedance spectral data where RS refers to the solution resistance, CPE refers to the constant phase element. The charge transfer resistance (RCT) can be calculated from the semicircle obtained in the Nyquist plot and it can control the interfacial electron-transfer rate of the redox probe between the solution and the electrode. Fig. 4A shows the Nyquist plots obtained for the electrodes modified with AgNPs, AuNPs and Au–AgNPs of different molar ratios (1[thin space (1/6-em)]:[thin space (1/6-em)]0.10, 1[thin space (1/6-em)]:[thin space (1/6-em)]0.12, 1[thin space (1/6-em)]:[thin space (1/6-em)]0.14 and 1[thin space (1/6-em)]:[thin space (1/6-em)]0.16). The charge transfer resistance (RCT) values obtained for the AgNPs and AuNPs modified electrodes are 49.94 and 27.70 kΩ, respectively. On the other hand, the RCT values of 18.23, 17.16, 19.73 and 23.64 kΩ, respectively are obtained for the Au–AgNPs modified electrodes with Ag[thin space (1/6-em)]:[thin space (1/6-em)]Au ratios of 1[thin space (1/6-em)]:[thin space (1/6-em)]0.10, 1[thin space (1/6-em)]:[thin space (1/6-em)]0.12, 1[thin space (1/6-em)]:[thin space (1/6-em)]0.14 and 1[thin space (1/6-em)]:[thin space (1/6-em)]0.16. Among these, the RCT value obtained at Au–AgNPs with the mole ratio of 1[thin space (1/6-em)]:[thin space (1/6-em)]0.12 (curve (d)) was less than the other molar ratios besides Ag and AuNPs modified electrodes. The obtained RS, CPE, and RCT values are given in Table S2.
image file: c6ra05658j-f4.tif
Fig. 4 (A) Nyquist plots, (B) Bode-phase angle plots and (C) Bode amplitude plots for (a) GC/HDA/AgNPs, (b) GC/HDA/AuNPs and GC/HDA/Au–AgNPs in the Ag[thin space (1/6-em)]:[thin space (1/6-em)]Ag ratios of (c) 1[thin space (1/6-em)]:[thin space (1/6-em)]0.10, (d) 1[thin space (1/6-em)]:[thin space (1/6-em)]0.12, (e) 1[thin space (1/6-em)]:[thin space (1/6-em)]0.14 and (f) 1[thin space (1/6-em)]:[thin space (1/6-em)]0.16 modified electrodes in 1 mM K3[Fe(CN)6] in 0.1 M KCl at a scanning frequencies from 0.01 to 100[thin space (1/6-em)]000 Hz. (D) Equivalent electrical circuit used for fitting the impedance spectra.

Fig. 4B shows the Bode phase angle plot for AgNPs, AuNPs and Au–AgNPs of different molar ratios modified electrodes. It is well known that if the phase angle is greater or equal to 90°, the electrode behaves like an ideal capacitor. On the other hand, if the phase angle is less than 90° then the electrode allows the ions from the solution. The phase angle values of 72° and 57° (Fig. 4B, curves (a) and (b)) were obtained for AgNPs and AuNPs modified GCEs, respectively. The Au–AgNPs attached on GCE/HDA with different ratios of Ag and Au shows the phase angle values of 60°, 55°, 62° and 70° (Fig. 4B, curves (c)–(f)), respectively were obtained for Ag[thin space (1/6-em)]:[thin space (1/6-em)]Au ratios of 1[thin space (1/6-em)]:[thin space (1/6-em)]0.10, 1[thin space (1/6-em)]:[thin space (1/6-em)]0.12, 1[thin space (1/6-em)]:[thin space (1/6-em)]0.14 and 1[thin space (1/6-em)]:[thin space (1/6-em)]0.16 indicating that a facile electron transfer reaction occurs at Au–AgNPs modified electrode. Fig. 4C shows the Bode amplitude plots for the AgNPs, AuNPs and Au–AgNPs with different molar ratios modified electrodes. In the frequency range from 106 to 103 Hz, the |Z| value is about constant, indicating that the solution resistance (RS) is almost same for all the electrodes. At the frequency range of 103 to 100, the |Z| value starts to increase and the phase angle gradually decreases indicating the growing role of capacitive response with decreasing frequency. At lower frequencies (100 to 10−1) the |Z| values are 49.94, 27.70, 18.23, 17.16, 19.73 and 23.64 kΩ for AgNPs, AuNPs and Au–AgNPs with the mole ratio of 1[thin space (1/6-em)]:[thin space (1/6-em)]0.10, 1[thin space (1/6-em)]:[thin space (1/6-em)]0.12, 1[thin space (1/6-em)]:[thin space (1/6-em)]0.14 and 1[thin space (1/6-em)]:[thin space (1/6-em)]0.16 modified electrodes, respectively. The |Z| is equal to the total resistance (RS + RCT) of the system.32 It is clear from Fig. 4C that the RCT value was decreased for the Au–AgNPs modified electrode when compared to AgNPs and AuNPs modified electrodes, suggesting good conducting nature of Au–AgNPs modified electrode. The heterogeneous electron-transfer rate constant (Ket) was calculated using the eqn (2).33

 
image file: c6ra05658j-t1.tif(2)
where R is the gas constant, T is the temperature (K), F is the faraday constant, A is the electrode area (0.07 cm2), C0 is the concentration of the redox couple in the bulk solution (1 mM) and n is the number of electrons transferred per molecule of the redox probe (n = 1 for the K3[Fe(CN)6] probe). The calculated Ket values are 5.39 × 10⁻⁸ and 4.86 × 10⁻⁷ for AgNPs and AuNPs modified electrodes, respectively and 3.29 × 10⁻⁷, 2.77 × 10⁻⁷, 3.40 × 10⁻⁷ and 3.75 × 10⁻⁷ cm s−1 for Au–AgNPs modified electrodes with the mole ratios of 1[thin space (1/6-em)]:[thin space (1/6-em)]0.10, 1[thin space (1/6-em)]:[thin space (1/6-em)]0.12, 1[thin space (1/6-em)]:[thin space (1/6-em)]0.14 and 1[thin space (1/6-em)]:[thin space (1/6-em)]0.16, respectively. The obtained higher Ket value for Au–AgNPs modified electrode with a mole ratio of Ag[thin space (1/6-em)]:[thin space (1/6-em)]Au = 1[thin space (1/6-em)]:[thin space (1/6-em)]0.12 indicates that the electron transfer reaction was faster at this electrode when compared to AgNPs, AuNPs and Au–AgNPs of other mole ratios modified electrodes.

Electrochemical reduction of hydrogen peroxide (HP) and nitrobenzene (NB)

The other objective of the present study is to utilize the Au–AgNPs modified electrode for the reduction of HP and NB. Fig. 5A shows the CVs obtained for 0.5 mM HP at bare GCE, AgNPs, AuNPs and Au–AgNPs modified GCEs in 0.2 M PB solution (pH 7.2) at a scan rate of 50 mV s−1. Bare GCE does not show any reduction peak for HP (curve (a)). On the other hand, the AgNPs and AuNPs modified electrodes exhibit a reduction peak at −1.05 and −0.85 V, respectively (curve (b) and (c)). Interestingly, the Au–AgNPs modified electrode shows a reduction potential at −0.72 V for HP (curve (d)) which is 120 mV less negative potential when compared to bare GCE. Further, it also showed higher reduction current for HP. This infers that the Au–AgNPs modified electrode can remarkably promote the electron transfer as well as decrease the overpotential for the reduction of HP. The electrocatalytic activity of the Au–AgNPs formed at different mole ratios modified electrodes was also examined towards HP reduction. Fig. 5B shows the CVs obtained for Au–AgNPs modified GCEs prepared from Ag[thin space (1/6-em)]:[thin space (1/6-em)]Au = 1[thin space (1/6-em)]:[thin space (1/6-em)]0.10, 1[thin space (1/6-em)]:[thin space (1/6-em)]0.12 and 1[thin space (1/6-em)]:[thin space (1/6-em)]0.14 in the presence and absence of 0.5 mM HP in 0.2 M PB solution (pH 7.2) at a scan rate of 50 mV s−1. The Au–AgNPs electrode does not show any reduction peak in the absence of HP (curve (a)), which clearly suggests that this electrode is inert at this potential window. While the Au–AgNPs modified electrodes prepared with the Ag[thin space (1/6-em)]:[thin space (1/6-em)]Au ratios of 1[thin space (1/6-em)]:[thin space (1/6-em)]0.10, 1[thin space (1/6-em)]:[thin space (1/6-em)]0.12 and 1[thin space (1/6-em)]:[thin space (1/6-em)]0.14 show the reduction peak for HP at −1.0, −0.70 and −0.75 V (curves (b)–(d)), respectively. Among the three compositions, Au–AgNPs modified electrode with 1[thin space (1/6-em)]:[thin space (1/6-em)]0.12 ratio exhibits higher electrocatalytic activity towards the reduction of HP (curve (c)) by shifting the reduction potential to less negative potential (300 mV) with enhanced current when compared to Au–AgNPs modified with 1[thin space (1/6-em)]:[thin space (1/6-em)]0.10 (curve (b)) and 1[thin space (1/6-em)]:[thin space (1/6-em)]0.14 ratios (curve (d)). The obtained results indicate that as the content of Au in Ag increases, the electrocatalytic activity increases and reaches maximum at the ratio of 1[thin space (1/6-em)]:[thin space (1/6-em)]0.12 (Ag[thin space (1/6-em)]:[thin space (1/6-em)]Au) and afterwards the electrocatalytic activity decreases due to changes in the morphology of Au–AgNPs. This suggests that the surface morphology and surface roughness of the Au–AgNPs films played an important role in the electrocatalytic activity towards the reduction of HP. As evidenced from AFM, line scanning, SEM and CV studies, a core–shell structure with a size of ∼20 nm of Au–AgNPs film is formed at the ratio of 1[thin space (1/6-em)]:[thin space (1/6-em)]0.12 (Ag[thin space (1/6-em)]:[thin space (1/6-em)]Au). While increasing the content of Au, the size of the core shell structure increases and finally aggregated. Besides, the synergistic interactions and activity of Au–AgNPs on the HP species are also believed to play an important role in the electrocatalytic property of Au–AgNPs film.
image file: c6ra05658j-f5.tif
Fig. 5 CVs obtained for 0.5 mM (A) HP and (C) NB at (a) bare, (b) AgNPs, (c) AuNPs and (d) Au–AgNPs modified GCEs and (B and D) Au–AgNPs modified GCEs in the Ag[thin space (1/6-em)]:[thin space (1/6-em)]Au ratios of (b) 1[thin space (1/6-em)]:[thin space (1/6-em)]0.10, (c) 1[thin space (1/6-em)]:[thin space (1/6-em)]0.12 and (c) 1[thin space (1/6-em)]:[thin space (1/6-em)]0.14 in the presence and (a) in the absence of 0.5 mM (C) HP and (D) NB and (a) in the absein 0.2 M PB solution (pH 7.2) at a scan rate of 50 mV s−1. CVs obtained for 0.5 mM (E) HP and (F) NB at GC/HDA/Au–AgNPs electrode in 0.2 M PB solution (pH 7.2) at different scan rates (10–100 mV s−1). Insets E and F[thin space (1/6-em)]:[thin space (1/6-em)]calibration plots obtained for current vs. square root of scan rate.

Fig. 5C shows the CVs obtained for 0.5 mM of NB at bare GCE, AgNPs, AuNPs and Au–AgNPs modified GCEs in 0.2 M PB solution (pH 7.2) at a scan rate of 50 mV s−1. Bare GCE shows a reduction peak at −0.73 V due to the reduction of NB to phenylhydroxylamine (curve (a)) whereas AgNPs and AuNPs modified electrodes also exhibit a reduction of NB at the same potential but showed 2.5- and 4-fold higher reduction current, respectively (curves (b) and (c)). On the other hand, the Au–AgNPs modified electrode exhibits a reduction peak at −0.65 V (curve (d)) with higher reduction current when compared to other modified electrodes. Fig. 5D shows the CVs obtained for Au–AgNPs modified GCEs prepared from the mole ratio of 1[thin space (1/6-em)]:[thin space (1/6-em)]0.10, 1[thin space (1/6-em)]:[thin space (1/6-em)]0.12 and 1[thin space (1/6-em)]:[thin space (1/6-em)]0.14 (Ag[thin space (1/6-em)]:[thin space (1/6-em)]Au) in the presence and absence of 0.5 mM NB in 0.2 M PB solution (pH 7.2) at a scan rate of 50 mV s−1. The Au–AgNPs electrode does not show any reduction peak in the absence of NB (curve (a)). The Au–Ag modified electrodes prepared with the Ag[thin space (1/6-em)]:[thin space (1/6-em)]Au ratios of 1[thin space (1/6-em)]:[thin space (1/6-em)]0.10, 1[thin space (1/6-em)]:[thin space (1/6-em)]0.12 and 1[thin space (1/6-em)]:[thin space (1/6-em)]0.14 show a reduction peak for NB at −0.74, −0.65 and −0.70 V (curves (b)–(d)), respectively. Among the three compositions, Au–AgNPs modified electrode with 1[thin space (1/6-em)]:[thin space (1/6-em)]0.12 ratio exhibits higher electrocatalytic activity towards the reduction of NB (curve (c)). The above results infer that the Au–AgNPs modified electrode with Ag[thin space (1/6-em)]:[thin space (1/6-em)]Au = 1[thin space (1/6-em)]:[thin space (1/6-em)]0.12 can remarkably promote the electron transfer as well as decrease the overpotential for the reduction of HP and NB and it will probably be used for the sensitive detection of them. The possible mechanisms for the electrochemical reduction of HP and NB are shown in Scheme 3.


image file: c6ra05658j-s3.tif
Scheme 3 Mechanism for the reduction of (A) H2O2 and (B) nitrobenzene.

Effect of scan rate

The reduction of HP and NB at Au–AgNPs modified electrode was further investigated at different potential sweep rates. Fig. 5E and F show the CVs obtained for 0.5 mM HP and NB at Au–AgNPs modified GCE in 0.2 M PBS (pH 7.2) at scan rates of 10–100 mV s−1. The reduction currents of HP and NB were increased while increasing the scan rate. The plot of reduction current (Ipc) with the square root of scan rate is linear (inset, Fig. 5E and F) with correlation coefficients of 0.9995 for HP (inset, Fig. 5E) and 0.996 for NB (inset, Fig. 5F) indicating that the reductions of HP and NB at Au–AgNPs electrode were diffusion controlled process.

Determination of HP and NB

The sensitive determination of HP and NB at the present modified electrode was studied by differential pulse voltammetry (DPV). Fig. 6A shows the DPVs obtained for each increment of 10 μM HP at Au–AgNPs modified GCE with the mole ratio of 1[thin space (1/6-em)]:[thin space (1/6-em)]0.12 in 0.2 M PB solution (pH 7.2). The reduction peak current of HP increased linearly while increasing the concentration of HP in the range of 10–120 μM with a correlation coefficient of 0.9980 (Fig. 6A, inset) and the limit of detection was found to be 0.12 μM (S/N = 3). Fig. 6B shows the DPVs obtained for each increment of 10 μM of NB at Au–AgNPs/GCE in 0.2 M PB solution (pH 7.2). It was found that the reduction peak current of NB increased linearly while increasing the concentration of NB in the range of 10–110 μM with a correlation coefficient of 0.9976 (Fig. 6B, inset) and the detection limit was found to be 0.23 μM (S/N = 3). The sensitivity of the Au–AgNPs modified electrode towards HP and NB was compared with the reported modified electrodes (Tables S3 and S4).21,34–41 The present electrode shows better limit of detection for HP compared to the reported papers. However, the sensitivity towards NB is poor compared to AuNPs capped with bark extract modified electrode.39 But, the limit of detection (0.23 μM) achieved at the present modified electrode is more than the toxic level of NB recommended by WHO.25
image file: c6ra05658j-f6.tif
Fig. 6 DPVs obtained for each increment of 10 μM (A) HP and (B) NB at GC/Au–AgNPs (1[thin space (1/6-em)]:[thin space (1/6-em)]0.12) electrode in 0.2 M PB solution (pH 7.2). Inset: calibration plots obtained for current vs. the concentration of (A) HP and (B) NB.

Conclusions

Synthesis of Au–AgNPs by chemical reduction of AgNO3 followed by galvanic displacement of AuCl4 and their characterization by UV-vis spectroscopy, HR-TEM and XRD were described in this paper. The SPR band of Au–AgNPs showed a substantial red shift when varying the composition of Ag[thin space (1/6-em)]:[thin space (1/6-em)]Au ratio in the range. The synthesized Au–AgNPs were attached on HDA modified GCE and characterized by SEM, AFM, EDAX, EIS and CV. The AFM, line scanning and CV studies showed that the formed Au–AgNPs are in core–shell structure. The attachment of Au–AgNPs on GCE/HDA was confirmed from the appearance of anodic peaks at 0.30 and 0.90 V corresponding to the formation of silver and gold oxides and cathodic peaks at 0.40 and 0.10 V corresponding to the subsequent reduction of gold and silver oxides, respectively. Then, the electrocatalytic activity of the Au–AgNPs modified electrode was examined towards the reduction of HP and NB. It was found that the Au–AgNPs with the mole ratio of 1[thin space (1/6-em)]:[thin space (1/6-em)]0.12 (Ag[thin space (1/6-em)]:[thin space (1/6-em)]Au) showed higher electrocatalytic activity towards the reduction of both HP and NB when compared to bare, Au and AgNPs modified GCEs. This is attributed to the core–shell structure of Au–AgNPs besides synergistic effect of the BMNPs. The limit of detection was found to be 0.12 and 0.23 μM for HP and NB, respectively (S/N = 3).

Acknowledgements

N. S. K. Gowthaman thanks the University Grants Commission (UGC), New Delhi, India for the award of a Meritorious Student Fellowship (F. 7-225/2009(BSR)). B. Sinduja thanks the Department of Science and Technology (DST), New Delhi, India for the award of DST-INSPIRE Junior Research Fellowship (IF-150600(2015)). Financial support from Department of Biotechnology (BT/PR10372/PFN/20/904/2013), New Delhi, India is gratefully acknowledged.

References

  1. M. Shankar, N. Dimitratos, P. J. Miedziak, P. P. Wells, C. J. Kiely and G. J. Hutchings, Chem. Soc. Rev., 2012, 41, 8099–8139 RSC.
  2. S. Zeng, D. Baillargeat, H.-P. Hod and K.-T. Yong, Chem. Soc. Rev., 2014, 43, 3426–3452 RSC.
  3. H.-L. Liu, F. Nosheen and X. Wang, Chem. Soc. Rev., 2015, 44, 3056–3078 RSC.
  4. J. Crespo, J. M. Luzuriaga, M. Monge, M. E. Olmos, M. R. Castillo, B. Cormary, K. Soulantica, M. Sestuc and A. Falqui, Chem. Commun., 2015, 51, 16691–16694 RSC.
  5. N. S. K. Gowthaman and S. A. John, RSC Adv., 2015, 5, 42369–42375 RSC.
  6. B. Paramanik and A. Patra, J. Mater. Chem. C, 2014, 2, 3005–3012 RSC.
  7. P. Hu, Y. Song, L. Chen and S. Chen, Nanoscale, 2015, 7, 9627–9636 RSC.
  8. N. E. Motl, A. F. Smith, C. J. DeSantisa and S. E. Skrabalak, Chem. Soc. Rev., 2014, 43, 3823–3834 RSC.
  9. L. Lu, G. Burkey, I. Halaciuga and D. V. Goia, J. Colloid Interface Sci., 2013, 392, 90–95 CrossRef CAS PubMed.
  10. Y. Zhang, L. Li, H. Yang, Y. Ding, M. Su, J. Zhu, M. Yan, J. Yu and X. Song, RSC Adv., 2013, 3, 14701–14709 RSC.
  11. M. P. Mallin and C. J. Murphy, Nano Lett., 2002, 2, 1235–1237 CrossRef CAS.
  12. S. Lin, Z. L. Wang and M. A. El-Sayed, J. Phys. Chem. B, 1999, 103, 3529–3533 CrossRef.
  13. Y. Song, K. Liu and S. Chen, Langmuir, 2012, 28, 17143–17152 CrossRef CAS PubMed.
  14. D. A. Ferrer, L. A. Diaz-Torres, S. Wu and M.-J. Yacaman, Catal. Today, 2009, 147, 211–216 CrossRef CAS.
  15. S. Anandan, F. Grieser and M. Ashokkumar, J. Phys. Chem. C, 2008, 112, 15102–15105 CAS.
  16. I. Lee, S. W. Han and K. Kim, Chem. Commun., 2001, 18, 1782–1783 RSC.
  17. Y. Sun, B. T. Mayers and Y. Xia, Nano Lett., 2002, 2, 481–485 CrossRef CAS.
  18. K. Sato, E. Abe, M. Takahashi and J. Anzai, J. Colloid Interface Sci., 2014, 432, 92–97 CrossRef CAS PubMed.
  19. W. N. Liu, D. Ding, Z. L. Song, X. Bian, X. K. Nie, X. B. Zhang, Z. Chen and W. H. Tan, Biosens. Bioelectron., 2014, 52, 438–444 CrossRef CAS PubMed.
  20. M. R. Guascito, D. Chirizzi, C. Malitesta, E. Mazzotta, M. Siciliano, T. Siciliano, A. Tepore and A. Turco, Biosens. Bioelectron., 2011, 26, 3562–3569 CrossRef CAS PubMed.
  21. X. J. Yang, Y. H. Wang, Y. W. Liu and X. Jiang, Electrochim. Acta, 2013, 108, 39–44 CrossRef CAS.
  22. C. X. Lei, S. Q. Hu, G. L. Shen and R. Q. Yu, Talanta, 2003, 59, 981–988 CrossRef CAS PubMed.
  23. Z. Li, X. Zheng and J. Zheng, New J. Chem., 2016, 40, 2115–2120 RSC.
  24. J. H. Jiang, L. Chen, B. L. Wu and R. S. Zhai, Acta Phys.-Chim. Sin., 1998, 14, 704–708 CAS.
  25. A. Agrawal and P. G. Tratnyek, Environ. Sci. Technol., 1995, 30, 153–160 CrossRef.
  26. J. Sarasa, M. P. Roche, M. P. Ormad and E. Gimeno, Water Res., 1998, 32, 2721–2727 CrossRef CAS.
  27. F. P. Van der Zee, G. Lettinga and J. A. Field, Chemosphere, 2001, 44, 1169–1176 CrossRef CAS PubMed.
  28. I. Gallardo, J. Pinson and N. Vila, J. Phys. Chem. B, 2006, 110, 19521–19529 CrossRef CAS PubMed.
  29. J. Chen, B. Weily, Z.-Y. Li, D. Campbell, F. Saeki, H. Cang, L. Au, J. Lee, X. Li and Y. Xia, Adv. Mater., 2005, 17, 2255–2261 CrossRef CAS.
  30. B. D. Cullity, Elements of X-ray diffraction, Indiana, 2nd edn, 1978 Search PubMed.
  31. D. F. Eramo, A. H. Arévalo, J. J. Silber and L. J. Sereno, Electroanal. Chem., 1995, 382, 85–95 CrossRef.
  32. J. M. Mcintyre and H. Q. Pham, Prog. Org. Coat., 1996, 27, 201–207 CrossRef CAS.
  33. H. Zhang, H. Lu and N. Hu, J. Phys. Chem. B, 2006, 110, 2171–2179 CrossRef CAS PubMed.
  34. Z. Li, X. Zheng, Q. Sheng, Z. Yang and J. Zheng, RSC Adv., 2016, 6, 11218–11225 RSC.
  35. T. H. Tsai, S. Thiagarajan and S.-M. Chen, J. Appl. Electrochem., 2010, 40, 2071–2076 CrossRef CAS.
  36. J. S. Easow and T. Selvaraju, Electrochim. Acta, 2013, 112, 648–654 CrossRef CAS.
  37. S. Jayabal and R. Ramaraj, Appl. Catal., A, 2014, 470, 369–375 CrossRef CAS.
  38. P. Rameshkumar, P. Viswanathan and R. Ramaraj, Sens. Actuators, B, 2014, 202, 1070–1077 CrossRef CAS.
  39. R. Emmanuel, C. Karuppiah, S.-M. Chen, S. Palanisamy, S. Padmavathy and P. Prakash, J. Hazard. Mater., 2014, 279, 117–124 CrossRef CAS PubMed.
  40. V. M. Kariuki, S. A. Fasih-Ahmad, F. J. Osonga and O. A. Sadik, Analyst, 2016, 141, 2259–2269 RSC.
  41. K. Chelladurai, K. Muthupandi, S. M. Chen, M. A. Ali, P. Selvakumar, A. Rajan, P. Prakash, F. M. A. Al-Hemaid and B.-S. Lou, RSC Adv., 2015, 5, 31139–31146 RSC.

Footnote

Electronic supplementary information (ESI) available: UV-vis absorption spectra for AgNPs and AuNPs, XRD pattern obtained for Au–AgNPs, DRS obtained for AgNPs, AuNPs and Au–AgNPs modified GCEs, SEM obtained for ITO/Au–AgNPs and EDAX spectra obtained for AgNPs, AuNPs and Au–AgNPs of different mole ratio modified GC plates, impedance spectral data, CVs obtained for GCE/HDA/AgNPs and GCE/HDA/AuNPs in 0.2 M PB solution are available in the online version of this article. See DOI: 10.1039/c6ra05658j

This journal is © The Royal Society of Chemistry 2016
Click here to see how this site uses Cookies. View our privacy policy here.