Mango stone-derived activated carbon with high sulfur loading as a cathode material for lithium–sulfur batteries

Songtao Zhangab, Mingbo Zheng*b, Zixia Linb, Rui Zanga, Qingli Huangb, Huaiguo Xueb, Jieming Caoa and Huan Pang*b
aCollege of Materials Science and Technology, Nanjing University of Aeronautics and Astronautics, Nanjing 210016, China
bCollege of Chemistry and Chemical Engineering, Yangzhou University, Yangzhou 225002, China. E-mail: mbzheng@yzu.edu.cn; huanpangchem@hotmail.com

Received 2nd March 2016 , Accepted 8th April 2016

First published on 13th April 2016


Abstract

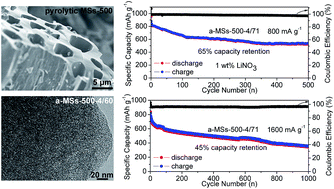
A set of mango stone (MS)-derived activated carbons with tunable pore structure parameters have been synthesized via a KOH activation procedure. The maximum specific surface area of 3334 m2 g−1 and pore volume of 2.17 cm3 g−1 are obtained for the material which is pre-carbonized at 500 °C and treated with a KOH/char mass ratio of 4 (a-MSs-500-4). Given the large pore volume of the resultant a-MSs-500-4 activated carbon, a high sulfur loading of up to 71 wt% can be achieved (a-MSs-500-4/71). When applied in a lithium–sulfur battery, the a-MSs-500-4/71 composite cathode exhibits 64% capacity retention over 500 cycles at 800 mA g−1 and 45% capacity retention over 1000 cycles at 1600 mA g−1, indicating excellent long-term cycling performance. Moreover, after 1 wt% LiNO3 is introduced as the electrolyte additive, the average coulombic efficiency of the electrode is as high as approximately 99%.


1. Introduction

Lithium–sulfur (Li–S) batteries have become attractive candidates for next-generation high-energy rechargeable batteries because of their high theoretical capacity (1675 mA h g−1) and theoretical energy density (2600 W h kg−1).1–5 However, the commercial applications of Li–S batteries are limited by several inherent problems. First, the insulating nature of both sulfur and the solid discharge product Li2S leads to poor active material utilization.6–8 Second, the easy dissolution of polysulfide intermediates in conventional organic electrolytes causes active material loss and the shuttle effect, both of which are responsible for the limited cycle performance and low coulombic efficiency observed in Li–S batteries.9–11

To address these issues, researchers have sought to incorporate sulfur into conductive carbon materials with the ability to confine polysulfide diffusion.12–15 KOH-activated carbon materials with well-developed porous structure have emerged as superior matrices for sulfur.16–19 The high specific surface area and large pore volume of this material can achieve high sulfur loading as well as boost sulfur utilization in electrochemical reactions, and its small-size nanopore structure can suppress dissolved polysulfide diffusion.20–23 Moreover, compared with artificial precursors, activated carbon can be chemically activated from abundant, renewable, and inexpensive natural material sources.24–30 Wei et al. reported a KOH-activated carbon prepared from pig bone.31 When used as a functional material in the Li–S batteries, the initial capacity and cycling performance of the cell was largely improved. In our previous work, a KOH-activated carbon material was prepared from waste litchi shells, which promoted a superior long cycle-life at 800 mA g−1 in the sulfur cathode tests.32

Herein, a set of KOH-activated carbons with tailored pore structure have been prepared from waste mango stones (MSs). The influence of pre-carbonized condition and KOH/char weight ratio are investigated. The material with maximum specific surface area (3334 m2 g−1) and pore volume (2.17 cm3 g−1) is applied to Li–S batteries. The resulting activated carbon/sulfur composite cathode with a high sulfur loading of 71 wt% delivers 64% capacity retention over 500 cycles at 800 mA g−1 and 45% capacity retention over 1000 cycles at 1600 mA g−1, respectively. The average coulombic efficiency of the electrode reaches up to approximately 99% with a LiNO3-contained electrolyte.

2. Experimental

2.1 Preparation of the mango stone-derived activated carbons

Waste MSs were dried and pre-carbonized at different temperatures (450, 500 and 600 °C) for 2 h under argon flow. The resulting char was ground into power and mixed with KOH at different KOH/char weight ratios. Chemical activation was performed at 900 °C for 1 h. The activated samples were then thoroughly washed with a solution of 1 M HCl and distilled water until neutral pH. The final products were named as a-MSs-x-y, where x °C represents the pyrolytic temperature and y is the weight ratio of KOH/char (y = 0, 2, 3, 4, 5 or 6).

2.2 Preparation of the activated carbon/sulfur composites

The resultant a-MSs-500-4 activated carbon and sulfur were thoroughly mixed and ground in a quartz mortar. The mass ratios of carbon/sulfur were 40[thin space (1/6-em)]:[thin space (1/6-em)]60 and 29[thin space (1/6-em)]:[thin space (1/6-em)]71. The mixture was then heated to 155 °C for 12 h in a sealed stainless steel vessel to obtain a-MSs-500-4/60 and a-MSs-500-4/71 composite samples.

2.3 Material characterization

Powder X-ray diffraction (XRD) patterns were recorded on a Bruker D8 powder X-ray diffractometer (Germany). The morphology of the samples was observed by a scanning electron microscopy (SEM, JEOL JSM-6701F) and a transmission electron microscopy (TEM, JEOL JEM-2100). The N2 adsorption–desorption measurements were obtained using a Micromeritics ASAP 2020 instrument. Thermal properties were determined using a Perkin-Elmer Pyris 1 thermal gravimetric analyzer (TGA, USA) at a heating rate of 10 °C min−1 under N2 flow. Raman spectra were collected using a confocal Raman microscope (HORIBA Jobin Yvon, France) with excitation at 532 nm from an Ar-ion laser. X-ray photoelectron spectroscopy (XPS) data were collected using a PHI 5000 Versa Probe spectrometer (ULVAC-PHI, Japan) equipped with a monochromatic Al-Kα (1486.6 eV) X-ray source.

2.4 Electrochemical characterization

The cathode slurry was prepared by mixing an 80 wt% carbon/sulfur composite, 10 wt% Super P, and 10 wt% polyvinylidene difluoride in N-methylpyrrolidone. Positive electrodes were produced by coating the slurry on aluminum foil and drying at 50 °C for 2 h. Each current collector contained between 1.0 mg cm−2 and 1.2 mg cm−2 of composite materials. The electrolyte was 1 M LiN(CF3SO2)2 (LiTFSI) in a mixed solvent of dimethoxyethane (DME) and dioxolane (DOL) at 1[thin space (1/6-em)]:[thin space (1/6-em)]1 volume ratio. To suppress polysulfide shuttle, 1 wt% LiNO3 was introduced as the electrolyte additive for comparison. Preliminary cell tests were conducted using 2032 coin-type cells fabricated with lithium metal as the anode and Celgard 2250 film as the separator. The charge/discharge performance was evaluated by a LAND CT-2001A instrument (Wuhan, China) at ∼26 °C. The potential window was controlled between 1.5 V and 2.7 V (the voltage range was between 1.7 and 2.7 V when the Li–S cells were test with a LiNO3-contained electrolyte). The specific capacity was calculated on the mass of sulfur. Cyclic voltammograms (CVs) were obtained using a CHI 760D electrochemical workstation (Shanghai Chenhua, China) at a 0.05 mV s−1 scan rate.

3. Results and discussion

As shown in Fig. S1, the TGA profile of dried MSs exhibits three weight-loss stages. The small weight loss up to approximate 110 °C is attributed to the elimination of adsorbed water. The main weight-loss process at around 220–400 °C could be associated with the decomposition of carbohydrates and cellulose. The last stage starting at about 400 °C should be corresponded to the elimination of heteroatoms (oxygen etc.) from the carbonaceous char.33 So, the pyrolysis temperatures of MSs are determined above 400 °C. In order to study the influence of synthetic conditions (pre-carbonization temperature and KOH/char weight ratio) on the development of porous textural parameters in MSs-derived activated carbons, the a-MSs-x-y samples were characterized by N2 adsorption–desorption analyses. As shown in Fig. 1a, all the a-MSs-x-4 (x °C = 450, 500 or 600 °C) samples exhibit type I/IV isotherms (according to the classification of IUPAC) with a knee and increasing plateau, which indicating a combination micro/mesoporous structure.24,32,34 Fig. 1b presents the pore size distribution curves obtained using the Barrett–Joyner–Halenda (BJH) method. The a-MSs-x-4 carbons demonstrate one main peak at around 2 nm, which are consistent with the results of N2 adsorption–desorption isotherms. The textural properties of the MSs-derived activated carbons are summarized in Table 1. The specific surface area and pore volume of a-MSs-x-4 depend on the pre-carbonization temperatures. Both the highest specific surface area (3334 m2 g−1) and the largest pore volume (2.17 cm3 g−1) are achieved in the a-MSs-500-4, which show that the optimal pre-carbonization temperature for the pyrolytic MSs is 500 °C. As displayed in Fig. 1c, the a-MSs-500-0 exhibits no porosity with a very low BET surface area of 6 m2 g−1. The employed chemical activation process markedly increases the nitrogen uptake of activated carbons. The as-prepared a-MSs-500-y (y = 2 to 6), showing combination I/IV isotherms, are characterized by enhanced specific surface area and pore volume. The pore size distributions of a-MSs-500-y (y = 2 to 6) exhibit one main peak at about 2 nm (Fig. 1d).
image file: c6ra05560e-f1.tif
Fig. 1 (a) N2 adsorption–desorption isotherms and (b) pore size distributions calculated using the BJH method of a-MSs-x-4 activated carbons prepared at different pre-carbonization temperatures (450, 500 and 600 °C); (c) N2 adsorption–desorption isotherms and (d) pore size distributions of a-MSs-500-y with different KOH/char weight ratios ranging from 0 to 6.
Table 1 Textural characteristics of the MSs-derived activated carbons
Samples BET surface area (m2 g−1) Pore volume (cm3 g−1) BJH average pore size (nm)
a-MSs-450-4 2827 1.92 2.9
a-MSs-600-4 2853 1.61 2.4
a-MSs-500-0 6 0.01
a-MSs-500-2 2243 1.57 3.1
a-MSs-500-3 2735 1.93 2.9
a-MSs-500-4 3334 2.17 2.9
a-MSs-500-5 3235 2.04 2.7
a-MSs-500-6 3013 2.05 2.8


The porous textural parameters of a-MSs-500-y strongly depend on the KOH/char weight ratio (Table 1). The specific surface area and pore volume of the resultant a-MSs-500-y proportionally go up with increased KOH/char weight ratio (lower than 4). The largest specific surface area (3334 m2 g−1) and pore volume (2.17 cm3 g−1) are achieved for the activated carbon synthesized with the KOH/char mass ratio = 4. A further increase in the KOH/char mass ratio to 5 and 6 leads to a decrease in the specific surface area and pore volume attribute to over-activation.35 The results indicate that the optimal KOH/char mass ratio for a-MSs-500-y samples is 4. XPS analysis was carried out to investigate the chemical composition of the a-MSs-500-4 activated carbon (Fig. S2). The survey spectrum confirms the presence of carbon and oxygen elements in the sample. Furthermore, based on the integrated peak areas of the C 1s and O 1s peaks, the atomic contents of C and O in a-MSs-500-4 are estimated to be 97.5 and 2.5%, respectively.

As displayed in Fig. 2a, the XRD pattern of a-MSs-500-4 power exhibits a broad diffraction peak at about 24°, indicating the amorphous characteristic of a-MSs-500-4 carbon matrix. Sharp diffraction peaks of pristine sulfur powder demonstrate that sublimed sulfur exists in an Fddd orthorhombic phase (JCPDS: 08-0247). The characteristic peaks of element sulfur cannot be detected in the a-MSs-500-4/S composites, indicating that sulfur is highly infused inside the a-MSs-500-4 network. The Raman spectrum of elemental sulfur displays characteristic peaks at 100–500 cm−1, which corresponds to S–S bond vibration in S8 crystal (Fig. S3). However, Raman vibration peaks of elemental sulfur cannot be detected in a-MSs-500-4/71 composite, which also indicates that sulfur is finely incorporated inside the a-MSs-500-4 framework pores. Sulfur content in a-MSs-500-4/S composites is analyzed by taking TGA measurements under nitrogen atmosphere (Fig. 2b). Results suggest that the content of sulfur in a-MSs-500-4/S is close to the designed amount. As shown in Fig. 2c, the nitrogen absorption volume of the a-MSs-500-4/S composite samples decreases significantly after sulfur infusion. Meanwhile, the main peaks in the pore size distribution curves of a-MSs-500-4/S composites markedly decrease after sulfur encapsulation (Fig. 2d). Additionally, the specific surface area of a-MSs-500-4 decreases significantly from 3334 m2 g−1 to merely 356 and 69 m2 g−1 for a-MSs-500-4/60 and a-MSs-500-4/71 composites, respectively, and the total pore volume is reduced from 2.17 cm3 g−1 to 0.34 and 0.10 cm3 g−1, respectively. These results reveal that sulfur is finely incorporated into the pores of the a-MSs-500-4 carbon matrix. The ultrahigh specific surface area and large pore volume of a-MSs-500-4 can achieve a theoretical maximum sulfur loading of 71 wt% and boost sulfur utilization in electrochemical reactions. Moreover, small pores of the a-MSs-500-4 host can effectively entrap sulfur and polysulfides during charge/discharge cycling.


image file: c6ra05560e-f2.tif
Fig. 2 (a) XRD patterns of elemental sulfur, a-MSs-500-4, and a-MSs-500-4/S composites. (b) TGA profiles of a-MSs-500-4/S composites and sublimed sulfur. (c) N2 adsorption–desorption isotherms and (d) pore size distributions of a-MSs-500-4 and a-MSs-500-4/S composites (insets in (c) show magnified N2 adsorption–desorption isotherms in the dashed rectangular area).

SEM and TEM characterizations were carried out to analyse the morphology of a-MSs-500-4 activated carbon and a-MSs-500-4/60 composite. As presented in Fig. 3a and b, channel-like macropores with diameters of ∼5 μm are observed in pyrolytic MSs-500. These macropores are inherited from the raw MSs (Fig. S4). The presence of abundant macropores contributes to sufficient absorption of the activation agent (KOH), which enables complete activation and formation of a more porous structure. After the activation and grinding process, the macroporous structure is destroyed, and micron-sized particles are obtained for a-MSs-500-4 (Fig. 3c). No apparent difference in morphology and size of a-MSs-500-4/60 composite is observed and no aggregation of bulk sulfur is found on the surface of a-MSs-500-4/60 (Fig. 3d), these results suggest that the complete encapsulation of sulfur into the a-MSs-500-4 carbon host. The TEM image shows that small-size nanopores are homogeneously distributed throughout the a-MSs-500-4 particles (sites marked with red arrows in Fig. 3e), allowing effective entrapment of sulfur and polysulfides. As shown in Fig. 3f, the TEM image of a-MSs-500-4/60 demonstrates that the amorphous-state sulfur is impregnated within the nanopores of a-MSs-500-4 host. The elemental mapping images of a-MSs-500-4/60 composite (Fig. 3h and i) indicate that sulfur is homogeneously dispersed in the a-MSs-500-4 network.


image file: c6ra05560e-f3.tif
Fig. 3 SEM images of (a and b) pyrolytic MSs-500, (c) a-MSs-500-4, and (d) a-MSs-500-4/60 composite. TEM images of (e) a-MSs-500-4 and (f) a-MSs-500-4/60 composites. (g) Low-magnification SEM image of a-MSs-500-4/60 composite and the corresponding elemental mapping images of (h) carbon and (i) sulfur.

Fig. 4a exhibits the CVs of a-MSs-500-4/60 composite cathode in the potential range of 1.7–2.7 V at a scanning rate of 0.05 mV s−1. Based on the multiple reaction mechanism between sulfur and lithium, the cathodic peaks at ∼2.29 V correspond to the reduction of elemental sulfur to long-chain polysulfides (Li2Sn, 4 ≤ n ≤ 8); the second peaks at ∼2.06 V are related to further reduction of the polysulfides to Li2S2/Li2S. In the subsequent anodic oxidation process, the sharp anodic peaks at 2.35 V should be ascribed to the oxidation of Li2S2/Li2S to sulfur or Li2S8.36–38 In comparison, two separated anodic peaks with slightly overlapping features at ∼2.39 V and ∼2.37 V can be observed for the a-MSs-500-4/71 composite cathode (Fig. 4b), which may be due to a slowdown in the cathode reaction kinetics with high sulfur loading.15,17 During the initial five cycles, no remarkable change in the shape and position can be detected in the redox peaks, indicating excellent cycling stability of a-MSs-500-4/60 composite cathode.


image file: c6ra05560e-f4.tif
Fig. 4 CVs of the initial five cycles for (a) the a-MSs-500-4/60; (b) the a-MSs-500-4/71 composite cathodes.

Coin cells are assembled to test the electrochemical property of a-MSs-500-4/S composite cathodes for Li–S batteries. As current densities increase from 200 mA g−1 to 6400 mA g−1 (Fig. 5a), the charge/discharge profiles of galvanostatic cycling for the a-MSs-500-4/60 electrode maintain a typical two-plateau behavior of sulfur cathode. Fig. 5b presents that the assembled coin cell delivers specific discharge capacities of approximately 1100, 920, 820, 720, 620, and 550 mA h g−1 at 200, 400, 800, 1600, 3200, and 6400 mA g−1, respectively, thereby suggesting good rate behavior. Moreover, the discharge capacity can be mostly recovered when the current density is tuned back to 800 mA g−1. The high rate capacity shall be ascribed to the good electrical conductivity of the a-MSs-500-4 carbon host, which facilitates electronic transport and lithium ion diffusion during charge/discharge cycling.39,40 To further investigate the electrochemical property of a-MSs-500-4/60 composite cathode, the long-term cycling test is carried out at 800 mA g−1. As displayed in Fig. 5d, after an initial capacity of 937 mA h g−1, the a-MSs-500-4/60 cathode exhibits a maximum reversible capacity of 839 mA h g−1 in the 3rd cycle. This capacity decreased to 536 mA h g−1 at the end of 500 cycles (64% capacity retention) at 800 mA g−1, showing excellent long-term cycling stability. The charge/discharge voltage plateaus are relatively stable over 500 cycles (Fig. 5c). In addition, the average coulombic efficiency of the cell is as high as ∼95% without any electrolyte additives (such as LiNO3). The high coulombic efficiency of a-MSs-500-4/60 is due to the well-developed pore structure of a-MSs-500-4 matrix, which can effectively confine the polysulfides diffusion and suppress the shuttle effect.


image file: c6ra05560e-f5.tif
Fig. 5 (a) The typical galvanostatic charge/discharge profiles and (b) rate capability of the a-MSs-500-4/60 composite electrode from 200 mA g−1 to 6400 mA g−1. (c) The voltage vs. capacity profiles at different cycles and (d) long-term cycling performance and coulombic efficiency of a-MSs-500-4/60 over 500 cycles at 800 mA g−1.

Considering that the entire mass of the composite is more critical to practical application, the electrochemical performance of a-MSs-500-4/S composite electrode with higher sulfur content is evaluated. Theoretically, 1.00 g of a-MSs-500-4 can accommodate 3.60 g of Li2S (1.66 g cm−3 × 2.17 cm3 g−1, which is the density of Li2S multiplied by the pore volume of a-MSs-500-4), corresponding to a maximum of 2.50 g of sulfur (71 wt% sulfur content). Though the a-MSs-500-4/71 cathode shows a slight decrease of rate capability in comparison with the a-MSs-500-4/60 (Fig. S5), it exhibits a maximum reversible capacity of 826 mA h g−1 (the 3rd cycle) at 800 mA g−1 and shows a similar capacity retention of 64% after 500 cycles (526 mA h g−1) as compared to the a-MSs-500-4/60 (Fig. 6a). The result suggests that the a-MSs-500-4 carbon matrix can effectively confine the polysulfides diffusion and accommodate the volume expansion of sulfur with a high sulfur content of up to 71 wt%. Fig. 6b shows the long-term cycling performance and coulombic efficiency of a-MSs-500-4/71 at 1600 mA g−1. After an initial capacity of 837 mA h g−1, a maximum reversible capacity of 776 mA h g−1 in the 2nd cycle is obtained. This capacity decreases to 573, 532, and 505 mA h g−1 after 100, 200, and 300 cycles, indicating capacity retentions of 74%, 69%, and 65%, respectively. Even after 500 cycles, the capacity of the electrode remains at 458 mA h g−1, representing 59% capacity retention. Moreover, even after prolonged cycling to 1000 cycles, the discharge capacity still retains at 347 mA h g−1, corresponding to a capacity retention of 45%. The endurance test results demonstrate superior stability for long-term cycling Li–S batteries of the a-MSs-500-4/71 composite electrode. In fact, the a-MSs-500-4/71 composite cathode displays the least capacity fade rate (0.055% per cycle) during 1000 cycles in comparison with other porous carbon/sulfur composite cathodes with high sulfur loadings (Table 2).9,15,17,38,41–44 In addition, the average coulombic efficiency at 1600 mA g−1 is greater than 96%. As shown in Fig. 6c, after 1 wt% LiNO3 is introduced as the electrolyte additive, the average coulombic efficiency over 500 cycles at 800 mA g−1 of a-MSs-500-4/71 is increased from approximately 93% (Fig. 6a) to 99%.45,46 Furthermore, during the long-term cycling process, the charge/discharge voltage plateaus of a-MSs-500-4/71 keep relatively stable (Fig. S6). The galvanostatic charge/discharge profiles of the bare a-MSs-500-4 carbon electrode were tested under the same conditions for comparison (Fig. S7). The activated carbon electrode shows a specific discharge capacity of ∼25 mA h g−1, indicating that the high capacity of a-MSs-500-4/S composite is essentially contributed by the active sulfur material. Consequently, the activated carbon component is mainly used as a supporting framework and conductive agent in the a-MSs-500-4/S composite electrode. The ultrahigh specific surface area and large pore volume of the a-MSs-500-4 carbon host can achieve high sulfur loading and boost sulfur utilization in electrochemical reactions. The small-size nanopore structure of a-MSs-500-4 can effectively constraint the polysulfides diffusion, leading to superior long-term cycling stability.


image file: c6ra05560e-f6.tif
Fig. 6 The long-term stability and coulombic efficiencies of the a-MSs-500-4/71 composite electrode: (a) over 500 cycles at 800 mA g−1; (b) over 1000 cycles at 1600 mA g−1; and (c) over 500 cycles at 800 mA g−1 with 1 wt% LiNO3 as electrolyte additive.
Table 2 Comparison of the texture parameters and electrochemical performances of the porous carbon hosts used as the high sulfur loading cathode materials for Li–S batteries
Carbon host materials SBET (m2 g−1) VP (cm3 g−1) S (%) Capacity fade (% per cycle) Cycle Rate (mA g−1) Ref.
Mesoporous carbon CMK-3 1976 2.1 70 1 20 168 9
Activated graphene nanosheets 2313 1.8 67 0.26 100 1675 38
Micro/mesoporous activated graphene 3000 2.14 75 0.12 200 1675 17
Activated porous carbon nanospheres 1800 5.4 80 0.32 100 1675 41
Silk fibroin protein-derived carbon 2454 1.57 73 0.483 60 335 42
Graphene-based layered porous carbon 2500 1.94 68 0.3 100 838 43
3D graphene-like porous carbon 2700 2.5 72 0.13 200 838 44
3D graphene@microporous carbon 3374 2.65 75 ∼0.096 500 838 15
Mango stone-derived activated carbon 3334 2.17 71 0.055 1000 1600 Our work


4. Conclusion

A series of MS-derived activated carbons with adjustable porous structure are prepared. The optimal pre-carbonized temperature is 500 °C and KOH/char mass ratio is 4 for the material. The as-prepared a-MSs-500-4 activated carbon exhibits maximum specific surface area of 3334 m2 g−1 and pore volume of 2.17 cm3 g−1 among them. When applied to Li–S batteries, the a-MSs-500-4/S composite cathode with 71 wt% sulfur loading exhibits 64% capacity retention over 500 cycles at 800 mA g−1 and 45% capacity retention over 1000 cycles at 1600 mA g−1, respectively. The well-developed porous structure of a-MSs-500-4 is the dominant factor in improving the electrochemical performance of the cells. Our results are promising in developing high sulfur loading cathode materials for long cycle-life Li–S batteries.

Acknowledgements

This work was supported by the National Natural Science Foundation of China (NSFC-51202106, 21201010, 21173183, and 21505118), ​the Priority Academic Program Development of Jiangsu Higher Education Institutions, the Program for New Century Excellent Talents of the University in China (grant no. NCET-13-0645), Plan for Scientific Innovation Talent of Henan Province, Program for Innovative Research Team (in Science and Technology) in University of Henan Province (14IRTSTHN004, 16IRTSTHN003), the Science & Technology Foundation of Henan Province (122102210253 and 13A150019), the Science & Technology Foundation of Jiangsu Province (BK20150438), the Six Talent Plan (2015-XCL-030), and the China Postdoctoral Science Foundation (2012M521115). We also acknowledge the technical support we received at the Testing Center of Yangzhou University.

References

  1. A. Manthiram, Y. Fu, S. H. Chung, C. Zu and Y. S. Su, Chem. Rev., 2014, 114, 11751 CrossRef CAS PubMed.
  2. N. Li, Y. Wang, D. Tang and H. Zhou, Angew. Chem., Int. Ed., 2015, 127, 9403 CrossRef.
  3. P. G. Bruce, S. A. Freunberger, L. J. Hardwick and J. M. Tarascon, Nat. Mater., 2012, 11, 19 CrossRef CAS PubMed.
  4. Y. L. Ding, P. Kopold, K. Hahn, P. A. van Aken, J. Maier and Y. Yu, Adv. Funct. Mater., 2015, 26, 1112 CrossRef.
  5. Z. W. Seh, W. Li, J. J. Cha, G. Zheng, Y. Yang, M. T. McDowell, P. C. Hsu and Y. Cui, Nat. Commun., 2013, 4, 1331 CrossRef PubMed.
  6. S. Chen, X. Huang, B. Sun, J. Zhang, H. Liu and G. Wang, J. Mater. Chem. A, 2014, 2, 16199 CAS.
  7. S. Zhang, N. Li, H. Lu, J. Zheng, R. Zang and J. Cao, RSC Adv., 2015, 5, 50983 RSC.
  8. N. Li, M. Zheng, H. Lu, Z. Hu, C. Shen, X. Chang, G. Ji, J. Cao and Y. Shi, Chem. Commun., 2012, 48, 4106 RSC.
  9. X. Ji, K. T. Lee and L. F. Nazar, Nat. Mater., 2009, 8, 500 CrossRef CAS PubMed.
  10. L. Wang, Y. Wang and Y. Xia, Energy Environ. Sci., 2015, 8, 1551 CAS.
  11. S. Chen, X. Huang, H. Liu, B. Sun, W. Yeoh, K. Li, J. Zhang and G. Wang, Adv. Energy Mater., 2014, 4 DOI:10.1002/aenm.201301761.
  12. B. Zhang, X. Qin, G. R. Lia and X. P. Gao, Energy Environ. Sci., 2010, 3, 1531 CAS.
  13. D. S. Jung, T. H. Hwang, J. H. Lee, H. Y. Koo, R. A. Shakoor, R. Kahraman, Y. N. Jo, M. S. Park and J. W. Choi, Nano Lett., 2014, 14, 4418 CrossRef CAS PubMed.
  14. L. Zeng, F. Pan, W. Li, Y. Jiang, X. Zhong and Y. Yu, Nanoscale, 2014, 6, 9579 RSC.
  15. N. W. Li, Y. X. Yin and Y. G. Guo, RSC Adv., 2016, 6, 617 RSC.
  16. J. Wang and S. Kaskel, J. Mater. Chem., 2012, 22, 23710 RSC.
  17. Y. You, W. Zeng, Y. X. Yin, J. Zhang, C. P. Yang, Y. Zhu and Y. G. Guo, J. Mater. Chem. A, 2015, 3, 4799 CAS.
  18. C. Liang, N. J. Dudney and J. Y. Howe, Chem. Mater., 2009, 21, 4724 CrossRef CAS.
  19. H. Ye, Y. X. Yin, S. Xin and Y. G. Guo, J. Mater. Chem. A, 2013, 1, 6602 CAS.
  20. Z. Li, Y. Jiang, L. Yuan, Z. Yi, C. Wu, Y. Liu, P. Strasser and Y. Huang, ACS Nano, 2014, 8, 9295 CrossRef CAS PubMed.
  21. P. Strubel, S. Thieme, T. Biemelt, A. Helmer, M. Oschatz, J. Brückner, H. Althues and S. Kaskel, Adv. Funct. Mater., 2015, 25, 287 CrossRef CAS.
  22. J. Wang, Y. S. He and J. Yang, Adv. Mater., 2015, 27, 569 CrossRef CAS PubMed.
  23. F. Xu, Z. Tang, S. Huang, L. Chen, Y. Liang, W. Mai, H. Zhong, R. Fu and D. Wu, Nat. Commun., 2015, 6, 7221 CrossRef PubMed.
  24. K. Karthikeyan, S. Amaresh, S. N. Lee, X. Sun, V. Aravindan, Y. G. Lee and Y. S. Lee, ChemSusChem, 2014, 7, 1435 CrossRef CAS PubMed.
  25. T. Zhang, M. Zheng, N. Li, H. Lu, S. Zhang and J. Cao, Mater. Lett., 2013, 105, 43 CrossRef CAS.
  26. J. Guo, J. Zhang, F. Jiang, S. Zhao, Q. Su and G. Du, Electrochim. Acta, 2015, 176, 853 CrossRef CAS.
  27. J. Wang, Z. Yang, F. Pan, X. Zhong, X. Liu, L. Gu and Y. Yu, RSC Adv., 2015, 5, 55136 RSC.
  28. Y. Yao and F. Wu, Nano Energy, 2015, 17, 91 CrossRef CAS.
  29. H. Shang, Y. Lu, F. Zhao, C. Chao, B. Zhang and H. Zhang, RSC Adv., 2015, 5, 75728 RSC.
  30. J. Liu, P. Kopold, P. A. Aken, J. Maier and Y. Yu, Angew. Chem., Int. Ed., 2015, 127, 9768 CrossRef.
  31. S. Wei, H. Zhang, Y. Huang, W. Wang, Y. Xia and Z. Yu, Energy Environ. Sci., 2011, 4, 736 CAS.
  32. S. Zhang, M. Zheng, Z. Lin, N. Li, Y. Liu, B. Zhao, H. Pang, J. Cao, P. He and Y. Shi, J. Mater. Chem. A, 2014, 2, 15889 CAS.
  33. E. R. Piñero, F. Leroux and F. Béguin, Adv. Mater., 2006, 18, 1877 CrossRef.
  34. X. Liu, D. Zhang, B. Guo, Y. Qu, G. Tian, H. Yue and S. Feng, RSC Adv., 2015, 5, 93491 RSC.
  35. J. Wang, A. Heerwig, M. R. Lohe, M. Oschatz, L. Borchardt and S. Kaskel, J. Mater. Chem., 2012, 22, 13911 RSC.
  36. C. Wu, L. Fu, J. Maier and Y. Yu, J. Mater. Chem. A, 2015, 3, 9438 CAS.
  37. K. Zhang, Q. Zhao, Z. Tao and J. Chen, Nano Res., 2013, 6, 38 CrossRef CAS.
  38. B. Ding, C. Yuan, L. Shen, G. Xu, P. Nie, Q. Lai and X. Zhang, J. Mater. Chem. A, 2013, 1, 1096 CAS.
  39. H. Xue, J. Zhao, J. Tang, H. Gong, P. He, H. Zhou, Y. Yamauchi and J. He, Chem. Eur.–J., 2016, 22, 4915 CrossRef CAS PubMed.
  40. J. Ni, S. Fu, C. Wu, J. Maier, Y. Yu and L. Li, Adv. Mater., 2016, 28, 2259 CrossRef CAS PubMed.
  41. G. He, S. Evers, X. Liang, M. Cuisinier, A. Garsuch and L. F. Nazar, ACS Nano, 2013, 7, 10920 CrossRef CAS PubMed.
  42. J. Zhang, Y. Cai, Q. Zhong, D. Lai and J. Yao, Nanoscale, 2015, 7, 17791 RSC.
  43. X. Yang, L. Zhang, F. Zhang, Y. Huang and Y. Chen, ACS Nano, 2014, 8, 5208 CrossRef CAS PubMed.
  44. Y. Li, Z. Li, Q. Zhang and P. K. Shen, J. Mater. Chem. A, 2014, 2, 4528 CAS.
  45. S. S. Zhang, Electrochim. Acta, 2012, 70, 344 CrossRef CAS.
  46. S. S. Zhang, J. Electrochem. Soc., 2012, 159, A920 CrossRef CAS.

Footnote

Electronic supplementary information (ESI) available. See DOI: 10.1039/c6ra05560e

This journal is © The Royal Society of Chemistry 2016
Click here to see how this site uses Cookies. View our privacy policy here.