Assessment of gas production from natural gas hydrate using depressurization, thermal stimulation and combined methods

Yongchen Song, Lunxiang Zhang, Qin Lv, Mingjun Yang, Zheng Ling and Jiafei Zhao*
School of Energy and Power Engineering, Dalian University of Technology, Dalian 116024, P. R. China. E-mail: jfzhao@dlut.edu.cn; Fax: +86 411 84706722; Tel: +86 411 84706722

Received 2nd March 2016 , Accepted 4th May 2016

First published on 6th May 2016


Abstract

The largest sources of hydrocarbons worldwide are distributed in the permafrost and submarine sediments in the form of methane hydrates, but exploitation of these hydrocarbons is still years away from being economical, safe, and commercially viable; thus, further research is needed. To analyze the characteristics of methane hydrate (MH) dissociation and evaluate the gas production during the application of different MH decomposition methods, this study firstly compared MH dissociation during depressurization, thermal stimulation, and combined method (depressurization + thermal stimulation) treatments using magnetic resonance imaging (MRI) in situ observation. In particular, the influences of back-pressure and temperature on hydrate dissociation, the hydrate saturation, the rate of hydrate dissociation and MRI images from each of the three methods were investigated. The results proved that during application of the depressurization and combined methods at different back-pressures (2.2–2.6 MPa), the MH dissociation proceeded via radial dissociation rather than axial dissociation; moreover, during the application of the thermal stimulation method at different dissociation temperatures (278.15–288.15 K), the MH dissociated uniformly. Overall, a combination of depressurization and thermal stimulation at the initial stage of hydrate decomposition was proposed and comparison of the three methods demonstrated that the combined method had obvious advantages for methane treatment. Specifically, the combined method was capable of solving the problems related to low gas production and poor energy efficiency that were encountered when using either the depressurization or thermal stimulation method alone.

1. Introduction

Clathrates of natural gas, which are commonly referred to as methane hydrates, are crystalline solid hydrocarbon compounds that form when methane and water coexist at sufficiently low temperatures and high pressures.1 The largest sources of these hydrocarbons worldwide are distributed in the permafrost and submarine sediments, and methane hydrate amounts are estimated to be 21 × 1015 m3, which is larger than all oil, coal, and conventional gas reserves combined.2,3 Interest in the industrial production of gas from natural hydrate sediments has been increasing over the past few decades and the first gas production field test from occurring naturally marine gas-hydrate deposits in Nankai Trough under the funding from the Ministry of Economy, Trade and Industry (MEIT) of Japan,4 but such production is still years away from being economical, safe, and commercially viable; thus, further research is needed.5,6

Methods that have been proposed for natural gas extraction from hydrates include depressurization, thermal stimulation, chemical inhibitor injections, and CO2 replacement.7 For gas hydrate production via depressurization, the system pressure is decreased to a value below that required for hydrate formation at a given temperature,8 and such threshold values have been researched numerically9–11 and experimentally.12–14 Depressurization is considered the most promising of the proposed methods as it can achieve the highest energy profit ratio and is the most technologically feasible.12,15,16 However, gas production by depressurization is affected by insufficient heat transfer from the reservoir and the ambient environment, which leads to significant decreases in the gas production rate.17–20 For instance, because of insufficient heat transfer from the reservoir and the ambient environment, hydrate reformation and ice generation may plug the pores with low permeability.21–23 For gas hydrate production via thermal stimulation, the system temperature is increased to a value above that required for hydrate formation at a given pressure,24 and this has been the subject of extensive numerical25–27 and experimental24,28,29 research over the past several years. While the thermal stimulation method can effectively solve the problems of low gas production that occur in the depressurization method,30–33 this method suffers from problems associated with the loss of heat that is needed to improve the temperature of hydrate-bearing geologic reservoirs, and thus, poor energy efficiencies.31 Further comparisons of these two methods would be valuable,34 and in particular, a combined treatment method involving both depressurization and thermal stimulation is worthy of study as this could potentially solve the problems of low gas production and poor energy efficiency.12,34–36 Demirbas34 proved that the depressurization method for gas production from hydrate is more effective and economical than the thermal stimulation method. Moridis et al.12 noted that the most promising production strategy for Class 2 hydrates involves combinations of depressurization and thermal stimulation, and production is clearly enhanced by multi-well production–injection systems. Bai et al.35 developed a mathematical model to compare the depressurization method, the warm water flooding method (a thermal stimulation method), and the combination of these two methods. The results showed that under certain conditions the combination method has a higher gas production rate than either single method alone. Song et al.36 performed experiments on methane hydrate dissociation by using depressurization, thermal stimulation, and combination of these methods, and pointed out that the combined method effectively improved gas production and energy efficiency.

Most experimental investigations have been conducted to analyze the characteristics of hydrate dissociation in a closed vessel, and the traditional method cannot be used to directly observe hydrate decomposition. Several methods have recently been used to monitor methane hydrate (MH) dissociation directly, such as magnetic resonance imaging (MRI), Raman spectroscopy, scanning electron microscopy (SEM), and X-ray computed tomography (CT). Komai et al.37 performed a series of experiments to analyze the kinetics of MH dissociation via in situ Raman spectroscopy. Kneafsey et al.38 performed experiments on MH formation and dissociation under different conditions, and the results showed that water density changes as a result of hydrate formation and dissociation. The use of MRI has become popular in investigations of hydrate formation and dissociation in recent years. Baldwin et al.39 demonstrated that the entire process of hydrate formation and dissociation in sandstone could be monitored effectively by MRI, as the data show high contrast between water and hydrate. Cheng et al.40 observed carbon dioxide hydrate formation and dissociation by using MRI under different hydrate saturation conditions, and the results showed that MRI can produce a strong signal in water. Ersland et al.41 observed the exchange of methane gas with carbon dioxide from MH by using MRI, thereby providing clear information about the rates of hydrate formation and of CO2–CH4 exchange.

Overall, although much research has been conducted on gas production methods, there are very few studies on in situ observations of the different methods used for MH dissociation. In this study, the analysis of characteristics of MH dissociation and assessment of gas discussion by different methods were firstly discussed using MRI in situ observations. In particular, the MRI images were obtained to observe the phenomena of ice generation and ice reformation. Moreover, the influences of back-pressure and temperature on hydrate dissociation were investigated and a combination method of depressurization and thermal stimulation at the initial stage of hydrate decomposition was proposed. In addition, the hydrate dissociation rates of depressurization, thermal stimulation and the combined method were calculated separately to evaluate the gas production by different methods. Then, the three methods were compared and suggestions were given.

2. Experimental section

2.1. Materials

Methane gas with a purity of 99.99% was supplied by the Dalian Special Gas Co., Ltd., China. Deionized water was supplied by a water purification system in the laboratory. Quartz glass beads (ASONE, Co., Ltd., Japan) BZ-01 (0.080–0.120 mm, average 0.1 mm) were used to imitate the porous media in the MRI vessel. The MRI vessel was made of nonmagnetic material (polyimide) to minimize the interference on the radio frequency (RF field artifacts of the imaging system. Coolant (3M Fluorinert FC-40, St. Paul, MN, USA) was used to control the temperature of the vessel, which cannot be visualized by MRI, and therefore minimized the interference of RF field artifacts on the imaging system.

2.2. Apparatus

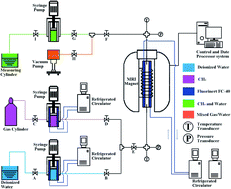
Fig. 1 presents a simplified schematic of the experimental apparatus. The apparatus consists of an MRI system, a polyimide vessel with a design pressure of 12 MPa, a data acquisition system to record the pressure and temperature conditions, high-pressure pumps, refrigerated circulators, a vacuum pump, a gas supply system, a water purification system, and a measuring cylinder. Details of the devices used in these experiments are listed in Table 1.
image file: c6ra05526e-f1.tif
Fig. 1 Schematic of the experimental apparatus.
Table 1 Details of the devices used in the experiment
Item Model Precision Provider
Data acquisition system ADAM4000   Advantech
High-pressure pump 260D   Teledyne ISCO Inc., USA
Refrigerated circulator F25-ME 0.01 K JULABO Inc., Germany
Vacuum pump SHB-111A   SJSK Exp. Co., Ltd, China
Water purification system aquapro2S   Aquapro International Company LLC., USA
Pressure transducer   0.1 MPa Nagano Co., Ltd., Japan
Temperature transducer   0.1 K Yamari Industries, Japan


An MRI system operating at a resonance of 400 MHz and 9.4 Tesla for measuring 1H was used to observe the MH formation and dissociation processes directly. A 1H 40 mm Millipede vertical micro-imaging probe was used, and the gradient coils provided a maximum gradient strength of 50 G cm−1. 1H MRI technology produces images of hydrogen contained in liquids, but it does not image hydrogen contained in CH4 and solids such as crystal ice or MH because of their much shorter transverse relaxation times.42 A spin-echo multi-slice pulse sequence (SEMS) was used to image the formation and dissociation of gas hydrates. The time of repetition (TR) was 1000 ms, the time of echo (TE) was 4.39 ms, and the image data matrix was 128 × 128 pixels; the data matrix was collected at a comparative resolution of about 0.23 × 0.23 mm2 per pixel. The field of view (FOV) was 30 mm × 30 mm with 4.0 mm thickness, and the acquisition time of the sequence was 2 min 8 s.

The inside volume of the polyimide vessel for packed glass beads was 35.34 mL with a diameter of 15 mm and a height of 200 mm. The porosity of BZ-01 was 0.348, and the pore volume of the vessel was 12.30 mL. Coolant circulating within a jacket surrounding the vessel was used to control the temperature of the vessel during the formation and dissociation of hydrate. Pressure transducers and temperature transducers were connected to the vessel to allow for the collection of measurement data.

2.3. Procedures

The experimental process was divided into the following two parts: (1) the formation of MH in porous media and (2) the dissociation of MH during application of the depressurization, thermal stimulation, and combined methods.
2.3.1. Methane hydrate formation in porous media. The vessel was first filled with clean, dry glass beads, and then, it was attached to the experimental apparatus and placed into the MRI system. Next, the vessel was evacuated for 30 min by using a vacuum pump to remove the impurities in the gas of the experimental system. Then, deionized water was injected into the vessel by a high-pressure pump at a rate of 1 mL min−1 until the pressure reached the given pressure of 6 MPa. The pressure was kept steady for an hour, and then, the free water was discharged following the injection of high-pressure nitrogen into the porous medium. Finally, the vessel was again evacuated and CH4 gas was subsequently injected into the vessel until the pressure increased to the designated pressure of 6 MPa. In this study, during the hydrate formation process, the refrigerated circulator maintained the system at a steady temperature (275.15 ± 0.1 K) at which the equilibrium pressure was around 3.3 MPa. The intensity of the MRI signal changes as a result of hydrate formation in the vessel. After several hours, specifically, after the MRI signal intensity and the system pressure and temperature had stabilized for an hour, the formation of hydrate was considered completely finished.
2.3.2. Methane hydrate dissociation during the application of different methods. As shown in Table 2, to investigate the effect of back-pressure on hydrate dissociation using the depressurization method, eight separate experiments (Cases 1 to 8) were conducted at different back-pressures (2.6 and 2.2 MPa) for a given depressurizing rate. After the formation of MH in porous media, the back-pressure pump was first set to the equilibrium pressure. Then, the valves F and G were opened so that the vessel and the back-pressure pump were connected. Finally, the back-pressure was decreased and the dissociation experiment was initiated. For Cases 1 and 2, the back-pressure was kept constant at 2.6 and 2.2 MPa, respectively, during hydrate dissociation. For Cases 3 to 8, back-pressure was reduced from 3.3 MPa to either 2.6 MPa or 2.2 MPa at depressurizing rates of 0.01 MPa min−1, 0.05 MPa min−1, and 0.1 MPa min−1, and then, it was kept constant at 2.6 MPa or 2.2 MPa during hydrate dissociation. During hydrate dissociation, the refrigerated circulator maintained the system temperature at 275.15 ± 0.1 K.
Table 2 Operating conditions and experimental results by depressurization method
Exp. no. Initial hydrate saturation (volume fraction) Average dissociation rate (%/min) Initial back pressure (Mpa) Rate of pressure drop (Mpa min−1) Range of pressure drop (Mpa) Final back pressure (Mpa)
1 23.97% 0.25 3.3 0.7 2.6
2 24.46% 0.23 3.3 1.1 2.2
3 20.86% 0.20 3.3 0.01 0.7 2.6
4 25.99% 0.28 3.3 0.01 1.1 2.2
5 20.83% 0.24 3.3 0.05 0.7 2.6
6 21.31% 0.33 3.3 0.05 1.1 2.2
7 22.43% 0.53 3.3 0.1 0.7 2.6
8 26.00% 0.61 3.3 0.1 1.1 2.2


As described in Table 3, to investigate the influence of dissociation temperatures on hydrate decomposition using the thermal stimulation method, five separate experiments (Cases 9 to 13) tests at different dissociation temperatures (e.g., 278.15 K, 280.65 K, 283.15 K, 285.65 K, and 288.15 K) were conducted. During the dissociation process, another refrigerated circulator was connected to the vessel, which was running in advance to maintain the system temperature at the given values. The outlet valve was closed, and consequently, the pressure of the vessel increased because of the dissociation of MH.

Table 3 Operating conditions and experimental results by thermal stimulation method
Exp. no. Initial hydrate saturation (volume fraction) Final hydrate saturation (volume fraction) Average dissociation rate (%/min) Initial temperature (K) Range of temperature rise (K) Final temperature (K)
9 30.98 19.89 0.13 275.15 3 278.15
10 30.83 15.95 0.14 275.15 5.5 280.65
11 27.01 0.09 0.40 275.15 8 283.15
12 32.71 0 0.70 275.15 10.5 285.65
13 32.61 0 1.27 275.15 13 288.15


To improve the gas production and energy efficiency when MH exploitation, a combination of depressurization and thermal stimulation method was conducted for four separate experiments (Cases 14 to 17), as described in Table 4. After hydrate formation was complete, the vessel and the back-pressure pump were connected. Back-pressure of the vessel was reduced from 3.3 MPa to either 2.6 MPa or 2.2 MPa and then kept constant at 2.6 MPa or 2.2 MPa during hydrate dissociation. From 0 to 12.8 min during the dissociation process, the system temperature was increased from 275.15 K to either 278.15 K or 280.65 K. After that, the system temperature was maintained at 275.15 ± 0.1 K by using the refrigerated circulator.

Table 4 Operating conditions and experimental results by combined method
Exp. no. Initial hydrate saturation (volume fraction) Average dissociation rate (%/min) Cycle 1 (0–10 min) Cycle 2 (10 minutes later)
Pressure Temperature Pressure Temperature
Initial (Mpa) Final (Mpa) Initial (K) Final (K) Initial (Mpa) Final (Mpa) Initial (K) Final (K)
14 23.38% 0.26 3.3 2.6 275.15 278.15 2.6 2.6 278.15 275.15
15 26.54% 0.54 3.3 2.6 275.15 280.65 2.6 2.6 280.65 275.15
16 28.82% 0.31 3.3 2.2 275.15 278.15 2.2 2.2 278.15 275.15
17 26.11% 0.68 3.3 2.2 275.15 280.65 2.2 2.2 280.65 275.15


The entire process of hydrate dissociation was observed by MRI, and hydrate dissociation was considered finished when there were no further changes in the signal intensity and system pressure and temperature. Each experiment was repeated in triplicate and imaged by MRI, because MH formation and dissociation is random and the FOV is smaller than the effective size of the vessel.

2.4. Determination of hydrate saturation and dissociation rates

The reaction of MH formation and dissociation can be described generally by eqn (1):
 
CH4 + hwH2O = CH4·hwH2O (1)
where hw is the hydration number (hw = 6).43 Thus, 1.25 mL of MH can be formed by 1 mL of fresh water at standard temperature and pressure (STP) conditions.

Hydrate saturation is defined as the volume fraction of the pore space occupied by MH that can be described by eqn (2) and (3), and it is quantified by using the mean intensity (MI) data as shown in eqn (4):

 
image file: c6ra05526e-t1.tif(2)
 
image file: c6ra05526e-t2.tif(3)
 
image file: c6ra05526e-t3.tif(4)
where nCH4,MH is the number of moles of methane in MH; MMH and ρMH are the molarity and density of MH, respectively; VMH and Vp are the volume of MH and the pore, respectively; Sw0 is the initial water saturation, and I0 and Ii are the MI of water at the initial time and the “i” minute time, respectively. Both saturation and MI are dimensionless.

The average hydrate dissociation rate (AHDR) can be described as follows:

 
image file: c6ra05526e-t4.tif(5)
where Sh is the MH saturation when hydrate formation can be considered as completely finished, and t is the time of MH dissociation.

The hydrate dissociation rate (HDR) can be expressed as shown in eqn (6):

 
image file: c6ra05526e-t5.tif(6)
where Sih and Sith are the hydrate saturation amounts at t = “i” and “i + Δt” minutes, respectively. “Δt” is 2 min 8 s, which was the acquisition time of the sequence.

The actual average gas production rate (AGPR) and gas production rate (GPR) can be expressed by eqn (7) and (8):

 
image file: c6ra05526e-t6.tif(7)
 
image file: c6ra05526e-t7.tif(8)
where nCH4 is the number of moles of produced methane that MH dissociate completely; nih and nith are the number of moles of produced methane at t = “i” and “i + Δt” minutes, respectively.

The relation between AHDR and AGPR, HDR and GPR can be expressed by eqn (9) and (10), respectively:

 
image file: c6ra05526e-t8.tif(9)
 
image file: c6ra05526e-t9.tif(10)

Thus, the dissociation rates of MH were obtained by MRI can reflect the actual gas production using different methods.

3. Results and discussion

Seventeen experiments were conducted to compare the characteristics of MH dissociation during the application of the depressurization, thermal stimulation, and combined methods. The initial hydrate saturation and dissociation conditions are summarized in Tables 2–4

3.1. Analysis of the hydrate dissociation characteristics

To investigate the characteristics of hydrate dissociation during the application of the depressurization method, eight experiments (Cases 1 to 8) were conducted. In the series of depressurization experiments, the MH was dissociated with a constant back-pressure of 2.6 MPa in Case 1. The hydrate saturation curves of Case 1 were calculated by the MI of the MRI images according to eqn (2); the MI, hydrate saturation, pressure, and temperature curves are presented in Fig. 2. As shown in Fig. 2, after depressurization, hydrate saturation increased from 0 to 17.1 min and then decreased continuously from 17.1 to 100 min until the MI and hydrate saturation remained constant, which indicated that hydrate dissociation was complete. Similar results were found by other researchers21,23,44 and the results in Cases 2 to 8, the data suggested that the hydrate dissociation process using depressurization method can be divided into two main stages, hydrate dissociation begins several minutes later after back-pressure decreased due to hydrate reformation and ice generation forming blockages in the porous medium. Fig. 3 shows the MRI images of the variation in water distribution with depressurization in Case 1. As mentioned in Section 2.2, 1H MRI technology produces images of hydrogen contained in liquids, which means that the MI data for the images are proportional to the water content, and the images present good distinctions between liquid water and other parts in a porous medium.42 The bright areas in the images represent liquid water, and the black areas represent other parts. As shown in Fig. 3, the hydrate dissociation images reveal radial dissociation rather than axial dissociation which indicated that the MH dissociated radially by depressurization method. This is because heat transfer during dissociation was along the radial direction for the coolant circulated within the vessel jacket. When MH dissociation with depressurization, the MI of water should be continuously increased as hydrate saturation continuously decreased. However, in images taken from 0 to 17.1 min of hydrate dissociation, the large number of water distribution decreases in the red region, which can be explained by hydrate reformation and ice generation due to insufficient heat transfer.
image file: c6ra05526e-f2.tif
Fig. 2 Variation in MI and hydrate saturation during MH dissociation with depressurization in Case 1.

image file: c6ra05526e-f3.tif
Fig. 3 MRI images of variation in the water distribution with depressurization in Case 1.

To analyze the characteristics of hydrate dissociation during the application of the thermal stimulation method, five experiments (Cases 9 to 13) were experimented. In the series of thermal stimulation experiments, the MH dissociated with a constant dissociation temperature of 278.15 K in Case 9. Fig. 4 shows the variation of MI, hydrate saturation, pressure, and temperature during hydrate dissociation by thermal stimulation in Case 9. As shown in Fig. 4, hydrate saturation decreased slightly from 0 to 6.4 min after the temperature increased to 278.15 K, and then, hydrate saturation decreased continuously from 6.4 to 76.8 min until the hydrate dissociation process was completed. This pattern was different from that of hydrate dissociation by depressurization. Which can be explained by the fact that the increased temperature of the surrounding environment was gradually transferred to the inside of the vessel when using thermal stimulation method. Fig. 5 shows the MRI images of the variation in water distribution with thermal stimulation in Case 9. As shown in Fig. 5, the solid hydrate dissociated to methane gas and water, thus leading to increases in MI homogeneously rather than radially during hydrate dissociation by thermal stimulation, which was different from the phenomenon observed by depressurization. The same results were found in similar studies.39,45 In addition, based on our previous investigations15,45,46 and our observations in this study, temperature variations influenced the MI only slightly during the experiment. Therefore, as mentioned in our previous study,46 we established a linear correlation between temperature and MI in the range of 275.15–288.15 K to calibrate the effect of temperature. However, further study is still needed in this regard.


image file: c6ra05526e-f4.tif
Fig. 4 Variation in MI and hydrate saturation during MH dissociation with thermal stimulation in Case 9.

image file: c6ra05526e-f5.tif
Fig. 5 MRI images of variation in the water distribution with thermal stimulation in Case 9.

To study the characteristic of hydrate dissociation during the application of the combined method, four experiments (Cases 14 to 17) were investigated. The variation of MI, hydrate saturation, pressure, and temperature during hydrate dissociation by the combined method in Case 17 are shown in Fig. 6. As observed, hydrate saturation increased rapidly between 0 and 12.8 min, during which the hydrate dissociation process was combined with depressurization (back-pressure drop from 3.3 to 2.2 MPa) and thermal stimulation (dissociation temperature increased from 275.15 K to 280.65 K). After that, the pressure and temperature of the vessel remained constant at 2.2 MPa and 275.15 K, respectively, and hydrate saturation decreased continuously and relatively slowly until the hydrate dissociation process was completed. Similar results found in Cases 14 to 16 demonstrate that the combined method reinforces the hydrate dissociation. Fig. 7 shows the MRI images of the variation in water distribution with the combined method in Case 17. The liquid water of the vessel increased rapidly and radially during hydrate dissociation. This can be explained by the sufficient heat transfer and pressure driving force used in the combined method. Thus, the blockage of pores due to hydrate reformation and ice generation during hydrate dissociation was avoided. These results demonstrate that the combined method is more effective for hydrate exploitation than either depressurization or thermal stimulation alone.


image file: c6ra05526e-f6.tif
Fig. 6 Variation in MI and hydrate saturation during MH dissociation with combinations of depressurization and thermal stimulation in Case 17.

image file: c6ra05526e-f7.tif
Fig. 7 MRI images of variation in the water distribution with combinations of depressurization and thermal stimulation in Case 17.

3.2. Hydrate dissociation influencing factors

To investigate the effect of back-pressure and dissociation temperature on the dissociation of MH during the application of the depressurization, thermal stimulation, and combined methods, 17 experiments were conducted. Fig. 8 shows the AHDR of Cases 1 to 17.
image file: c6ra05526e-f8.tif
Fig. 8 Average of hydrate dissociation rates with different methods.

In order to demonstrate the effect of back-pressure on hydrate dissociation by depressurization, four groups of controlled trials were conducted in Cases 1 to 8, and each of these involved the same depressurizing approach but different back-pressures. As shown in Fig. 8, between Cases 3 and 8, AHDRs with back-pressures of 2.2 MPa were higher than those with back-pressures of 2.6 MPa. These results demonstrate that with decreased back-pressure, AHDR increased for the same depressurizing approach. This can be explained by the fact that the driving force of pressure on hydrate dissociation increases when the pressure differential between the equilibrium pressure and the dissociation back-pressure is relatively high.10 Similar results were obtained in the experiments on hydrate dissociation by the combined method (Cases 14 to 17). For a given combined process (275.15 K to 278.15 K or 280.65 K from 0 to 10 min), AHDRs were higher for back-pressures of 2.2 MPa than those for back-pressures of 2.6 MPa. However, AHDR in Case 1 (2.6 MPa) was higher than that in Case 2 (2.2 MPa). This can be explained by the fact that a low back-pressure leads to a large temperature drop when using the depressurizing approach with a sudden pressure drop, which causes hydrate reformation and ice generation during hydrate dissociation, thus resulting in greater heat transfer and a slower dissociation rate.21,23

To analyze the influence of temperature on hydrate dissociation, five groups of controlled trials (Cases 9 to 13) were tested at different dissociation temperatures. Fig. 8 shows the AHDRs of MH at 278.15 K, 280.65 K, 283.15 K, 285.65 K, and 288.15 K. The results show that with increased dissociation temperature, the AHDR increased. These results demonstrate that the temperature gradient between the porous medium and the environment increases, thus leading to a larger driving force of heat transfer, which is beneficial to hydrate dissociation. Table 2 shows the initial and final hydrate saturations for Cases 9 to 13. As observed, MH in Cases 9 and 10 dissociated only partially. This is because hydrate dissociation temperatures were 278.15 K and 280.65 K given the corresponding equilibrium pressures of 4.25 MPa and 5.50 MPa, respectively, which were below the pressure of the injected methane gas (6 MPa); this therefore led to the partial decomposition of the hydrate, as calculated by using the phase equation developed by Kamath.47 Thus, higher dissociation temperatures will lead to more rapid and complete hydrate dissociation. However, the thermal stimulation method suffers from poor energy efficiency, as increased hydrate dissociation temperatures lead to losses of the heat needed to improve the temperature of the hydrate-bearing geologic reservoir.

3.3. Comparison of the three methods used for hydrate dissociation

Fig. 9 shows the AHDRs and HDRs with respect to time during hydrate decomposition by depressurization method. As shown in the figure, the AHDRs of Cases 1 and 2 were 0.25%/min and 0.23%/min for hydrate dissociation back-pressures of 2.6 MPa and 2.2 MPa, respectively. Fluctuations in HDR were observed in depressurization experiments (Cases 1 and 2), and similar fluctuations in the rate of gas production were found in other studies.23,36,48,49 The fluctuations in HDR were closely related to the insufficient heat transfer from the reservoir and ambient environment. At the initial stage of hydrate decomposition, the HDRs of Cases 1 and 2 were almost zero because of hydrate reformation and ice generation that formed blockages in the porous medium. These results suggest that heat injection at the initial stage of hydrate decomposition is necessary when using depressurization method. Additionally, the fluctuations in HDR could also be observed in other depressurization experiments (Cases 3 to 8). The AHDRs of Cases 3, 5, and 7 were 0.20%/min, 0.24%/min, and 0.53%/min for a hydrate dissociation back-pressure of 2.6 MPa with different depressurizing rates at 0.01 MPa min−1, 0.05 MPa min−1, and 0.1 MPa min−1, respectively. Analogously, the AHDRs of Cases 4, 6, and 8 were 0.28%/min, 0.33%/min, and 0.61%/min for a hydrate dissociation back-pressure of 2.2 MPa. At the same hydrate dissociation back-pressure of 2.2 MPa, the AHDRs of Cases 4, 6, and 8 were higher than those of Case 2.
image file: c6ra05526e-f9.tif
Fig. 9 Rate and average rate of hydrate dissociation versus time with depressurization method.

Fig. 9 shows the AHDRs and HDRs with respect to time during hydrate decomposition by thermal stimulation method. As observed in Fig. 10, the AHDRs of Cases 9 to 13 were 0.13%/min, 0.14%/min, 0.40%/min, 0.70%/min, and 1.27%/min for hydrate dissociation temperatures of 278.15 K, 280.65 K, 283.15 K, 285.65 K, and 288.15 K, respectively. Unlike the HDR fluctuations observed in Cases 1 to 8, the HDR of Cases 9 to 13 showed peak formations. The HDR increased rapidly as the temperature of the hydrate-bearing reservoir increased gradually, and it was especially high at the initial stage of hydrate decomposition because of sufficient and constant ambient heat transfer. As hydrate dissociation proceeded, HDR decreased significantly owing to complete hydrate decomposition. These results suggest that the thermal stimulation method can avoid the relatively low HDR and the fluctuations in HDR during hydrate dissociation by depressurization method. However, this method suffers from the loss of heat and poor energy efficiency, and it still needs further study.31


image file: c6ra05526e-f10.tif
Fig. 10 Rate and average rate of hydrate dissociation versus time with thermal stimulation method.

To address the problems of low gas production and poor energy efficiency, a limited amount of research34–36 on combined depressurization and thermal stimulation techniques has been conducted, and the findings suggest that the combined method is an effective way to solve these problems. Here, a combination of depressurization and thermal stimulation process at the initial stage of hydrate decomposition were conducted to study the combined method. Fig. 11 shows the AHDRs and HDRs with respect to time during hydrate decomposition by combined method. At the same dissociation back-pressure of 2.6 MPa, the AHDRs in the combined method were 0.26%/min and 0.31%/min (Cases 14 and 16, respectively), which were higher than the value of 0.25%/min observed in the depressurization method (Case 1). Analogously, at the same dissociation back-pressure of 2.2 MPa, the AHDRs in the combined method were 0.54%/min and 0.68%/min (Cases 15 and 17, respectively), which were higher than the value of 0.23%/min observed in the depressurization method (Case 2). These results prove that the combined method can solve the depressurization method's problem of low gas production. Meanwhile, MH dissociated only partially at the dissociation temperatures of 278.15 K and 280.65 K (Cases 9 and 10, respectively) when thermal stimulation was applied, as mentioned in Section 3.2. Hydrate decomposed completely at the same dissociation temperatures of 278.15 K and 280.65 K when using the combined method owing to the pressure driving force. As shown in Fig. 11, a peak in HDR was observed in the combined process during 0 to 12.8 min at the initial stage of hydrate decomposition. During the combined process, the back-pressure was lower, the dissociation temperature was higher, and the peak in HDR was sharper, thus indicating that the hydrate dissociated more quickly. After the initial stage, the HDR decreased significantly to almost zero in Cases 15 to 17 owing to the almost complete dissociation of the hydrate. The fluctuation in HDR of Case 14 after the initial stage was observed because the dissociation back-pressure (2.6 MPa) was the highest and the dissociation temperature (278.15 K) was the lowest during the combined process, which caused partial dissociation of the hydrate. These results demonstrate that the combination of depressurization and thermal stimulation at a suitable dissociation temperature and back-pressure is one effective way to solve the problems of low gas production and poor energy efficiency that are encountered when using either the depressurization or thermal stimulation method on its own.


image file: c6ra05526e-f11.tif
Fig. 11 Rate and average rate of hydrate dissociation versus time with combined method.

4. Conclusions

Magnetic resonance imaging was used to observe hydrate dissociation during the application of the depressurization and thermal stimulation methods individually as well as during a combined method that incorporated both depressurization and thermal stimulation techniques. Overall, 17 experimental cases were studied to compare the characteristics of hydrate dissociation when using the different methods. The effects of back-pressure and dissociation temperature on the MH dissociation were investigated in detail, and AHDRs and HDRs were compared. Based on our experimental results, the following conclusions can be drawn:

(1) For the depressurization and combined methods at different back-pressures (ranging from 2.2 to 2.6 MPa), MH dissociation proceeded via radial dissociation rather than axial dissociation; for the thermal stimulation method, MH dissociated uniformly.

(2) When using the depressurization method, fluctuations in HDR were observed during hydrate dissociation due to insufficient heat transfer from the reservoir and ambient environment. When using the thermal stimulation and combined method, peaks in HDR were observed during hydrate decomposition because of sufficient and constant ambient heat transfer.

(3) For the depressurization method, AHDRs with a back-pressure of 2.2 MPa were higher than those with a back-pressure of 2.6 MPa, which demonstrates that AHDR increased with decreases in the back-pressure. However, AHDR in Case 1 (2.6 MPa) was higher than that in Case 2 (2.2 MPa) because of hydrate reformation and ice generation during hydrate dissociation, which resulted in greater heat transfer and a slower dissociation rate.

(4) For the thermal stimulation method, AHDR increased from 0.13%/min to 1.27%/min with an increase in dissociation temperature from 278.15 K to 288.15 K. These results demonstrate that increases in the dissociation temperature gradient between the porous medium and the environment will lead to a larger driving force of heat transfer, which is beneficial for hydrate dissociation.

(5) For a given dissociation back-pressure (2.6 MPa or 2.2 MPa), the AHDRs for the combined method were higher than those for the depressurization method. For a given dissociation temperature (278.15 K or 280.65 K), the AHDRs for the combined method were higher than those for the thermal stimulation method, and MH dissociated more completely. These results demonstrate that the combination of depressurization and thermal stimulation is one effective way to improve the problems of low gas production and poor energy efficiency.

The findings of this study showed the characteristics of hydrate dissociation when using depressurization, thermal stimulation, and combined methods, and the experimental results demonstrated that the combination of depressurization and thermal stimulation could effectively solve the problems of low gas production and poor energy efficiency. This research that employed MRI for in situ observations of hydrate dissociation supports further comparisons of different methods for hydrate exploitation to improve the rates of gas production and energy efficiency.

References

  1. E. D. Sloan, Nature, 2003, 426, 353–359 CrossRef CAS PubMed.
  2. A. V. Milkov, Earth-Sci. Rev., 2004, 66, 183–197 CrossRef CAS.
  3. R. Boswell and T. S. Collett, Energy Environ. Sci., 2011, 4, 1206–1215 CAS.
  4. K. Yamamoto, Mar. Pet. Geol., 2015, 66, 296–309 CrossRef.
  5. Y. F. Makogon, S. A. Holditch and T. Y. Makogon, J. Pet. Sci. Eng., 2007, 56, 14–31 CrossRef CAS.
  6. M. D. Max, Natural gas hydrate in oceanic and permafrost environments, Springer Science & Business Media, 2003 Search PubMed.
  7. Y. F. Makogon, J. Nat. Gas Sci. Eng., 2010, 2, 49–59 CrossRef CAS.
  8. C. Ji, G. Ahmadi and D. H. Smith, Chem. Eng. Sci., 2001, 56, 5801–5814 CrossRef CAS.
  9. J. F. Zhao, T. Yu, Y. C. Song, D. Liu, W. G. Liu, Y. Liu, M. J. Yang, X. K. Ruan and Y. H. Li, Energy, 2013, 52, 308–319 CrossRef CAS.
  10. X. K. Ruan, M. J. Yang, Y. C. Song, H. F. Liang and Y. H. Li, J. Nat. Gas Chem., 2012, 21, 381–392 CrossRef CAS.
  11. X. Yang, C. Y. Sun, K. H. Su, Q. Yuan, Q. P. Li and G. J. Chen, Energy Convers. Manage., 2012, 56, 1–7 CrossRef CAS.
  12. M. H. Yousif, P. M. Li, M. S. Selim and E. D. Sloan, J. Inclusion Phenom., 1990, 8, 71–88 CrossRef CAS.
  13. H. O. Kono, S. Narasimhan, F. Song and D. H. Smith, Powder Technol., 2002, 122, 239–246 CrossRef CAS.
  14. J. Lee, S. Park and W. Sung, Energy Convers. Manage., 2010, 51, 2510–2515 CrossRef CAS.
  15. Y. Konno, Y. Masuda, Y. Hariguchi, M. Kurihara and H. Ouchi, Energy Fuels, 2010, 24, 1736–1744 CrossRef CAS.
  16. G. J. Moridis, Toward production from gas hydrates: current status, assessment of resources, and simulation-based evaluation of technology and potential, Lawrence Berkeley National Laboratory, 2008 Search PubMed.
  17. A. Kumar, B. Maini, P. Bishnoi, M. Clarke, O. Zatsepina and S. Srinivasan, J. Pet. Sci. Eng., 2010, 70, 114–122 CrossRef.
  18. A. Kumar, B. Maini, P. R. Bishnoi and M. Clarke, Energy Fuels, 2013, 27, 5757–5769 CrossRef CAS.
  19. Y. Konno, Y. Jin, K. Shinjou and J. Nagao, RSC Adv., 2014, 4, 51666–51675 RSC.
  20. S. Falser, S. Uchida, A. C. Palmer, K. Soga and T. S. Tan, Energy Fuels, 2012, 26, 6259–6267 CrossRef CAS.
  21. H. Oyama, Y. Konno, Y. Masuda and H. Narita, Energy Fuels, 2009, 23, 4995–5002 CrossRef CAS.
  22. H. Oyama, Y. Konno, K. Suzuki and J. Nagao, Chem. Eng. Sci., 2012, 68, 595–605 CrossRef CAS.
  23. J. F. Zhao, Z. H. Zhu, Y. C. Song, W. G. Liu, Y. Zhang and D. Y. Wang, Appl. Energy, 2015, 142, 125–134 CrossRef CAS.
  24. I. N. Tsimpanogiannis and P. C. Lichtner, J. Pet. Sci. Eng., 2007, 56, 165–175 CrossRef CAS.
  25. G. J. Moridis, T. S. Collett, S. R. Dallimore, T. Satoh, S. Hancock and B. Weatherhill, Numerical simulation studies of gas production scenarios from hydrate accumulations at the Mallik Site, Lawrence Berkeley National Laboratory, McKenzie Delta, Canada, 2002 Search PubMed.
  26. M. Pooladi-Darvish, J. Pet. Technol., 2004, 56, 65–71 CrossRef CAS.
  27. N. Tonnet and J. M. Herri, Chem. Eng. Sci., 2009, 64, 4089–4100 CrossRef CAS.
  28. L. G. Tang, R. Xiao, C. Huang, Z. P. Feng and S. S. Fan, Energy Fuels, 2005, 19, 2402–2407 CrossRef CAS.
  29. X. Yang, C. Y. Sun, Q. Yuan, P. C. Ma and G. J. Chen, Energy Fuels, 2010, 24, 5912–5920 CrossRef CAS.
  30. T. Kanno, M. Takekoshi, X. Wang, S. Chee, M. Fukuhara, O. Osawa, K. Yamamoto, T. Fujii, T. Takayama and K. Suzuki, In-situ Temperature Measurement of Gas Hydrate Dissociation during the World-First Offshore Production Test. Offshore Technology Conference, 2014 Search PubMed.
  31. M. Kurihara, A. Sato, H. Ouchi, H. Narita, Y. Masuda, T. Saeki and T. Fujii, SPE Reservoir Eval. Eng., 2009, 12, 477–499 CrossRef CAS.
  32. G. C. Fitzgerald, Multi-scale Analysis of Methane Gas Hydrate Formation and Dissociation via Point Source Thermal Stimulation and Carbon Dioxide Exchange, Columbia University, 2014 Search PubMed.
  33. G. C. Fitzgerald, M. J. Castaldi and J. M. Schicks, Ind. Eng. Chem. Res., 2014, 53, 6840–6854 CrossRef CAS.
  34. A. Demirbas, Energy Convers. Manage., 2010, 51, 1562–1571 CrossRef CAS.
  35. Y. H. Bai and Q. P. Li, Sci. China: Technol. Sci., 2010, 53, 2469–2476 CrossRef CAS.
  36. Y. C. Song, C. X. Cheng, J. F. Zhao, Z. H. Zhu, W. G. Liu, M. J. Yang and K. H. Xue, Appl. Energy, 2015, 145, 265–277 CrossRef CAS.
  37. T. Komai, S. P. Kang, J. H. Yoon, Y. Yamamoto, T. Kawamura and M. Ohtake, J. Phys. Chem. B, 2004, 108, 8062–8068 CrossRef CAS.
  38. T. J. Kneafsey, L. Tomutsa, G. J. Moridis, Y. Seol, B. M. Freifeld, C. E. Taylor and A. Gupta, J. Pet. Sci. Eng., 2007, 56, 108–126 CrossRef CAS.
  39. B. A. Baldwin, A. Moradi-Araghi and J. C. Stevens, Magn. Reson. Imaging, 2003, 21, 1061–1069 CrossRef CAS PubMed.
  40. C. X. Cheng, J. F. Zhao, Y. C. Song, Z. H. Zhu, W. G. Liu, Y. Zhang, M. J. Yang and X. C. Yu, Sci. China: Earth Sci., 2013, 56, 611–617 CrossRef CAS.
  41. G. Ersland, J. Husebo, A. Graue, B. A. Baldwin, J. Howard and J. Stevens, Chem. Eng. J., 2010, 158, 25–31 CrossRef CAS.
  42. S. Hirai, Y. Tabe, K. Kuwano, K. Ogawa and K. Okazaki, Ann. N. Y. Acad. Sci., 2000, 912, 246–253 CrossRef CAS.
  43. E. D. Sloan and K. Carolyn, Clathrate hydrates of natural gases, CRC Press, Boca Raton, 3rd edn, 2008 Search PubMed.
  44. S. L. Wang, M. J. Yang, P. F. Wang, Y. C. Zhao and Y. C. Song, Energy Fuels, 2015, 29, 3251–3256 CrossRef CAS.
  45. J. F. Zhao, L. Yao, Y. C. Song, K. H. Xue, C. X. Cheng, Y. Liu and Y. Zhang, Magn. Reson. Imaging, 2011, 29, 281–288 CrossRef CAS PubMed.
  46. Y. C. Song, S. L. Wang, M. J. Yang, W. G. Liu, J. F. Zhao and S. R. Wang, Fuel, 2015, 140, 126–135 CrossRef CAS.
  47. V. A. Kamath, Study of heat transfer characteristics during dissociation of gas hydrates in porous media, Pittsburgh Univ., PA, USA, 1984 Search PubMed.
  48. S. X. Li, X. H. Xu, R. Y. Zheng, Y. M. Chen and J. Hou, Fuel, 2015, 160, 117–122 CrossRef CAS.
  49. Y. C. Song, J. Q. Wang, Y. Liu and J. F. Zhao, Int. J. Heat Mass Transfer, 2016, 92, 766–773 CrossRef CAS.

This journal is © The Royal Society of Chemistry 2016
Click here to see how this site uses Cookies. View our privacy policy here.