Ultrathin N-rich boron nitride nanosheets supported iron catalyst for Fischer–Tropsch synthesis

Jianghong Wuab, Li Qinab, Conghui Wangab, Baoliang Lva, Liancheng Wang*a, Jiangang Chen*a and Yao Xua
aState Key Laboratory of Coal Conversion, Institute of Coal Chemistry, Chinese Academy of Sciences, Taiyuan 030001, China. E-mail: wanglc@sxicc.ac.cn; Chenjg@sxicc.ac.cn
bUniversity of Chinese Academy of Sciences, Beijing 100049, China

Received 2nd March 2016 , Accepted 9th April 2016

First published on 11th April 2016


Abstract

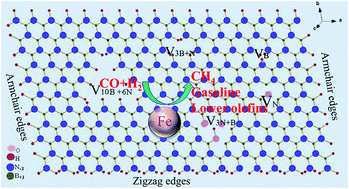
The boron nitride nanosheets (BNNSs) have attracted great interest in the field of energy storage and heterogeneous catalysis. In this paper, BNNSs supported iron (Fe/BNNSs) catalysts were prepared by one-pot solid state reaction and used in Fischer–Tropsch synthesis (FTS) for the first time. The microscopic structure, morphology and metal–support interaction of the Fe/BNNSs catalysts were investigated by TEM, FT-IR, 1H MAS NMR and H2-TPR. The average thickness of the N-rich BNNSs support was 4–8 nm, and the mean size of the iron nanoparticles was 25–40 nm. The CO conversion, CH4 and C5+ selectivity of typical Fe/BNNSs catalyst with 33 wt% Fe-loading were 47%, 13.7% and 48% at 270 °C, respectively. No obvious deactivation was observed even after 270 h running. The conversion, selectivity and the iron time yield (FTY) of Fe/BNNSs catalysts were highly related to the loading, dispersion of iron nanoparticles. The lower loading and better dispersion of the iron nanoparticles in Fe/BNNSs catalyst resulted in the better FTY and C5+ selectivity. The N-rich defects of BNNSs and porous structure of BNNSs anchored active phases to prevent them from growing larger. Therefore, the BNNSs support plays an important role in retarding the catalyst from deactivation.

Introduction

The growing worldwide energy demand and the depletion of petroleum reserves make it urgent to increase the energy supply. As one of the most important heterogeneous catalysis process, the Fischer–Tropsch synthesis (FTS) can produce high quality hydrocarbon fuels or fine chemicals via syngas (CO + H2) that derived from renewable biomass. FTS is considered to be a suitable substituting process for liquid fossil fuel production and decreases the greenhouse gas emissions. Therefore, it has gained momentum in recent years.1–3

As an exothermic reaction, the reaction heat of FTS is strong (165 kJ mol−1), which usually leads to deep temperature gradient within catalyst bed. The thermal runaway is therefore detrimental to the overall selectivity of the FTS, as it favors the intermediate hydrogenation and cracking.4 To transfer the reaction heat promptly, researchers have designed and used new reactors, and tried to find other new supports beyond oxides with high thermal conductivity at same time.5,6

Boron nitride (BN) is an important layered material that has wide applications owing to its high thermal stability and excellent thermal conductivity.7–9 BN has been shown to be an excellent catalyst support for exothermic combustion and deep oxidation of VOCs.10,11 It is an effective support to dissipate substantial heat in highly exothermic reaction.8,9 The hydrophobic surface of BN can also drive off the condensed moisture, retarding the deactivation of catalyst. Besides, the weak interaction between metal and BN avoided the formation of silicates or aluminates in case of oxide supports.12,13

Being a featured support, BN showed interesting effect in heterogeneous catalysis. However, there was no report that dealt with the BN support in FTS to the best of our knowledge, Ba–Ru/BN catalyst showed unprecedented activity and stability in another key hydrogenation reaction, the ammonia synthesis. No detectable deactivation was found even after 3500 h running.14 The BN coating also prevented the rhodium black from coking and promoted the stability of the catalyst in syngas production.15 Recent years, the ultrathin BN nanosheets (BNNSs) was found an excellent H2 storage material,16 and the Fe/BNNSs could activate CO molecule.17 In this regard, the high surface area of Fe/BNNSs should benefit the interaction between CO, H2 and the catalyst. And the rich defects (vacancies and edges) and porous structure of BNNSs can also anchor or confine the active phase, preventing the active phase from immigration and agglomeration and retarding the catalyst from deactivation.

However, the commercial BNNSs (∼4 nm) are still unavailable, and the most used BN supports are bulk commercial powders.10,11,14,18 A few studies dealt with the BNNSs based catalyst in recent years.8,9,19,20 Zeng et al. reported the Ag/white graphene foam that showed high efficiency and stability in the catalytic oxidation of methanol.9 The Ag/BNNSs catalyst studied by Xu et al. showed excellent catalytic activity in the reduction of 4-nitrophenol.20 However, little progress has been made for the Fe/BNNSs catalyst in heterogeneous catalysis.21 Based on the fact that the larger scale synthesis of BNNSs is still under way, we previously developed a “solid state reaction” to synthesize BNNSs in gram-scale, but the surface of those BNNSs was contaminated by Cl element poisonous for FTS process.22,23

In this study, we adopted a gram-scale synthetic route for the preparation of the Cl-free Fe/BNNSs catalyst. The solid state reaction between NaBH4, Fe2O3 and NaN3 directly produced N-rich ultrathin BNNSs supported nano-sized iron particles. The as-obtained novel catalysts not only showed appreciable activity and selectivity but also displayed excellent stability in the FTS.

Experimental

Materials

All the reagents were purchased from Sinopharm Chemical Reagent Co., Ltd. (Shanghai, China). The sodium azide was of CP grade and the other reagents were of AR grade. These reagents were used without further purification. The nano-sized ferric oxide was prepared according to a previous report.24 In brief, 30 g Fe(NO3)3·9H2O was loaded into a ceramic evaporating dish and then thermally treated at 300 °C for 2 h in a muffle furnace (Fig. S1).

Catalyst preparation

The Fe/BNNSs catalyst was synthesized by an “solid state reaction”.22,25 Typically, 26 mmol NaBH4 and certain amount of Fe2O3 were ground using mortar and pestle, then 40 mmol NaN3 was added into the mixture. As those powders were transferred into a stainless steel autoclave of 20 mL capacity, the autoclave was sealed and heated in an electric stove ramped at 10 °C min−1 to 480 °C for 12 h. Then, the as-obtained crude powder was washed with ethanol and deionized water several times. Finally, it was filtrated and dried at 60 °C in vacuum overnight. With different Fe-loading, those samples were marked as FeBN1, FeBN2 and FeBN3, respectively. The details of them were listed in Table 1. The metal-free BNNSs were obtained by treating FeBN1, FeBN2 and FeBN3 using diluted aqua regia, as denoted as BN1, BN2 and BN3. As a reference, the preparation of FeBNCl catalyst was same to that of FeBN2, except that 6.0 mmol of FeCl3 was used instead of 3.0 mmol Fe2O3.22
Table 1 Synthesis parameters for Fe/BNNSs catalysts
Sample no. Fe2O3 (mmol) NaBH4 (mmol) NaN3 (mmol) Fe (wt%) Mean size (nm)
Iron Thickness of BNNSs
FeBN1 1.8 26 40 24 25 4
FeBN2 3.0 26 40 33 33 5
FeBN3 8.6 26 40 65 40 8
FeBNCl 6.0 FeCl3 26 40 46 4–40 4–6


Catalyst characterization

X-ray diffraction (XRD) measurements were performed on a D8 Advance Bruker AXS diffractometer, using Cu-Kα radiation (λ = 1.5406 Å), employing a scan step of 0.02°. X-ray photoelectron spectroscopy (XPS) was acquired on an Axis Ultra DLD imaging photoelectron spectrometer (Kratos Analytical Ltd). The source of X-ray was Al Kα, 1486.6 eV with a quartz monochromator. The morphology and structure of products were investigated by transmission electron microscopy (TEM, Hitachi, and H-7650) and high-resolution TEM (HRTEM, JEOL 2100). The Fourier-transformed infrared (FT-IR) spectra were collected using a Nicolet IS50 spectrometer with a resolution of 4 cm−1. The surface area, pore volume, and pore size distribution were estimated based on the nitrogen adsorption isotherm (77 K) using a Tristar II (3020) instrument. The sample was degassed under vacuum at 180 °C for 6 h before measurement. H2-TPR experiments were performed in a quartz reactor using a mixture gas of 5% H2/N2 mixture at a flow rate of 50 mL min−1. The catalyst was heated to 700 °C ramped at 10 °C min−1. The hydrogen consumption rate was monitored by a thermal conductivity detector (TCD). The Fe content of the sample was determined by elemental analysis using inductively coupled plasma atomic emission spectroscopy (ICP-AES) on an Atom scan 16 spectrometer (TJA, USA). 1H MAS NMR spectra were conducted on a NMR spectrometer (AVANCE III 600 MHz, Bruker).

FTS performance

The FTS reaction was carried out in a fixed bed reactor with an internal diameter of 10 mm and a height of 500 mm. Before the FTS, the catalyst was firstly pressed under 10 MPa, and then ground and sieved to 40–80 mesh. Finally, the catalyst of 1 mL (0.6–0.7 g) was diluted with 2 mL 40–80 mesh quartz sand and loaded into reactor. The exit gases were passed through a hot trap (130 °C) and then a cold trap (5 °C). A wet gas flow meter was used to monitor the flow rate of tail gas. The gas hourly space velocity (GHSV) was the ratio of the volumes of synthesis gas to the total volumes of catalyst. Detailed description of the reactor and product analysis systems was provided elsewhere.26 Prior to the FTS, the sample was in situ activated at 260 °C for 6 h under a 0.2–0.3 MPa mixture gas of H2/CO (molar ratio H2/CO = 2[thin space (1/6-em)]:[thin space (1/6-em)]1) at a flow rate of 50 mL min−1. As the catalysts were cooled to ambient temperature, the synthesis gas was fed into the catalyst bed and the temperature was ramping at 1.0 °C min−1 to 230 °C. After that, the operating temperature was adopted with an interval of 10 °C or 20 °C. The catalytic activity was expressed as the moles of CO converted to hydrocarbons. The hydrocarbon products were collected daily (24 h) and analyzed by gas chromatography (Shanghai Haixin Chromatographic Instrument Co., Ltd, GC 920). Analysis of H2, CO, CO2, CH4 and N2 was performed using a carbon molecular sieve column and a thermal conductivity detector. Hydrocarbons were separated in capillary Porapak-Q column and analyzed using a flame ionization detector (FID). Selectivity was reported as the percentage of CO converted into a certain product expressed in C atoms. Cx (x = 1, 2–4) refers to hydrocarbons containing x (x = 1, 2–4) carbon atom and C5+ to hydrocarbons containing 5 or more carbon atoms. The carbon balance of the FTS reaction is better than 95%.

Results and discussion

Chemical structure of BNNSs support

Fig. 1a shows typical XRD patterns of the as-prepared Fe/BNNSs catalysts. The diffraction peak at 26.42° (3.37 Å) could be indexed as (002) plane of h-BN (JCPDS card no. 34-0421). The peaks at 44.67° (2.02 Å), 65.02° (1.43 Å) and 82.20° (1.17 Å) could be indexed as the (111), (200) and (211) planes of Fe (JCPDS card no. 06-0696), respectively. No impurities were detected in those patterns. In BN2 case, the diffraction peaks of cubic iron disappeared and an extra peak at 41.8° (2.15 Å) appeared which could be indexed as (100) plane of BN. The broadened (002) peak indicated the thin thickness of BNNSs. It was noted that high-indexed diffraction plane was absent, indicating the poor structural order in the three-dimensional.28 The structural information of BNNSs was also confirmed by the FT-IR spectrum (Fig. 1b). The out-of-plane B–N–B bending vibration located at 805 cm−1, while the strong in plane B–N stretching vibrations located at 1380 cm−1. Besides, an extra peak centered at 3450 cm−1 could be attributed to the stretching modes of N–H that bonds to B atom in the frame, and the weak shoulder peaks at 3240 cm−1 could be ascribed to the O–H group bonding to B atom or absorbed moisture.29 To further confirm the structural defects, 1H MAS NMR spectrum of BN2 was also performed in Fig. 1c. The wide shoulder around 3.4 ppm could be ascribed to N–H groups, while the broad peaks at 6.8 ppm could be assigned to the O–H groups. According to 1H MAS NMR and FT-IR results, the N–H edges were the favorite edges in the as-synthesized BNNSs. An illustration of the as-obtained BNNSs support was shown in Scheme 1. Those defects and groups (vacancies or edges) can interact with H2,17,29–31 which may play a positive role in the hydrogen reaction.
image file: c6ra05517f-f1.tif
Fig. 1 The XRD patterns of the FeBN1, FeBN2, FeBN3 and BN2 (a), * represents BN diffraction peaks. Typical FT-IR spectrum of as-prepared BN2 (b), and 1H MAS NMR of the as-prepared BN2 (c).

image file: c6ra05517f-s1.tif
Scheme 1 A scheme illustration of as-obtained BNNSs.

Chemical composition of Fe/BNNSs catalyst

As seen in Fig. 1a, as more Fe2O3 was used, the diffraction planes of iron became more obvious, indicating the increase of iron content in the samples. Actually, the Fe-loading increased from 24 wt%, 33 wt% to 65 wt% based on the ICP analysis.

The diffraction peaks of the iron got narrowing simultaneously, indicating particle size growth. To further study the surface structural information of the catalyst, the XPS spectra were performed. Two typical survey scan XPS spectra were shown in Fig. 2a, in which significant Fe2p, C1s, B1s, N1s and O1s binding energy peaks could be found on both fresh and used FeBN2. To analyze the detailed surface composition, the high-resolution spectra of Fe2p, C1s, N1s and B1s were collected and simulated by fitting their peaks using the multi-peak Gaussian method. Fig. 2b shows the Fe2p spectra of both the fresh and used FeBN2. The two obvious peaks at 711.2 (Fe2p3/2) and 724.4 eV (Fe2p1/2) could be ascribed to the surface iron oxides due to the partial oxidation of Fe0. The high-resolution and deconvoluted B1s XPS spectrum in Fig. 2c gives two subpeaks at 189.8 and 191.2 eV. The former peak was attributed to sp2-hybridized BN3 trigonal units while the latter could be assigned to a sp3-hybridized N3B(OH) units.32 The high-resolution and deconvoluted N1s XPS spectrum was shown in Fig. 2d. The main peak at 397.6 and 398.5 eV could be attributed to the B3N trigonal units and N–H bonding, while the peak at 406 eV was attributed to N–O bonding.19


image file: c6ra05517f-f2.tif
Fig. 2 XPS spectra of survey scan (a), Fe2p (b), B1s (c), N1s (d) and C1s (e). Fresh FeBN2 and used FeBN2 in FTS were both collected.

The quantification of peaks gave the N/B atomic ratio of 1.14[thin space (1/6-em)]:[thin space (1/6-em)]1, basically consistent with result of the FT-IR, implying the favorite H-coordinated N-terminated edges of as-prepared BNNSs. The C1s spectrum of the fresh and used FeBN2 catalyst was shown in Fig. 2e,33 with the reference graphite located at 284.8 eV.

Morphology of Fe/BNNSs catalyst

Fig. 3a–c displays the TEM images of the as-prepared FeBN1, FeBN2 and FeBN3. Obviously, black nanoparticles were loaded onto the ultrathin nanosheets. Though the overlapping of the nanoparticles was inevitable, the mean size and thickness of the catalyst were obtained by measuring over 100 separated nanoparticles/nanosheets based on the TEM observation. The size of the black nanoparticles increased obviously in Fig. 3a–c, and the mean size of iron in catalyst was 25, 32 and 40 nm, respectively. To further comprehend the structure of BNNSs, the BN2 was taken as a reference, in which the Fe particles were removed by diluted aqua regia overnight. Obviously, the BNNSs were curved and aligned (Fig. 3b and S2), which was similar to the 3D analog of porous graphene.9
image file: c6ra05517f-f3.tif
Fig. 3 TEM images of catalysts, FeBN1 (a), FeBN2 (b), FeBN3 (c), support BN2 (d), and HRTEM (e and f) of BN2.

The measured mean thickness of the BNNSs was around 5 nm with about 13 layers (Fig. 3b). The mean thickness of the BN1 and BN3 was about 4 nm (Fig. 3a) and 8 nm (Fig. 3c), respectively. The HRTEM images of the ultrathin BNNSs show the lattice spacing of 0.34 nm (inter-layer, Fig. 3e) and 0.21 nm (intra-layer, Fig. 3f), which can be ascribed to the (002) and (100) planes of h-BN, respectively. The SAED pattern (Fig. S3) also shows three main diffraction rings, which can also be indexed to (002), (100) and (110) planes of h-BN. Except for bending and scrolling, the trigonal-like vacancies of BNNSs can also be observed in Fig. 3f.34,35 The sharp edges, rich vacancies as well as functional groups made the BNNSs a possibly good catalytic material.36

Pore structure of Fe/BNNSs catalyst

To reveal the inner structure of the Fe/BNNSs catalyst, the nitrogen adsorption–desorption analysis was carried out, as shown in Fig. 4. The isotherms of the three Fe/BNNSs samples were attributed to type IV isotherm based on the Brunauer classification, and the hysteresis loop was of H3 type. The desorption branches of all those isotherms showed a step at a relative pressure around 0.45 due to the capillary evaporation in the mesopores. Those isotherms kept on rising at high relative pressure (>0.9), indicating the presence of macro-porous structure. The hysteresis loop area decreased with increasing the Fe-loading, indicating the decrease of mesoporous structure. Based on the BJH method, the calculated BET surface area of FeBN1, FeBN2 and FeBN3 was 191, 197 and 50 m2 g−1, and the total pore volumes of 0.27, 0.41 and 0.19 cm3 g−1. In addition, FeBN1 showed a single pore size distribution around 3.0 nm, while that of FeBN2 and FeBN3 showed a bimodal characteristic. The textural detail of the catalysts was showed in Table 2. The sharp surface area decrease of the FeBN3 might be caused by its higher iron content, larger iron size and thicker layer of the nanosheets.
image file: c6ra05517f-f4.tif
Fig. 4 The nitrogen adsorption–desorption isotherms of the as-prepared Fe/BNNSs catalysts.
Table 2 Textural properties of the Fe/BNNSs catalysts
Sample no. Surface area (m2 g−1) Pore volumes (cm3 g−1) Pore size (nm)
FeBN1 191 0.27 3.0
FeBN2 197 0.41 3.0 & 8.0
FeBN3 50 0.19 3.0 & 40.0


Formation mechanism of Fe/BNNSs catalyst

The reaction involved in this system is somewhat complex. The reactant Fe2O3, commercial NaN3 and NaBH4 were mixed by pestle and mortar in tens/hundreds of micrometer scale, but the final products were nano-sized Fe/BNNSs catalysts. Here, a gas–solid state reaction involving particle cracking must be taken into consideration.37 As the reaction temperature increased, the NaN3 would be decomposed into gaseous N3*, N2 and Na around 350 °C, and Fe2O3 was reduced into Fe by NaBH4 and/or Na in the confined chamber.25 As the reaction proceeded, stress developed due to the differences in molar volumes and thermal expansion coefficients at the solid reactant/product interface. Conditions existed when the stress excessed the strength of the material, leading to the fraction of the solid.38 The newly formed gaseous active N3*, N2 then reacted with solid B species at surface and BNNSs is obtained. As the resultant Na contained by-products (Na or Na2O) was leached by alcohol and water, the porous structure then was created. Similar to other synthetic technique of BN, the iron related species played a catalytic role for the formation of BNNSs. BNNSs will be a favorable “epitaxial” surface for the Fe nanoparticles because of the small lattice mismatch between the Fe (111) and h-BN (100) planes (ca. 2%). The reaction involved in this study can be tentatively written as follows:
 
3NaBH4 + Fe2O3 + 3NaN3 → 2Fe + 3BN + 3Na2O + 6H2 + 3N2 (1)

According to the calculated Gibbs free energy, the reaction is thermodynamically spontaneous (ΔGør = −1.5 × 10³ kJ mol−1) and exothermic (ΔHør = −0.7 × 10³ kJ mol−1).39 The estimated N2 and H2 partial pressure were ∼10 and 20 MPa according to ideal gas law, respectively. The N and H rich environment and giant reaction heat could be the reason for the fabrication of H-saturated N-rich BNNSs.

Reduction of Fe/BNNSs catalyst

In this study, the oxidation of high reactive nanosized Fe0 was inevitable as it was exposed to the ambient atmosphere. Though the weak hydrogen consumption signal appeared, the interaction between BNNSs and Fe species was evaluated by H2-TPR method. Fig. 5 shows the H2-TPR profiles of the three Fe/BNNSs catalysts and BNNSs support. In consistent with the fact that the BNNSs were highly stable at elevated temperature, no obvious H2 consumption signal was detected for the BNNSs support (BN2) even up to 700 °C. A stepwise reduction manner of FeBN1 can be observed. The first sharp peak around 414 °C could be assigned to the reduction of Fe2O3 to Fe3O4, the weak shoulder centered at 512 °C was related to the reduction of Fe3O4 to FeO, and the last weak peak centered at 607 °C could be assigned to the subsequent reduction of FeO to Fe (eqn (2)).40
 
Fe2O3 → Fe3O4 → FeO → Fe (2)

image file: c6ra05517f-f5.tif
Fig. 5 H2-TPR profiles of the as-obtained catalysts and support.

As far as FeBN2 and FeBN3, broad reduction peaks could be observed. The FeBN2 and FeBN3 exhibited lower reduction peaks at 396 and 383 °C, respectively. The decrease of reduction temperature could be attributed to the increase of the particle size. The smaller particles resulted in the stronger interaction between support and active phase, more difficult to be reduced.12 On the other hand, the first reduction peaks in this study was close to that of pure Fe2O3 (∼400 °C),41 implying the active species easy to be reduced and a weak interaction between the active species and BNNSs.

The FTS performance of the catalysts

Since alternative preparation will introduce Cl in final Fe/BNNSs catalyst, the effect of residual Cl was evaluated firstly.27 The FTS performance of the FeBNCl catalyst was shown in Fig. 6a. The value of FeBN2 was about triple of that of FeBNCl, which was in agreement with the fact that the Cl contaminated catalyst showed a suppress the hydrogenation activity.42
image file: c6ra05517f-f6.tif
Fig. 6 The FTS performance of the Fe/BNNSs catalysts at different temperatures: CO conversion (a), CH4 and C5+ selectivity (b), FTY (c). Every FTS point shown was stabilized over 24 h (reaction conditions: H2/CO = 2[thin space (1/6-em)]:[thin space (1/6-em)]1, GHSV = 1500 h−1, P = 2 MPa).

The Fe/BNNS showed different performance in FTS as a function of Fe loadings, as shown in Fig. 6. The Fe/BNNSs catalysts with different iron-loading possessed different surface area, active phase particle sizes and dispersion, and these factors affected the final performance of catalyst together. In order to accelerate induction period, the fresh catalyst was activated with syngas, and overall carbon balance of the FTS reaction was better than 95% for the reliability of data. The CO conversion vs. temperature profiles of Fe/BNNSs catalysts were shown in Fig. 6a. A significant conversion increase could be observed for all the catalysts with the reaction temperature. The conversion of the Cl-free Fe/BNNSs catalysts was close (∼17%) at 230 °C, but the activity of the three catalysts was varied at elevated temperature (250–320 °C), generally, in a sequence of FeBN3 > FeBN2 > FeBN1.

Though higher conversion can be expected at higher temperature, it also accelerates the product desorption and chain termination, bringing down the C5+ selectivity finally. As showed in Fig. 6b, the overall C5+ selectivity of the Fe/BNNSs catalysts showed a descending trend as temperature increased, while that of CH4 presented a reverse trend. Interestingly, a terrace around 45% can be observed in the C5+ profile, which shifted to high temperature in case of low iron-loading. The C5+ selectivity of the three Fe/BNNSs catalysts was in the sequence of FeBN1 > FeBN2 > FeBN3 at given temperature. The variation may be originated from the mass transfer limitation that related to the catalyst texture.43 Typically, the C5+ selectivity at 270 °C were 51.3%, 43.9% and 25.5% for the three Fe/BNNSs catalysts, compared with that of graphene oxide supported iron oxide catalyst.44

The catalytic activity per gram of iron (iron time yield, FTY) of the Fe/BNNSs catalysts was also compared, as shown in Fig. 6c. The FTY was ascended as the temperature increased. Tiny differences existed between FeBN1 and FeBN2, but the FTY value of FeBN3 was much lower than the other two catalysts. The typical FTY at 270 °C was 1.44, 1.31 and 0.71 × 10⁻⁵ mol g−1 s−1, slightly better than that of a reported iron oxide/carbon nanotube catalyst.45 All above, the FeBN1 and FeBN2 catalysts showed higher C5+ selectivity, lower CH4 selectivity and better FTY than FeBN3 catalyst.

The apparent activity increased, but the specific activity was decreased as the Fe-loading increased, suggesting that the Fe utilization efficiency decreased. As we known, reduction degree and Fe dispersion are primary parameters that affect the number of active Fe active sites and FTS activity. In this case, the Fe mainly existed as α-Fe, the reduction behavior of Fe changed little in H2-TPR profiles (Fig. 5), proposing the comparable reduction degree of those samples. However, the mean particle size of Fe became larger as Fe-loading increased (Table 1 and Fig. 3), indicating a decreased Fe dispersion. The apparent activity was dependent on total loading, while the specific activity is correlated with Fe dispersion. Therefore, the degree of Fe dispersion led to difference of FTS activity. However, in the study, poor Fe dispersion mainly resulted from higher Fe-loading.

In order to study the stability of the Fe/BNNSs catalyst, the CO conversion, C5+, CH4 selectivity as a time-on-stream function were measured (Fig. 7), which was carried out at 270 °C using FeBN2 catalyst. The catalyst was inactive within 6 h, and the stable CO conversion was 47%, while the selectivity of C5+ and CH4 are 48%, 13.7%, respectively. The CO conversion only dropped from 47% to 43% even after 270 h running.


image file: c6ra05517f-f7.tif
Fig. 7 The FTS stability of the FeBN2 catalyst, CO conversion, CH4 and C5+ selectivity as a function of time (reaction conditions: H2/CO = 2[thin space (1/6-em)]:[thin space (1/6-em)]1, GHSV = 1500 h−1, P = 2 MPa, T = 270 °C).

Generally, the activity of Fe-based FTS catalyst is highly correlated with the active phases. Here, the phase composition of the used FeBN2 catalysts at two stages were investigated by XRD patterns, as shown in Fig. 8. One was the activated FeBN2 (260 °C, 6 h with 0.2–0.3 MPa syngas) and the other one was used FeBN2 catalyst after the stability test. The activated FeBN2 sample occurred with Fe3O4, BN and Fe (Fig. 8a), but the iron carbide was absent. It might be the reason for the low activity of the Fe/BNNSs catalysts below 260 °C. The formation of carbide might go through longer reaction time, in consistent with the fact that the catalyst went through an induction period in case of FeBN2 stability test. As far as the FeBN2 after the stability test, new peaks ascribed to Fe5C2 were found (Fig. 8b). As shown in Fig. 2a, the intensity of C1s peak increased while that of Fe2p decreased after the FTS reaction, resulted from the surface coverage of the hydrocarbon related species. The weak subpeaks of Fe2p (Fig. 2b) at 709.1 eV could be ascribed to the carbide, and the subpeaks at 711.2, 712.9, 715.1, 725.2 and 728.8 eV can be related to the iron oxides. Still, the subpeaks of C1s (Fig. 2e) at 285.1, 286.1 and 287.2 eV reveal the presence of the –C–C–, –C–O– and –C[double bond, length as m-dash]O bonding respectively.33,46 Hence, the formation of iron carbide and oxide is the result of the interaction of metallic iron with carbon and oxygen species from the dissociated carbon monoxide under the FTS conditions.


image file: c6ra05517f-f8.tif
Fig. 8 XRD patterns of FeBN2 catalyst at different stages: activated at 260 °C for 6 h with syngas (a), running over 270 h (b) (reaction conditions: H2/CO = 2[thin space (1/6-em)]:[thin space (1/6-em)]1, GHSV = 1500 h−1, P = 2 MPa, T = 270 °C).

The excellent stability of the Fe/BNNSs catalyst could be attributed to the merits of BNNSs in nature. The support with high thermal-conductivity can retard the catalyst from sintering.11 The inert but hydrophobic surface (as shown in Fig. S4) of the Fe/BNNSs catalyst10 could separate produced water and prompt the action balance toward the synthesis of hydrocarbons. The calculated N/B atomic ratio of FeBN2 after the FTS reaction was 1.08[thin space (1/6-em)]:[thin space (1/6-em)]1 (XPS analysis, Fig. 2), indicating vacancies and active edges in Fe/BNNSs catalyst would also play a positive role in anchoring the active phases.21 On the other hand, the organics and deposited carbon onto the catalyst not only influenced the inner structure but also was a key factor for the deactivation of the catalyst. In this study, it was facile to remove the organic and deposited carbon through calcination in ambient atmosphere taking the advantage of strong anti-oxidation stability of BNNSs. The FeBN2 catalyst after the stability test was calcinated at 600 °C for 3 h. As seen in Fig. S5, the reservation of the hierarchical porous structure of our BNNSs support revealed that it was possible to recycle the catalyst through calcinations, and the porous structure actually confined and isolated the iron species from particle growth.22

Conclusions

In summary, a series of new Fe/BNNSs catalysts were prepared by one-pot solid state reaction. The as-obtained BNNSs showed both N-rich character and the H-coordinated N-terminated edges. The active phase were anchored and encapsulated by the BNNSs, preventing them from growing larger. The Fe/BNNSs catalysts exhibited appreciable FTS activity, selectivity and stability, with tiny CO conversion drop even after 270 h running. We believe that our discovery of the novel nano-composites can lead to further development of new FTS support, thus allowing more opportunities in hydrogenation reaction.

Acknowledgements

We gratefully acknowledge the financial support from the National Natural Science Foundation of China (No. 21503253 and 21373254) and Natural Science Foundation of Shan-Xi province of China (No. 2015011010). The State Key Laboratory of Coal Conversion (SKLCC) in-house project (No. 2013BWZ004) is also appreciated.

References

  1. R. Rauch, A. Kiennemann and A. Sauciuc, in The Role of Catalysis for the Sustainable Production of Bio-fuels and Bio-chemicals, ed. K. S. T. A. L. Stöcker, Elsevier, Amsterdam, 2013, pp. 397–443 Search PubMed.
  2. O. O. James, B. Chowdhury, M. A. Mesubi and S. Maity, RSC Adv., 2012, 2, 7347–7366 RSC.
  3. J. Xu, Y. Yang and Y. W. Li, Fuel, 2015, 152, 122–130 CrossRef CAS.
  4. J. Li, J. Qi, C. Liu, L. Zhou, H. Song, C. Yu, J. Shen, X. Sun and L. Wang, J. Mater. Chem. A, 2014, 2, 4144–4149 CAS.
  5. X. W. Zhu, X. J. Lu, X. Y. Liu, D. Hildebrandt and D. Glasser, Chem. Eng. J., 2014, 247, 75–84 CrossRef CAS.
  6. I. G. Solomonik, K. O. Gryaznov, V. F. Skok and V. Z. Mordkovich, RSC Adv., 2015, 5, 78586–78597 RSC.
  7. C. Y. Zhi, Y. Bando, C. H. Tang, H. Kuwahara and D. Golberg, Adv. Mater., 2009, 21, 2889–2893 CrossRef CAS.
  8. C. Y. Zhi, Y. B. Xu, Y. Bando and D. Golberg, ACS Nano, 2011, 5, 6571–6577 CrossRef CAS PubMed.
  9. H. Zhao, J. Song, X. Song, Z. Yan and H. Zeng, J. Mater. Chem. A, 2015, 3, 6679–6684 CAS.
  10. J. C. S. Wu, Z. A. Lin, J. W. Pan and M. H. Rei, Appl. Catal., A, 2001, 219, 117–124 CrossRef CAS.
  11. C. Lin, J. Catal., 2002, 210, 39–45 CrossRef.
  12. A. F. H. Wielers, A. J. H. M. Kock, C. E. C. A. Hop, J. W. Geus and A. M. V. D. Kraan, J. Catal., 1989, 117, 1–18 CrossRef CAS.
  13. J. C. S. Wu, C.-Y. Chen and S. D. Lin, Catal. Lett., 2005, 102, 223–227 CrossRef CAS.
  14. C. Jacobsen, J. Catal., 2001, 200, 1–3 CrossRef CAS.
  15. A. C. Chien and J. A. van Bokhoven, Catal. Sci. Technol., 2015, 5, 3518–3524 CAS.
  16. W. W. Lei, H. Zhang, Y. Wu, B. Zhang, D. Liu, S. Qin, Z. W. Liu, L. Liu, Y. M. Ma and Y. Chen, Nano Energy, 2014, 6, 219–224 CrossRef CAS.
  17. J. Li, H. Lin, Y. J. Chen, Q. Q. Su and Q. M. Huang, Chem. Eng. J., 2011, 174, 687–692 CrossRef CAS.
  18. G. Postole, A. Gervasini, M. Caldararu, B. Bonnetot and A. Auroux, Appl. Catal., A, 2007, 325, 227–236 CrossRef CAS.
  19. D. Liu, W. Cui, J. Lin, Y. Xue, Y. Huang, J. Li, J. Zhang, Z. Liu and C. Tang, Catal. Commun., 2014, 57, 9–13 CrossRef CAS.
  20. H. Shen, C. T. Duan, J. Guo, N. Zhao and J. Xu, J. Mater. Chem. A, 2015, 3, 16663–16669 CAS.
  21. S. Lin, X. Ye, R. S. Johnson and H. Guo, J. Phys. Chem. C, 2013, 117, 17319–17326 CAS.
  22. L. C. Wang, S. Q. Ni, C. L. Guo and Y. T. Qian, J. Mater. Chem. A, 2013, 1, 6379–6387 CAS.
  23. L. C. Wang, C. H. Sun, L. Q. Xu and Y. T. Qian, Catal. Sci. Technol., 2011, 1, 1119–1123 CAS.
  24. G. Tong, J. Guan, Z. Xiao, X. Huang and Y. Guan, J. Nanopart. Res., 2010, 12, 3025–3037 CrossRef CAS.
  25. L. Wang, R. Hang, Y. Xu, C. Guo and Y. Qian, RSC Adv., 2014, 4, 14233–14240 RSC.
  26. J. Q. Sun, S. K. Zheng, K. Zhang, D. C. Song, Y. T. Liu, X. D. Sun and J. G. Chen, J. Mater. Chem. A, 2014, 2, 13116–13122 CAS.
  27. K. B. Tang, J. Q. Hu, Q. Y. Lu, Y. Xie, J. S. Zhu and Y. T. Qian, Adv. Mater., 1999, 11, 653–655 CrossRef CAS.
  28. J. Thomas, N. E. Weston and T. E. O'Connor, J. Am. Chem. Soc., 1962, 84, 4619–4622 CrossRef CAS.
  29. J. Kim, J. Han, M. Seo, S. Kang, D. Kim and J. Ihm, J. Mater. Chem. A, 2013, 1, 1014–1017 CAS.
  30. F. Liu, J. Yu, X. Ji and M. Qian, ACS Appl. Mater. Interfaces, 2015, 7, 1824–1832 CAS.
  31. Q. Weng, X. Wang, C. Zhi, Y. Bando and D. Golberg, ACS Nano, 2013, 7, 1558–1565 CrossRef CAS PubMed.
  32. Q. Weng, B. Wang, X. Wang, N. Hanagata, X. Li, D. Liu, X. Wang, X. Jiang, Y. Bando and D. Golberg, ACS Nano, 2014, 8, 6123–6130 CrossRef CAS PubMed.
  33. F. He, N. Niu, F. Qu, S. Wei, Y. Chen, S. Gai, P. Gao, Y. Wang and P. Yang, Nanoscale, 2013, 5, 8507–8516 RSC.
  34. D. Zhou, Y. Cui, P. W. Xiao, M. Y. Jiang and B. H. Han, Nat. Commun., 2014, 5, 4716–4722 CrossRef CAS PubMed.
  35. H. Zhao, X. Song and H. Zeng, NPG Asia Mater., 2015, 7, 168–175 CrossRef.
  36. C. L. Su, M. Acik, K. Takai, J. Lu, S. J. Hao, Y. Zheng, P. P. Wu, Q. L. Bao, T. Enoki, Y. J. Chabal and K. P. Loh, Nat. Commun., 2012, 3, 1298–1306 CrossRef PubMed.
  37. Z. Xu, X. Sun and M. A. Khaleel, J. Chem. Phys., 2012, 137, 074702–074709 CrossRef PubMed.
  38. R. Wróbel and W. Arabczyk, J. Phys. Chem. A, 2006, 110, 9219–9224 CrossRef PubMed.
  39. G. P. Ihsan Barin, Thermochemical Data of Pure Substances, Wiley-VCH, 2003 Search PubMed.
  40. H. J. Schulte, B. Graf, W. Xia and M. Muhler, ChemCatChem, 2012, 4, 350–355 CrossRef CAS.
  41. J. Zieliński, I. Zglinicka, L. Znak and Z. Kaszkur, Appl. Catal., A, 2010, 381, 191–196 CrossRef.
  42. L. J. E. Hofer, R. B. Axderson, W. C. Peebles and K. C. Stein, J. Phys. Chem., 1951, 55, 1201–1206 CrossRef CAS.
  43. A. M. Hilmen, E. Bergene, O. L. Lindvag, D. Schanke, S. Eri and A. Holmen, Stud. Surf. Sci. Catal., 2000, 130, 1163–1168 CrossRef.
  44. H. Zhao, Q. Zhu, Y. Gao, P. Zhai and D. Ma, Appl. Catal., A, 2013, 456, 233–239 CrossRef CAS.
  45. M. Casavola, J. Hermannsdörfer, N. de Jonge, A. I. Dugulan and K. P. de Jong, Adv. Funct. Mater., 2015, 25, 5309–5319 CrossRef CAS.
  46. F. Bonnet, F. Ropital, P. Lecour, D. Espinat, Y. Huiban, L. Gengembre, Y. Berthier and P. Marcus, Surf. Interface Anal., 2002, 34, 418–422 CrossRef CAS.

Footnote

Electronic supplementary information (ESI) available: TEM images, XRD pattern and SAED images. See DOI: 10.1039/c6ra05517f

This journal is © The Royal Society of Chemistry 2016
Click here to see how this site uses Cookies. View our privacy policy here.